

We were a minority voice in September and October expecting some relief in equity markets through year-end. In our podcast|videocast we covered this chart (below) which shows that by the time earnings actually decline to their lowest, the stock market has often ALREADY RECOVERED to (or near) NEW HIGHS:
Twitter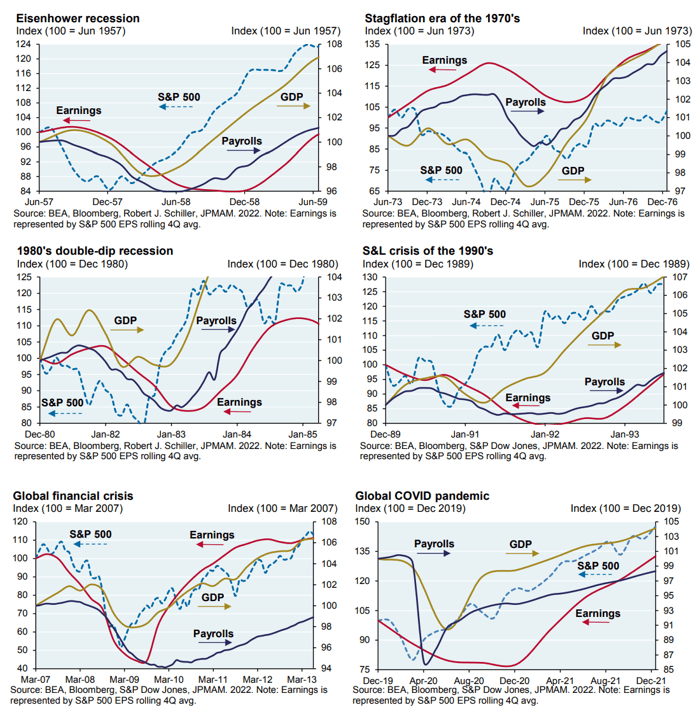
As Warren Buffet says, “if you wait for the robins to sing, it’s already Spring (and you missed it).” So while managers are still sucking their thumbs sitting in cash, know that the “Pain Trade” is UP, not down (despite any short term noise). While everyone waits for the recession “that may have already happened” (in Q1-Q3) and the downward earnings revisions that accompany a recession, review the table above to see where stocks are BY THE TIME EARNINGS HAVE TROUGHED (hint: recovered).
Too many people are anchored by “recency bias” (google it), and believe that the market low MUST COME in March of next year because that’s what happened in 2020 and 2009 (whether they admit it consciously or not). It’s a fallacy and a trap. Anything is POSSIBLE (even new lows in March), but that scenario is not PROBABLE because everyone’s expecting it! More likely than not people will get left behind as no one is positioned for any possible good news and the BAD NEWS is already known (bears think they are seeing something that everyone doesn’t already know).
BofA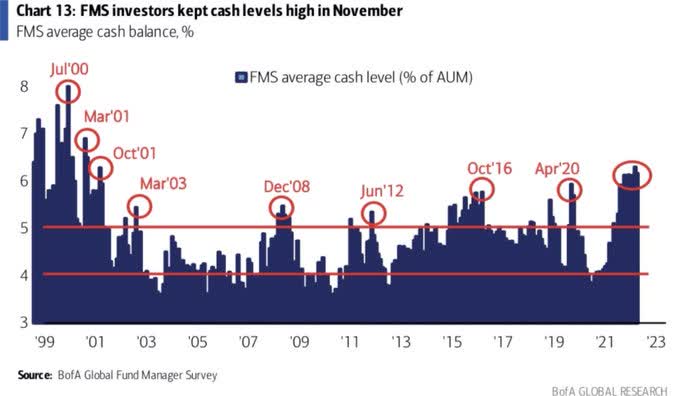
I went into further detail on CNBC Closing Bell (Indonesia) on Friday regarding: Inflation, Fed, Election, Congress, Emerging Markets. Thanks to Fitria Anggrayni and Bramudya Prabowo for having me on.
Monday I joined Kori Hale from brokerage Public.com to discuss a great solid company/stock for 2023 (opinion, not advice see “terms” above). Thanks to Mike Teich and Kori for having me on.
Yesterday I joined Phil Yin on CGTN America to discuss Retail Sales, Earnings, the Holiday Season, Fed, Inflation and more. Thanks to Phil and Ryan Gallagher for having me on.
Sentiment
On Tuesday, I put out a summary of Bank of America’s monthly “Global Fund Manager Survey.” You can find it here:
Here were the 4 key takeaways:
1) Managers are overweight cash and STILL underweight equities. The “pain trade” is still up. Markets don’t crash when everyone is expecting it:
BofA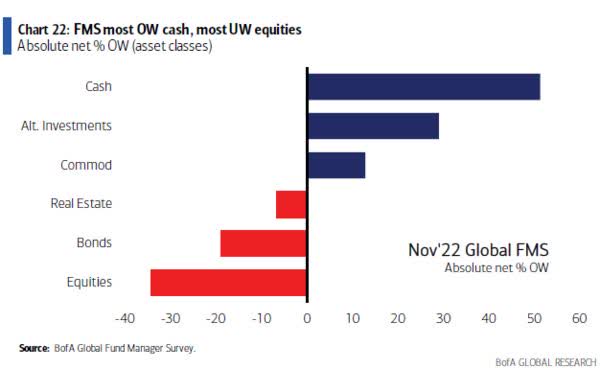
2) Managers are the most underweight Tech since 2008:
BofA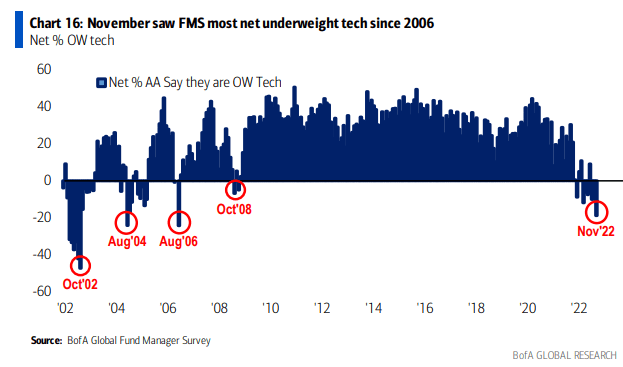
If you were buying high quality tech the last four times managers were this underweight, you made money (see blue lines to the month) below:
Stockcharts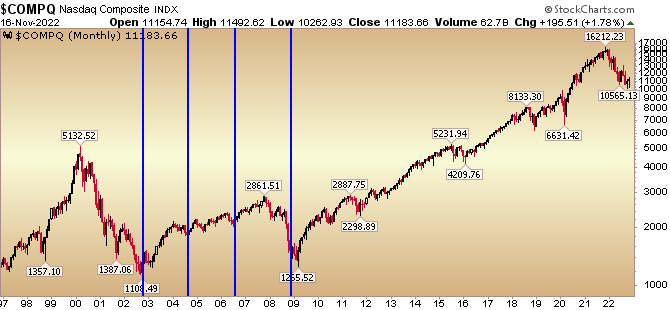
We added select tech/semis in decent size for client portfolios in October. It seems Warren Buffett had similar thinking with his recent $4B purchase of Taiwan Semi (TSM). While most investors were CONVINCED China would attack Taiwan imminently, Buffett swooped in to be “greedy when others were fearful.” This is also in line with a technical signal (we often look to) put out by Sentiment Trader today. Average return for Nasdaq each time this indicator hits (as it has now) is >50% 12 months out:
Twitter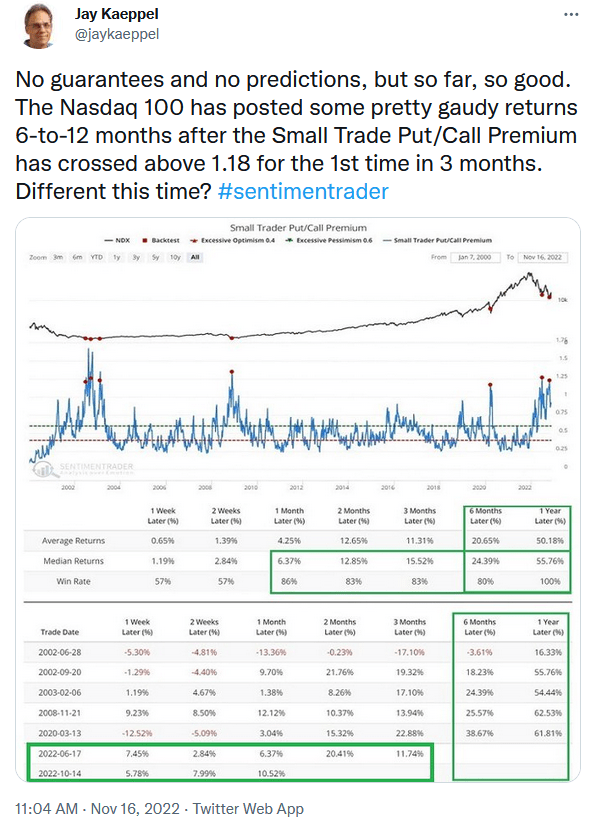
3. Long U.S. dollar is the most crowded trade among managers. Short China Equities is the second most crowded trade. Take the other side of both:
BofA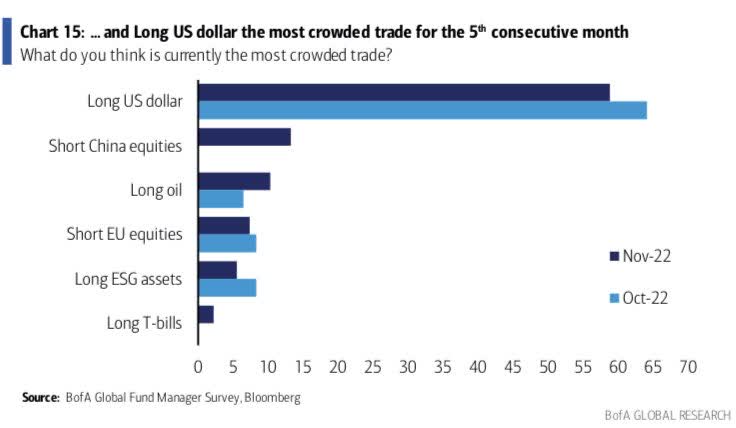
We’ve been pounding the table that it (dollar strength) was going to change soon due to our Commitment of Traders data (you may recognize the chart I put out in October in the context of “Dollar will drop and Chinese equities will rally”). Here’s how that is working so far:
Stockcharts StockCharts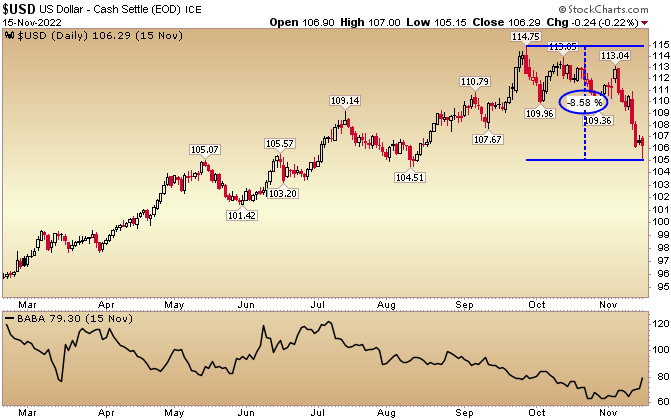
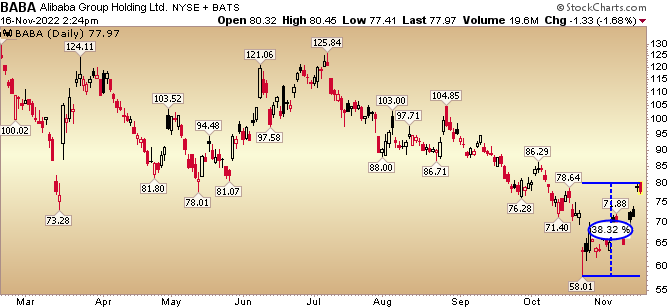
The dollar has fallen over 8% in recent weeks, and Alibaba (BABA, BABAF) is up ~38% off its lows. Expect this to continue in “fits and starts” based on short term noise, but the intermediate trend moving forward is UP. It has helped that President Xi has pivoted (Zero Covid, International Relations, Property Bailout) since securing his power domestically.
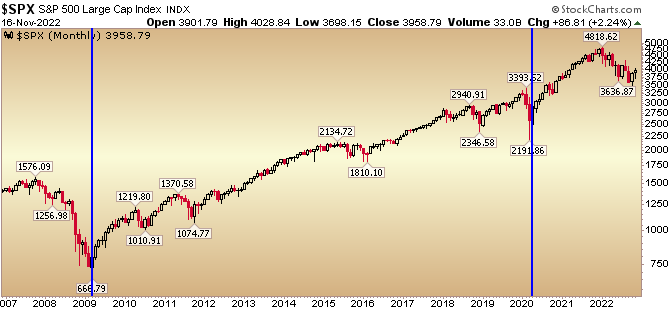
4) Managers are as scared of a recession today as they were in April 2020 and March 2020. While they were RIGHT to be scared, they were WRONG to be in record CASH as the stock market bottomed BEFORE the recession was declared (March 2009 bottom, March 2020 bottom):
BofA StockCharts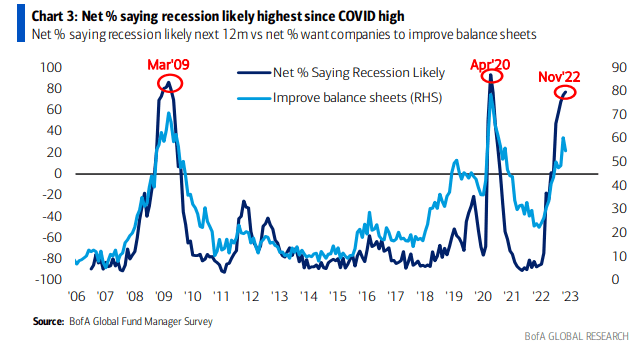
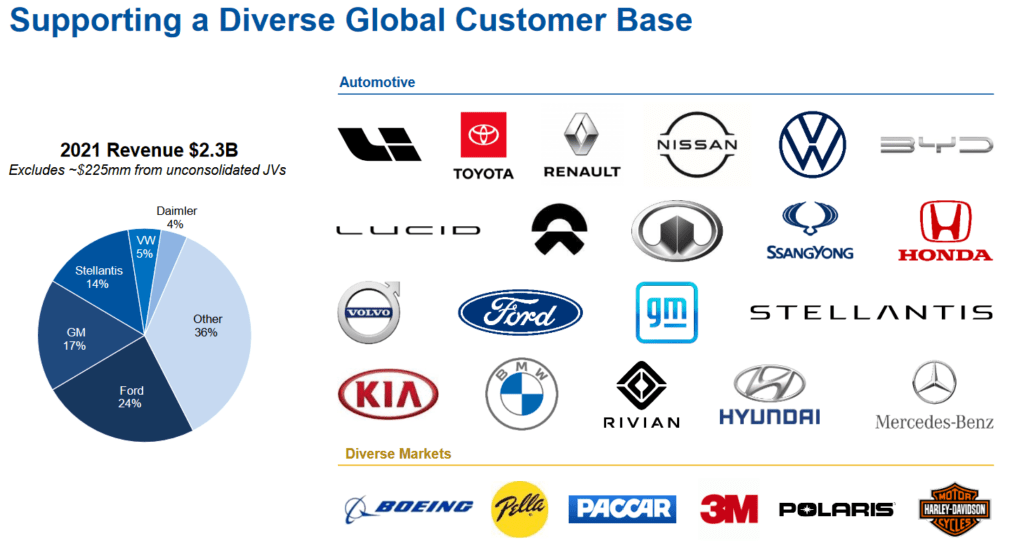
Auto Supplier Update
This week we got some better-than-expected news on Cooper Standard when they announced their “Transaction Support Agreement.” They basically laid out what the new capital structure will look like. You can read the press release here. You can read the full agreement here.
Let me break down how I am understanding the changes in simple terms. Keep in mind they have a PIK toggle feature on the new debt – so at the company’s option – if they choose they can lower interest expense in the short term and pay it later when global production has recovered. Based on operating improvement and cash on hand, it is not clear they will need/choose to take advantage of that option. We will have greater clarity when the transaction is closed in December.
Long Term Debt (Before Agreement):
| Description | Maturity Date | Terms | Amount Issued |
| Term Loan | November 2, 2023 | Eurodollar + 275 | $340MM |
| Senior Secured Notes | June 1, 2024 | 13% | $250MM |
| Senior Unsecured Notes | November 15, 2026 | 5.625% | $400MM |
| Total LT DEBT Outstanding: | $978MM (Q3 2022) | ||
| TOTAL NET CASH INTEREST EXPENSE: | FY 2021 | $72.5MM |
Long Term Debt (After Completed):
| Description | Maturity Date | Terms | Amount Issued |
| Senior Secured Notes | 2027 | 5.625% (pik toggle option) | $400MM |
| Senior Secured First Lien Notes | 2027 | 13.5% (pik toggle option) | $580MM |
| Total LT DEBT Outstanding: | $980MM (Q1 2023) | ||
| ~MAXIMUM NET CASH INTEREST EXPENSE (without PIK): | FY 2023 | ~$100.8MM |
The good news is, there will likely be no maturities before 2027 – which gives the business plenty of time to recover. The bad news is, the interest expense increases up to ~$28.3MM per year. HOWEVER, IF NEEDED TO THEY CAN PIK TOGGLE FOR THE FIRST TWO YEARS (add to balance and pay less interest). Here’s how that works on the new Senior Secured First Lien Notes:
“The New First Lien Notes will bear interest at the rate of ((i)) 13.50% per annum, of which no less than 9.00% will be payable in cash and, at the Issuer’s option for the first four interest periods after issuance, the remaining 4.50% may be paid in cash or PIK (or a combination thereof), and ((II)) thereafter, 13.50% per annum, payable in cash.”
On the new Senior Secured Notes it will work like this:
“The New Secured Notes will bear interest at the rate of 5.625% cash pay per annum, or at the Issuer’s option for the first four interest periods after issuance, 10.625% in PIK, and thereafter, 5.625% per annum, payable in cash.”
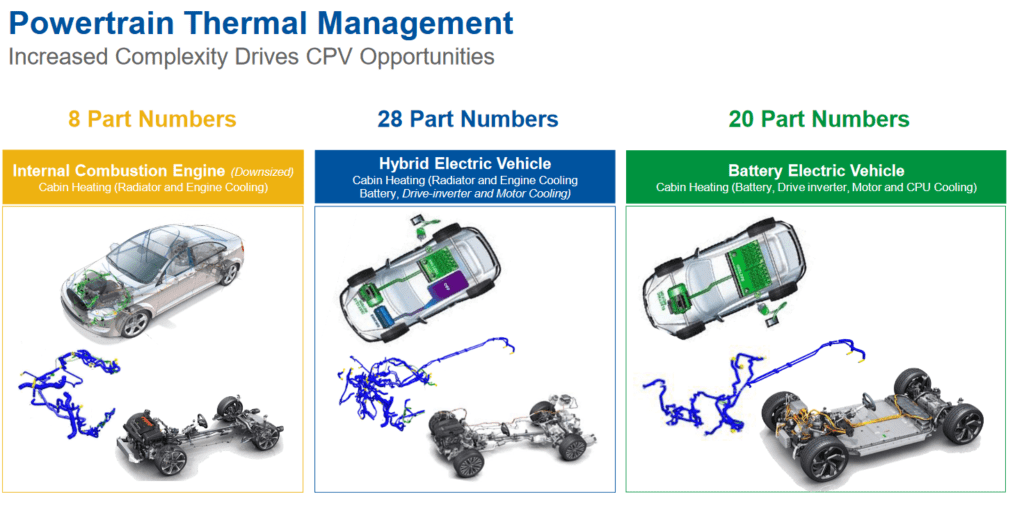
Based on their operational improvement, flow of semiconductors to OEMs, age of fleet (>13.1yrs old) and pent up demand for new cars, I do not think they will have/choose to PIK, but it’s nice that the option will be available in the short term. In this environment, I am amazed they were able to get everything done all at once NOW versus having to manage it over the next year((s)). Now they can get back to doing what they do BEST – leading the field in their 3 core categories.
Cooper Standard Cooper Standard Cooper Standard Cooper Standard Cooper Standard Cooper Standard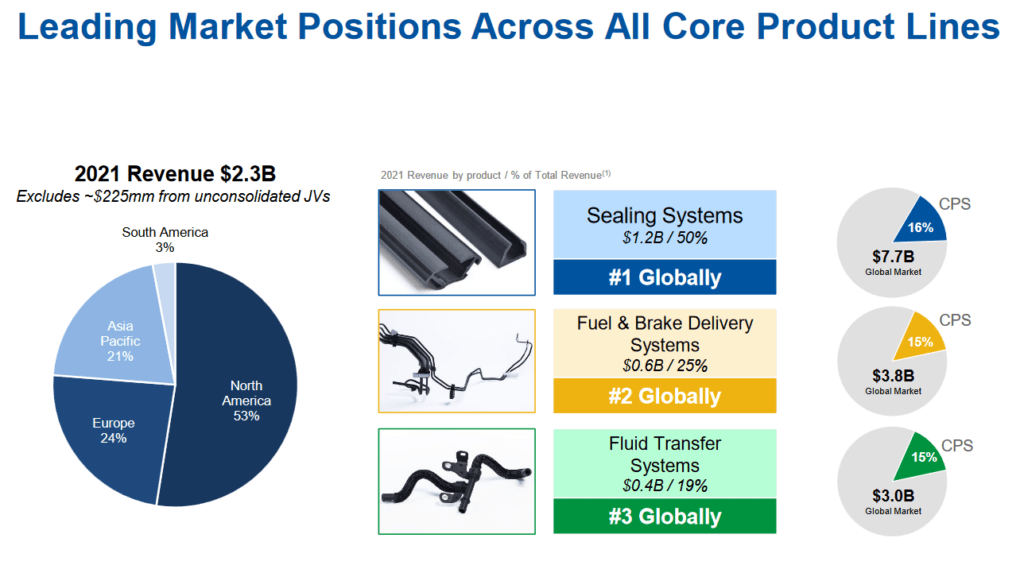
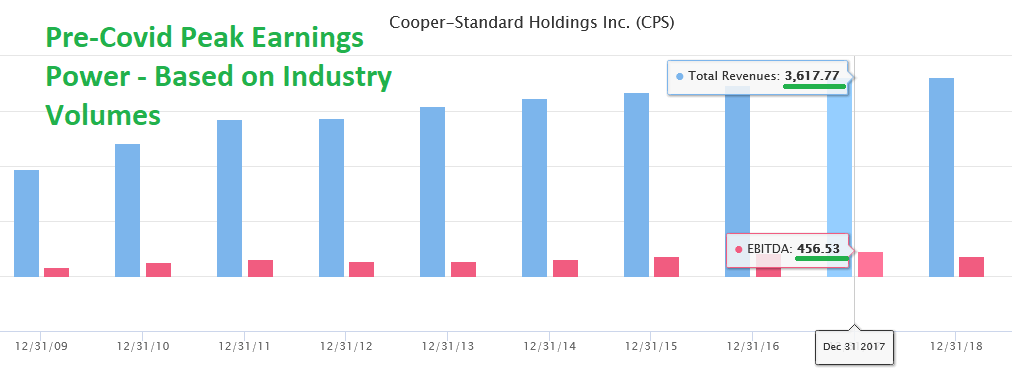
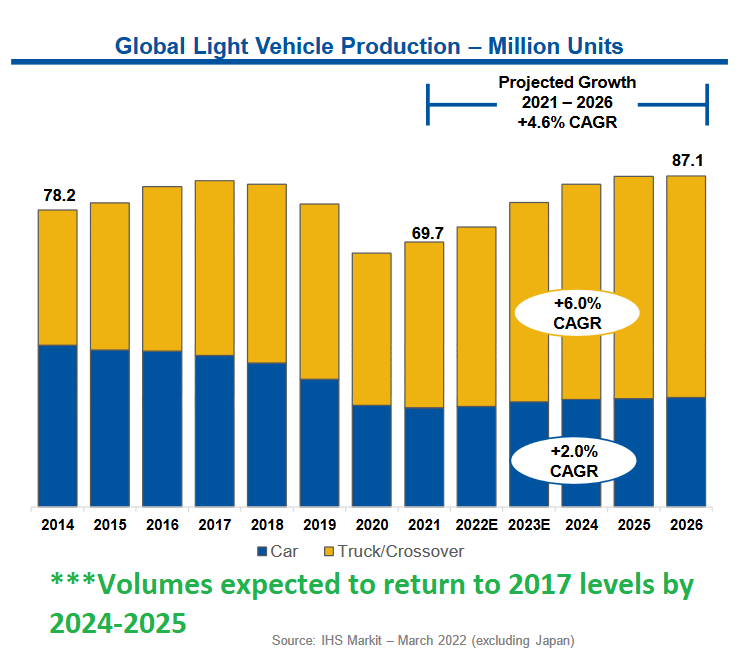
The most important table is the one above with the IHS estimates of Global Light Vehicle production. The key takeaway is that volumes are expected to return to 2017 levels by 2024 or 2025.
Here’s what Cooper Standard achieved in 2017:
$3.62B Revenues
$452M Adj. EBITDA (12.5% of revs)
$135M Net Income (3.73% of revs) ~18.78M fully diluted shares = ($7.21/share EPS)
Peak stock price on $7.21/share EPS was $146.78 (August 3, 2018) = ~20x P/E multiple.
Here’s what Cooper could achieve in 2024-2025 IF INDUSTRY VOLUMES MEET EXPECTATIONS AND RETURN TO 2017 LEVELS:
$3.3B Revenues (Anti-Vibration unit sold. $320M revenue 2017)
$412M Adj. EBITDA (12.5% of revs)
$123M Net Income (3.73% of revs) ~17.16M fully diluted shares = ($7.19/share EPS).
At 10x P/E = $71.90. At 2017 peak multiple = $146.37. Cut both in half and you’re still at a 5-10x+ bagger.
BUT, you say, EPS will be effected by increased interest expense. THAT IS CORRECT. Interest expense in 2017 was $42M, but TAXES were $74M. While the Interest expense in 2024 or 2025 will be ~$100M (assuming they don’t refinance at lower rates in coming year((s))), keep in mind they have $130MM in Deferred Tax Assets. They will just be moving into profitability and will be able to use a significant portion of that asset to dramatically reduce their cash tax obligation. In effect, it’s possible that EPS in 2024 or 2025 could be a tick higher than 2017 on the same volumes. The key will be what multiple is assigned (peak or trough)?
As I have said numerous times on our podcast|videocast, there are 3 key reasons I bought ownership in the company: 1) management respects equity (they have brought share count DOWN over the years), 2) management comp is tied to ROIC (return on invested capital) 3) the operating leverage in this business is unparalleled coming out of industry troughs.
*Past performance is no guarantee of future results. See “terms” above.
So if it’s such good news, why isn’t the stock up a lot more? While they have a committed backstop investor group, the deal still needs to get DONE. It will commence in December and upon completion I would imagine the stock will be materially higher – even before we see the massive operating improvement/leverage kick in in 2023 and beyond.
Here is the short term headwind disclaimer from the press release:
“The Company expects to commence the Exchange Offer, Concurrent Notes Offering and Consent Solicitation in December.
The commencement and consummation of the Refinancing Transactions contemplated by the TSA will be conditioned on the satisfaction or waiver of certain conditions precedent, including finalizing all definitive documents. The Refinancing Transactions may not be completed as contemplated or at all. If the Company is unable to complete the Refinancing Transactions or any other alternative transactions, on favorable terms or at all, due to market conditions or otherwise, its financial condition could be materially adversely affected.”
Now onto the shorter term view for the General Market:
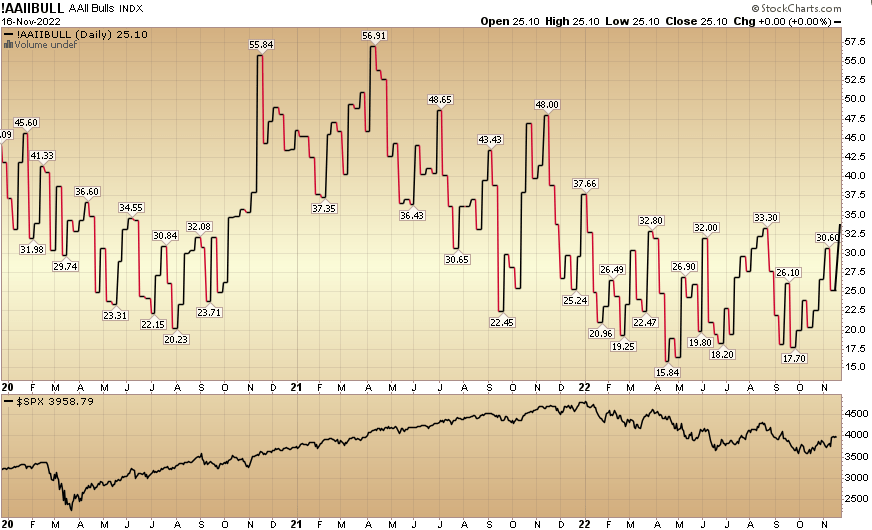
In this last week’s AAII Sentiment Survey result, Bullish Percent rose to 33.5% from 25.1% the previous week. Bearish Percent dropped to 40.2% from 47%. Sentiment is improving.
NAAIM Stockcharts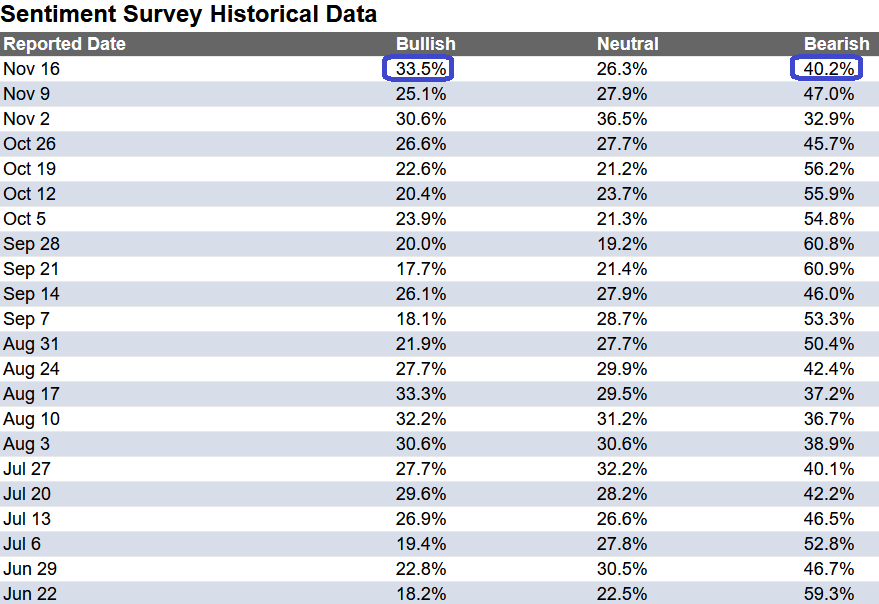
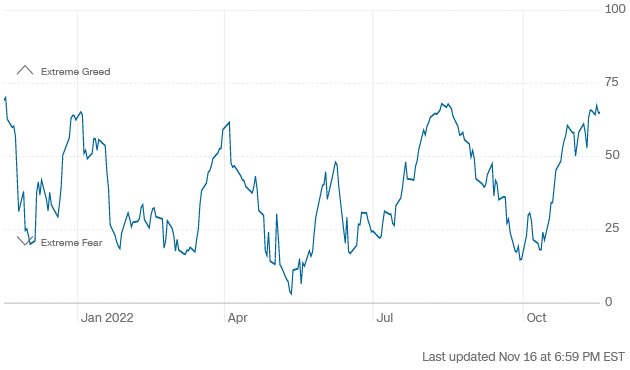
The CNN “Fear and Greed” ticked up from 53 last week to 65 this week. Sentiment is improving.
CNN CNN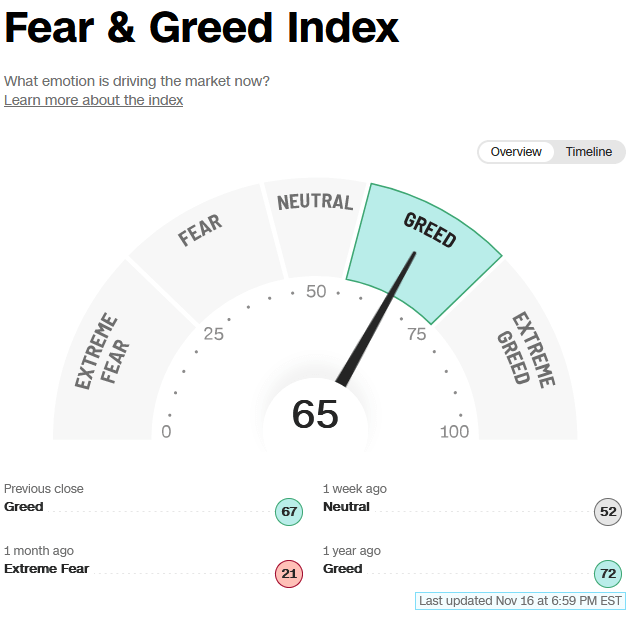
And finally, the NAAIM (National Association of Active Investment Managers Index) ticked down to 53.33% this week from 55.22% equity exposure last week.
Stockcharts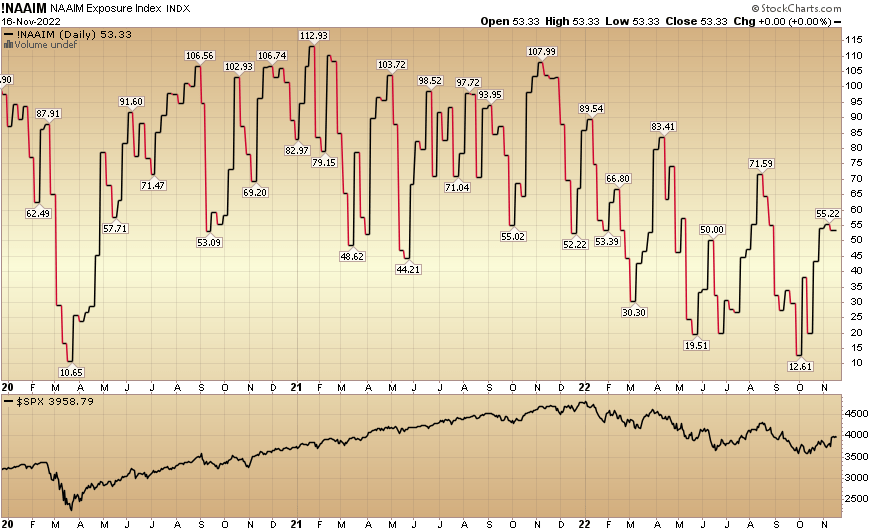
Be the first to comment