


mixmotive
Since 1920, there have now been 32 times that equities show a negative return for the year. We measure the equity here by the S&P 500 (SPX) or an equivalent measure in the early years. The largest single-year drop was 88% in 1931, and in the post-World War II period it was 62% in 2008, then 42% in 1974 and 31% in 2002. Multi-year declines are rare, and even in the 2007-09 financial crisis only one negative period occurred.
The multi-year declines that have occurred were characterized by differing circumstances. The 2007-09 crisis was brought about by a housing crisis that jeopardized the stability of the banking system. The period 2000-02 decline was characterized by the bursting of the dot com internet bubble. The multi-year decline of 1973-74 was induced by a bursting of speculative excesses caused by double digit inflation. In 1939-41, the stock market suffered as World War II raged. And of course, the 1929-33 multiyear decline was associated with the Great Depression induced by speculative excesses and misguided economic policy.
The S&P 500 ended 2022 with a 19% decline; the largest since 2008. In some sense, the decline had elements of all the prior multi-year declines, and it remains to be seen whether this one will be more than an isolated adjustment. During 2022, excesses in meme stocks and SPACs have been purged from the system and the crypto space has been brought back to earth without the damage of the housing bust in 2007. Perceived excess valuations in the growth sector of the Nasdaq have dropped by more than the overall market and like 2000-2002 some think further adjustments are needed. Not unlike 1973-74, a burst of inflation emerged in late 2021 and into 2022 with the Federal Reserve fighting it by draining liquidity from the economy. And of course, the war in Ukraine disrupted food and energy security and disrupted global supply chains.
Given all these, arguably, financial markets have performed quite well in comparison. Indeed, with all these pressures, the financial system seems sound, and credit spreads have yet to signal distress. This raises the hope that 2022 will prove to be a single year event. Forecasts for 2023 range for a further sharp decline to a sharp rebound, with the gap being unusually wide. As for timing, the broad consensus is for a weak first half that is followed by a rebound in the second half.
Full year data for operating profits is still not available, but the FactSet consensus dated December is for about $200 per share. This compares to average analyst estimates of about $220 per share. For consistency, we continue to rely on the FactSet estimate. With the index having ended the year at 3839.5, the implication is for an earnings multiple of 19.2 Thus, nominal profits would have fallen by about 4% for the year while the multiple will have declined from 23 in 2021. Using the Congressional Budget Office baseline macroeconomic estimates as inputs to our models, we had forecast $203 per share in operating earnings and a 19.9 multiple for a year end index value of 4040. This is well within the forecasting error of the models and thus gives us confidence in the construct that we have developed.
As a quick review, we use two independent models; one to forecast profits and a separate one to forecast the market multiple. Profits are explained by nominal and real GDP in logarithmic form and unit labor cost. The first two variables are directly related to profits, while labor cost is inversely related to profits. To estimate the market multiple, we use the Treasury ten year yield and a forward-looking ratio of government spending to nominal GDP. The historical fit for profits is shown as Chart I attached, and the fit for the multiple is shown as Chart II attached.
The accompanying table I shows two alternative forecast paths for profits, the multiple and the S&P index for 2023. The first alternative is the proverbial soft landing. We prefer this because we think inflation will slow sustainably in the year’s first half; labor markets will loosen; and productivity will rebound. In this scenario, we would expect a stabilization of monetary policy by winter’s end, allowing the ten-year treasury yield to fall below 3% from the year end 2022 rate of 3.88%. Operating earnings would rise from $200 in 2022 to a model forecast of $223 per share, while the multiple would hold steady at 19.2. The result would be a yearend S&P index value of 4281.6 for an 11.5% rise over the 2022 level. This would avoid a multiyear decline in the index.
The second alternative is for a proverbial hard landing, in that the economy suffers through a second dip and a real recession. In this case, real GDP growth drops by 2% in 2023 while inflation remains stubbornly high at around 4%. This forces the Federal Reserve into a posture of continued monetary restraint. In this scenario, the ten-year treasury yield is at 4.2% as shown on the table. As shown, operating earnings would fall below the 2022 level, hitting $152 per share. The multiple also contracts owing to continued high interest rates, falling to 17 versus 19.2 in 2022. The S&P index is thus at 2584 in 2023 for a 33 % decline and a second consecutive yearly drop.
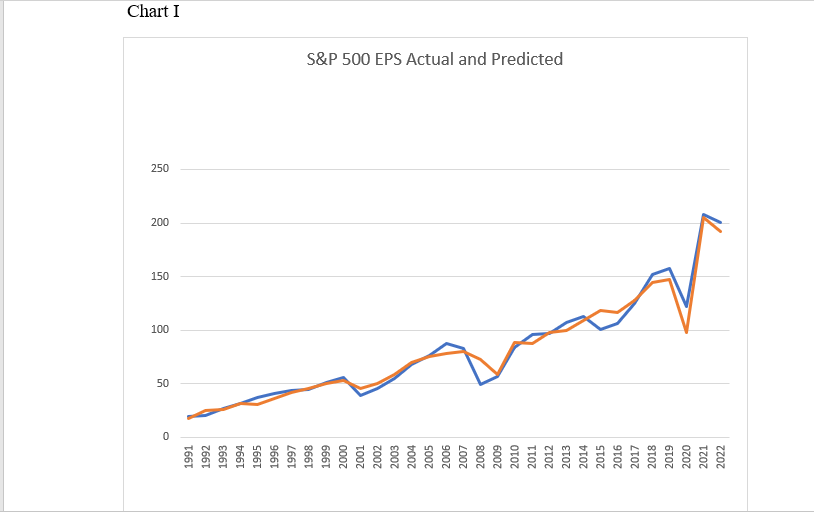
S&P 500 Actual and Model (S&P 500 Actual and Model )
Sources: CBO, S&P, authors’ models
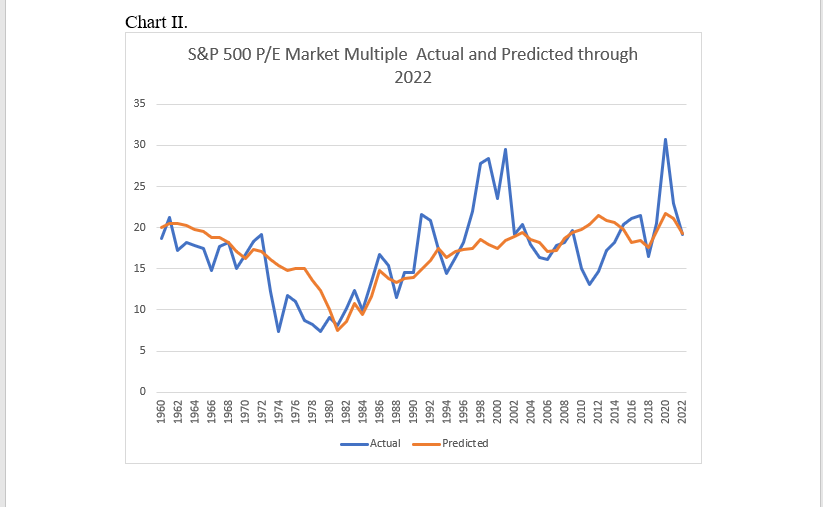
S&P 500 P/E Actual and Predicted (S&P 500 P/E Actual and Predicted)
Sources: CBO, S&P, authors’ models
|
Table I Profits Forecast |
actual |
estimate |
forecast |
|||
|
2021 |
2022 |
2023 |
||||
|
FactSet earnings 12-22-2022 |
$208.21 |
$200.19 |
$226.41 |
|||
|
Soft Landing |
2021 |
2022 |
2023 |
|||
|
Real GDP % Change |
5.7 |
2.1 |
3 |
|||
|
GDP Price Index % Change |
4.2 |
5.2 |
2.5 |
|||
|
ULC |
2.2 |
4.2 |
1.3 |
|||
|
Wages |
4.0 |
5.6 |
4.0 |
|||
|
Productivity |
1.8 |
1.4 |
2.7 |
|||
|
10-year Treasury interest rate |
1.4 |
3 |
2.9 |
|||
|
S&P 500 earnings |
$208.21 |
$200.19 |
$223 |
|||
|
S&P 500 Market p/e Multiple |
22.89 |
19.2 |
19.2 |
|||
|
S&P 500 |
4766.18 |
3839.5 |
4281.6 |
|||
|
Hard Landing |
||||||
|
Real GDP % Change |
5.7 |
2.1 |
(2) |
|||
|
GDP Price Index % Change |
4.2 |
5.2 |
4.0 |
|||
|
ULC |
2.2 |
4.2 |
5.0 |
|||
|
Wages |
4.0 |
5.6 |
6.0 |
|||
|
Productivity |
1.8 |
1.4 |
1.0 |
|||
|
10-year Treasury interest rate |
1.4 |
3 |
4.2 |
|||
|
S&P 500 earnings |
$200.19 |
$152 |
||||
|
S&P 500 Market p/e Multiple |
22.89 |
19.2 |
17 |
|||
|
S&P 500 |
4766.18 |
3839.5 |
2584 |
|||
Sources: CBO, S&P, authors’ models
Please note that this article was written by Dr. Vincent J. Malanga and Dr. Lance Brofman with sponsorship by BEACH INVESTMENT COUNSEL, INC. and is used with the permission of both.
Be the first to comment