

John Kevin/iStock via Getty Images
The latest bout of oil price volatility has the sell-side and traders scratching their heads. Some are calling it capitulation by the bulls and some are calling it algo liquidation. Our theory is much simpler. The market knows that global oil demand comes under pressure when crude + refining margin reaches the $170 to $180/bbl range. As a result, the market is trying to test how low oil prices can go before seeing a rebound in oil demand.
During the price drop yesterday, crude + refining margin fell below $140/bbl and is currently back to $148/bbl. We believe that the $140 to $150/bbl range will be where oil demand starts to surprise back to the upside.
Like any theory, we can validate this via the data provided by the EIA. While it’s not perfect, it’s the best data we have on demand.
EIA, HFIR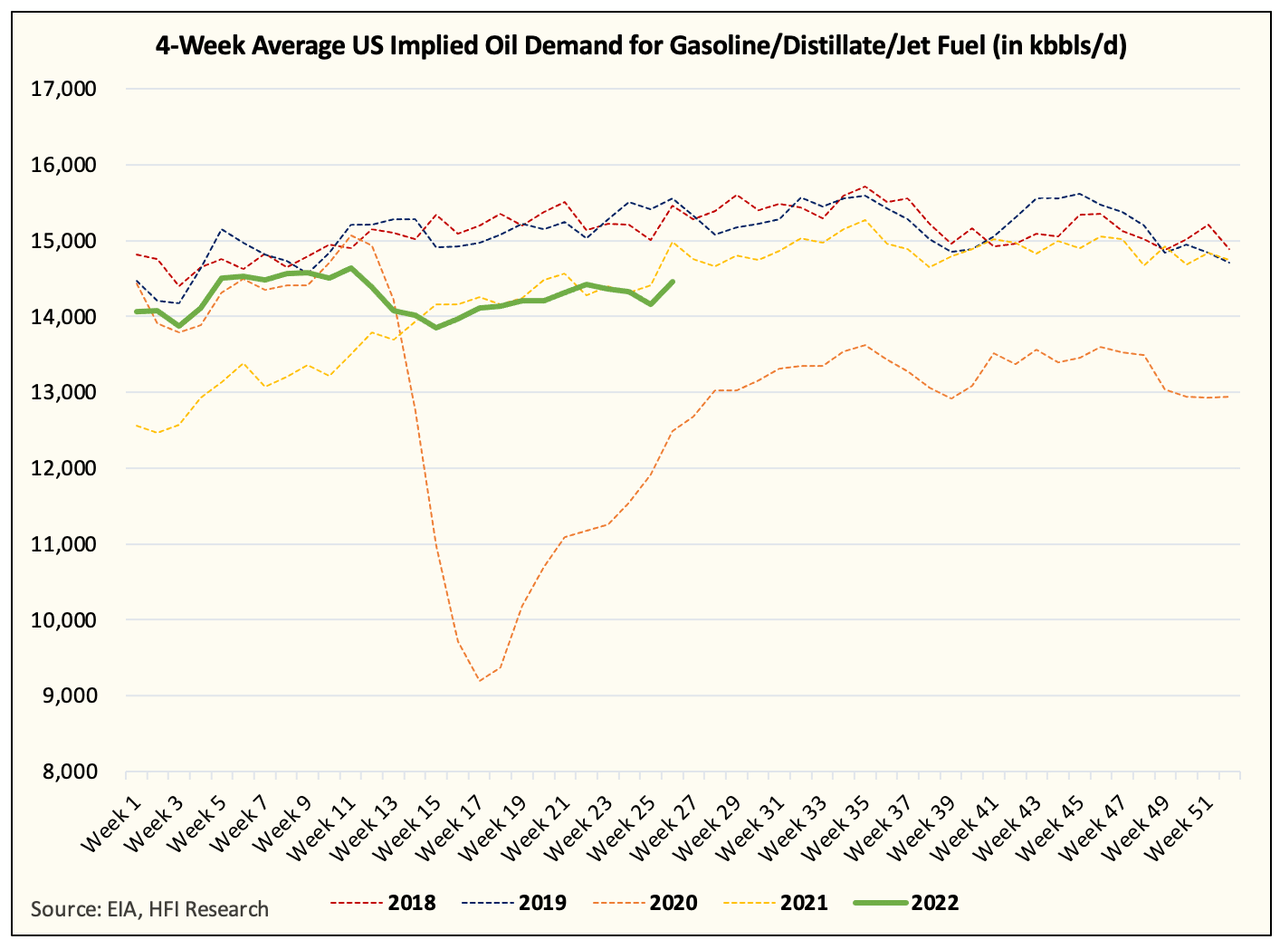
Here’s the implied oil demand chart for gasoline, distillate, and jet fuel. Notice how in this week’s weekly data, we saw a big bump in the big 3. As we said in a tweet last Friday, there is usually a lag between wholesale and retail inventory. If consumers are filling up their cars at a gas station, the wholesale level won’t see a reduction in inventory until the gas stations get low. This is why the demand figures, in a way, are a lagging indicator as well, but it’s the best we have.
Judging by the latest anecdotal data from Apple, Gasbuddy, and others, we believe we should see demand improve over the coming weeks. The market, rightfully so, should take it as a hint that at the current range of $140 to $150 (crude + refining margin), oil demand should start to pick back up.
This will need to be validated over a few months before the market gets comfortable that this is, in fact, the lower end of the price band. Once it does, however, it will send a very powerful signal throughout the rest of the market.
Why is this so important for investors?
During the recent crude rally from $100 to $125, energy stocks did not match both the intensity and the fundamental reality of the price rise. This makes sense considering if the market believes this rally to be temporary, no one would underwrite energy stocks using $125/bbl WTI, for example.
As a result, in the eyes of investors, the key is not figuring out how high oil prices could go, but rather how low oil prices could go. This is why this process of finding the lower price band (that will help push demand back up) is so important. Once investors see that the $140 to $150 (crude + refining margin) range is the lower band, then energy stocks will gradually start to reflect that via a multiple expansion.
The nice thing for energy investors today is that while we all have our theories on where this lower price band is, we can be confident in the fact that: 1) the physical oil market remains bullish, and 2) global oil inventories are still trending lower albeit at a slower pace.
In the meantime and amidst all this volatility, energy companies are making more money than ever allowing the excess free cash flow to be used towards share buybacks and dividends. It will become more evident in the coming months that shareholder returns will increase proportionally to the increase in oil, and this will be a key catalyst in not only keeping energy stocks from further declining from here but enticing more investors to this sector.
So as the market tries to figure out the lower price band, we think this process is not only necessary but vital to a potential expansion in the trading multiples in energy stocks. With the floor being tested, investors will feel more comfortable and be able to confidently underwrite energy stocks using a “base case” scenario on a forward-looking basis. This should, in turn, help push higher multiples and attract new investors.
Be the first to comment