

bjdlzx
During the past month, Energy Transfer LP (NYSE:ET) stock price experienced significant ups and downs; however, the current stock price is equal to its level six months ago. Due to the winter season (from October 2022 to March 2023), U.S. oil and natural gas consumption will increase. Also, U.S. oil and natural gas exports increase as a result of the Europe energy crisis. I expect ET’s financial results in the coming quarters to be strong. The stock is a buy.
Quarterly highlights
In its 2Q 2022 financial results, ET reported intrastate transportation and storage adjusted EBITDA of $218 million, down 3% YoY, driven by the increased cost of products sold (up 178% YoY) and partially offset by increased natural gas transportation volumes (up 22% YoY). ET’s intrastate transportation and storage revenues increased from $949 million in 2Q 2021 to $2203 million in 2Q 2022.
The company’s interstate transportation and storage adjusted EBITDA increased by 20% YoY, driven by increased natural gas transportation volumes (up 42% YoY) due to the impact of the Enable acquisition, higher utilization, and increased production. ET’s midstream adjusted EBITDA jumped by 90% to $903 million. ET’s midstream revenues increased from $2199 million in 2Q 2021 to $5050 million in 2Q 2022.
The company’s NGL and refined products transportation and services adjusted EBITDA increased from $736 million in 2Q 2021 to $763 million in 2Q 2022, driven by increased NGL transportation volumes, increased refined products transportation volumes, increased NGL and refined products terminal volumes, and increased NGL fractionation volumes. Also, ET’s crude oil transportation and services adjusted EBITDA increased by 16% YOY to $562 million, driven by increased crude oil transportation volumes, and increased crude terminal volumes. The company’s crude oil and transportation services revenues increased by 65% YoY to $7300 million in 2Q 2022. ET’s total adjusted EBITDA increased from $2616 million in 2Q 2021 to $3228 million in 2Q 2022.
The market outlook
Due to colder weather in the following months, household expenditures for heating oil and natural gas will increase. According to EIA‘s newest short-term energy outlook, U.S. crude oil production will increase from 11.7 million b/d in 2022 to 12.4 million b/d in 2023, higher than the record high in 2019. U.S. oil production will continue increasing as oil prices will remain high due to the OPEC+ production cut of 2 million barrels per day, continuing war in Ukraine which has caused sanctions on Russian oil, and continuing sanctions on Iranian oil. However, due to the global recession, I do not expect oil prices to increase to their record highs.
EIA expects that the U.S average household natural gas consumption increase by 4.5% YoY from 62.4 Mcf in the winter of 2021-22 to 65.2 Mcf in the winter of 2022.23. More natural gas consumption means more natural gas transportation volumes. Also, U.S. average household heating oil consumption is expected to increase by 8.7% from 477 gallons during the winter of 2021-22 to 519 gallons during the winter of 2022-23 (see Figure 1)
Figure 1 – Average household natural gas and heating oil consumption
eia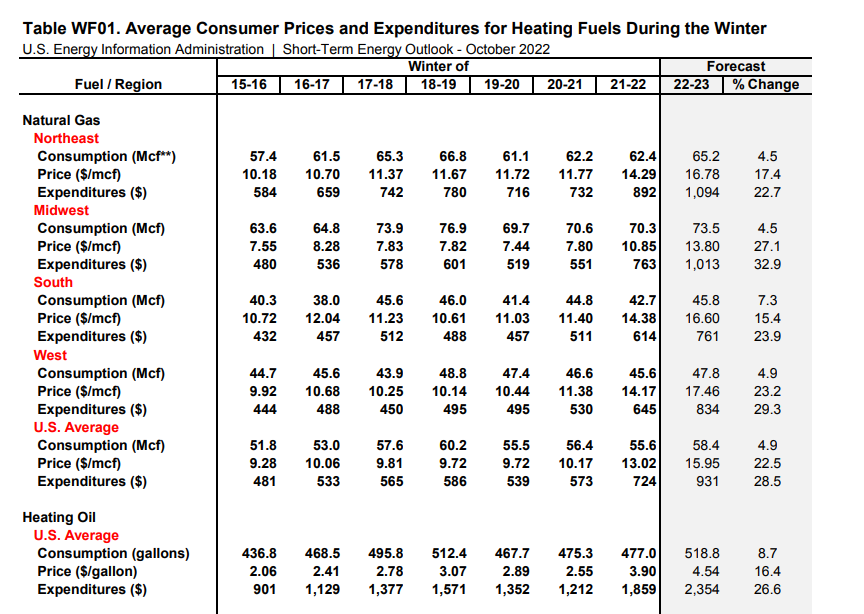
U.S. crude oil production has increased from 11.69 million barrels per day in 2Q 2022 to 11.83 million barrels per day in 3Q 2022. The production is expected to increase to 11.99 million barrels per day in 4Q 2022 and 12.27 million barrels per day in 1Q 2023. Dry natural gas production increased from 97.55 billion cubic feet per day in 2Q 2022 to 98.48 Bcf/d in 3Q 2022. U.S. dry natural gas production is expected to increase to 99.05 Bcf/d in 4Q 2022 and 99.20 Bcf/d in 1Q 2023. U.S. natural gas consumption increased from 76.42 Bcf/d in 2Q 2022 to 80.07 Bcf/d in 3Q 2022. U.S. natural gas consumption is expected to increase to 90.20 Bcf in 4Q 2022 and 102.96 Bcf in 1Q 2023 (see Figure 2)
Figure 2 – U.S. energy production and consumption
eia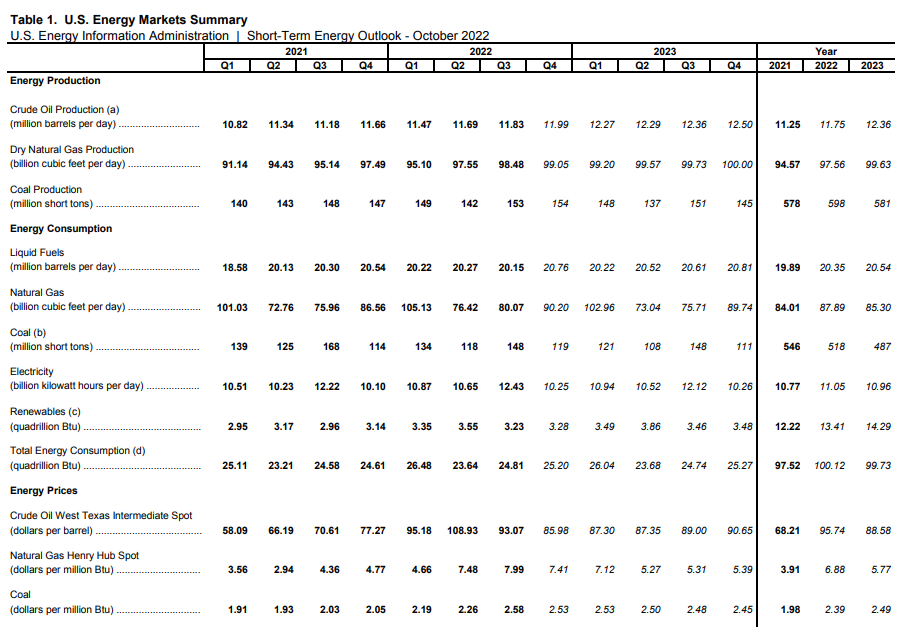
U.S. net imports of crude oil have been decreasing in the past years as the country’s oil production and exports increased due to higher oil prices and global demand. Europe’s sanctions on Russian oil as a result of the war in Ukraine increased U.S. production and exports further. EIA expects U.S. net imports to decrease to about -2 million barrels per day by the end of 2022 (see Figure 3). U.S. net export of propane, ethane, natural gasoline, and butanes increased significantly in the past few years. EIA expects the country’s net exports of hydrocarbon gas liquids to continue increasing as U.S. production and global demand climb (see Figure 4). Figure 5 shows that U.S. natural gas production and consumption will increase in the fourth quarter of 2022 and the first quarter of 2023. Also, natural gas net storage withdrawals will increase significantly in 1Q 2023.
Figure 3 – U.S. net imports of crude oil and liquid fuels
eia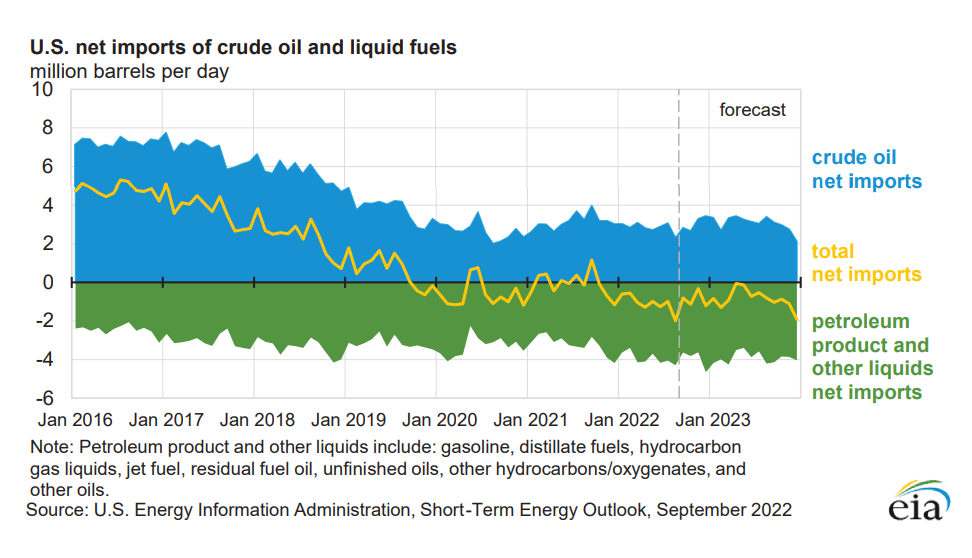
Figure 4 – U.S. net trade of hydrocarbon gas liquids
eia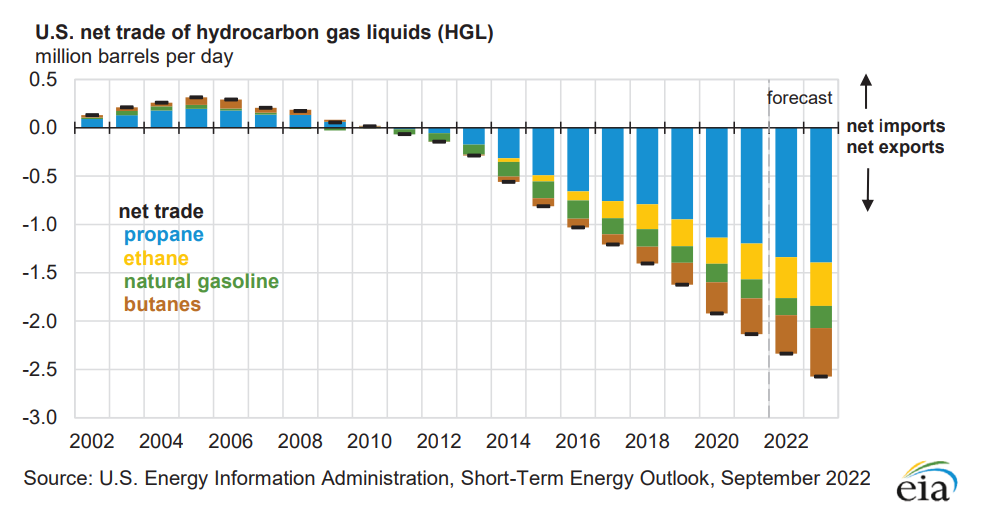
Figure 5 – U.S. natural gas production, consumption, and net imports
eia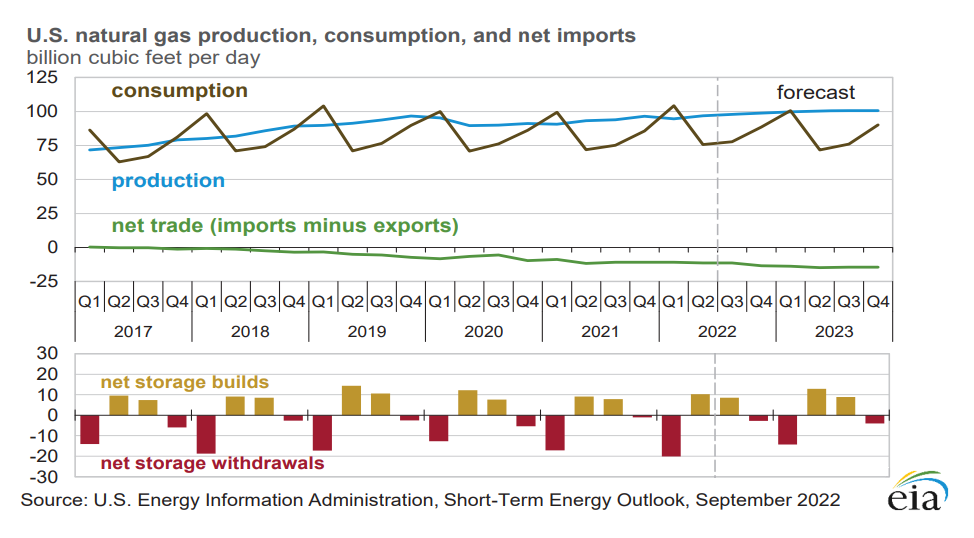
17% of ET’s adjusted EBITDA belongs to the crude oil segment, which has significant connectivity to the Permian, Bakken, and Midcon Basins. Also, 28% of ET’s adjusted EBITDA belongs to the midstream (natural gas) segment, which has strong connectivity to the company’s operations in Permian, Eagle Ford, Anadarko, and Marcellus/Utica Basins. Figure 6 shows that oil production in Permian Basin is expected to increase from 5403 thousand barrels per day in October 2022 to 5453 thousand barrels per day in November 2022. Also, oil production in the Bakken Basin is expected to increase from 1168 thousand barrels per day in October 2022 to 1190 thousand barrels per day in November 2022. Moreover, natural gas production in Permian Basin is expected to increase by 127 million cubic feet per day in November 2022. In November 2022, Natural gas production in Eagle Ford and Anadarko is expected to increase by 91 and 1 million cubic feet per day, respectively.
Thus, I expect ET’s intrastate & interstate transportation and storage adjusted EBITDA to increase in the following quarters. Also, I Expect ET’s midstream adjusted EBITDA to increase in the winter of 2022-2023 due to higher gathered volumes and higher NGLs production. Moreover, I expect the company’s NGL and refined products transportation and services adjusted EBITDA in the second half of 2022 and first quarter of 2023 to jump due to higher volumes and production from the Permian and Eagle Ford regions, higher volumes on propane and ethane export pipelines into Nederland Terminal, and refined product demand recovery. Finally, I expect ET’s crude oil transportation and services adjusted EBITDA to increase in the following quarters due to continued recovery in crude oil production in the Texas pipeline system and Bakken pipeline as a result of high crude oil prices, increased refinery demand, and increased export activity.
Figure 6 – Oil and natural gas production by region in October and November 2022
eia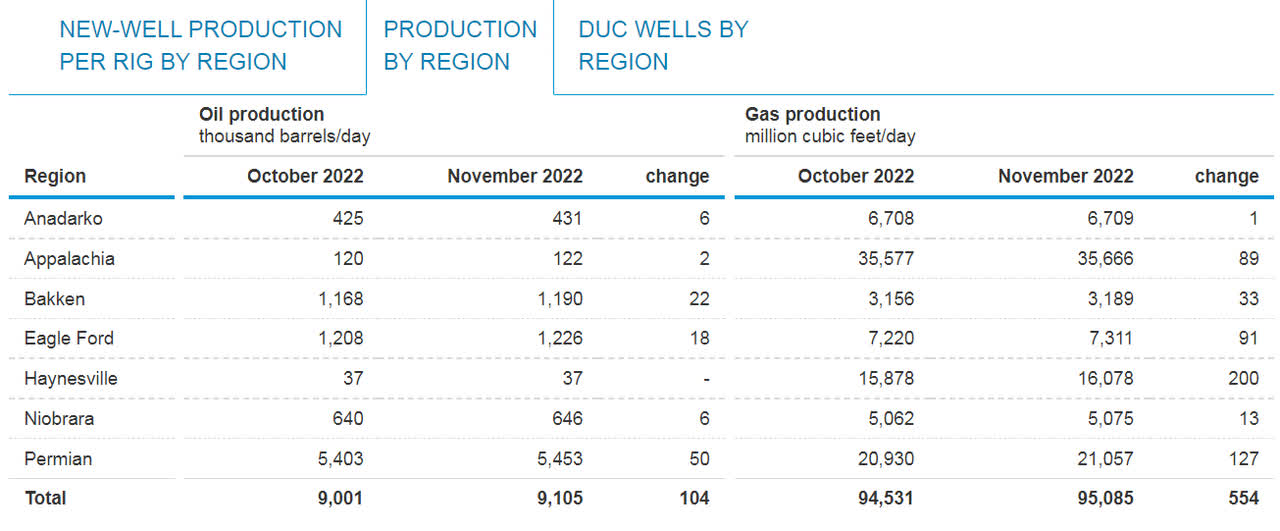
Energy Transfer’s performance outlook
In this detailed analysis, I have investigated Energy Transfer performance across the board of leverage and coverage ratios. Leverage ratios could be very insightful to show how the company is financing its assets and business operations. In other words, does it use debt or equity financing for most of its operations? In this analysis, I used some common leverage ratios that have significant comparability to its debt. The ratios are calculated in comparison with previous years to be more helpful.
The debt-to-assets ratio is one of the significant calculations that measures the company’s debt capacity. This ratio indicates the proportion of assets that are being financed with debt. Thereby, the higher the ratio, the greater the degree of leverage and financial risks. It is observable that after the downturn of 2020, the debt-to-asset ratio of Energy Transfer has decreased to 0.48 and 0.45 in 2021 and TTM, respectively. Moreover, ET’s debt-to-EBITDA ratio, which determines the probability of defaulting on debt, decreased to 4.04 in TTM versus its level of 4.12 in 2021. Finally, Energy Transfer’s asset-to-equity ratio has been on a downward path continuously during recent years and sat at 2.14 in TTM compared with its level of 2.47 at the end of 2021. The decreasing assets-to-equity ratio indicates that the company uses lower debt to finance its assets. As a result, the leverage ratios of Energy Transfer prospect the company’s solvency and its ability to meet its current and future obligations (see Figure 7).
Figure 7 – ET’s leverage ratios
Author (based on SA data)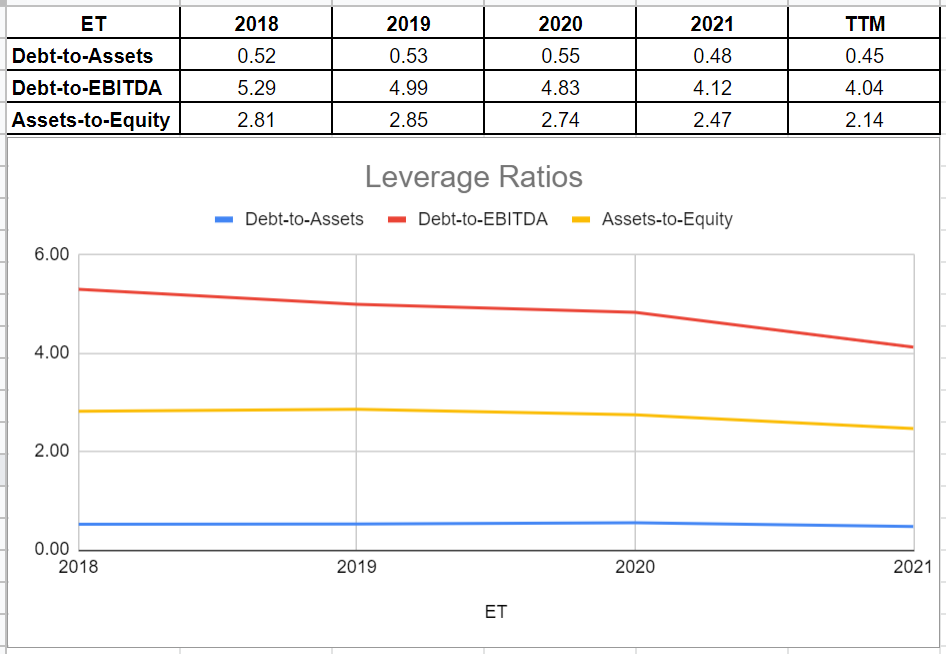
Besides the mentioned ratios, I investigated coverage ratios of Energy Transfer to measure the company’s ability to pay its financial obligations. Generally, it is observable that the coverage ratios of ET have improved during recent years. Albeit declining slightly to 3.67 in TTM compared with its previous level of 4.00 in 2021, ET’s ICR has developed impressively during recent years. This ratio indicates the number of times a company is able to pay its interest expenses on its debt with its operating income. Furthermore, as a conservative metric, the cash coverage ratio compares the company’s cash generation with its interest expenses. ET’s cash coverage ratio increased slightly to 0.18 in TTM versus its previous level of 0.15 at the end of 2021. Thus, Energy Transfer’s coverage ratios prospect its capability of meeting its financial obligations and providing returns for its investors (see Figure 8).
Figure 8 – ET’s coverage ratios
Author (based on SA data)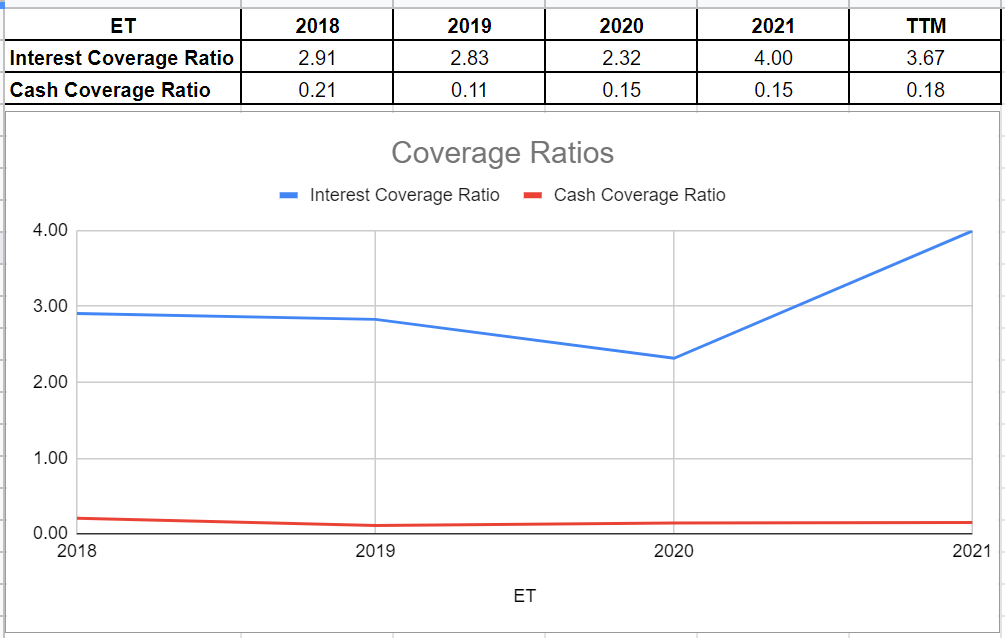
Summary
Crude oil and natural gas prices are high due to the war in Ukraine and increasing demand for U.S. oil and natural gas. Energy Transfer is well-positioned to benefit from the strong energy market condition in the next six months. Also, its leverage ratios and coverage ratios indicate that the stock is financially healthy and can cover its obligations and reward its shareholders. I am bullish on ET.
Be the first to comment