

Anna Koberska/iStock via Getty Images
Energy may power the world, but food provides the nutrition that sustains life. Increasing energy demand in the wake of the pandemic, a shift in US energy policy, the war in Ukraine, and sanctions on Russia have created an almost perfect bullish storm in traditional fossil fuel prices. Over the past months, coal prices have soared to a record high, and oil and gas prices to multi-year peaks. At the end of last week, thermal coal for delivery in Rotterdam was trading at the $295 per ton level. Before October 2021, the all-time high was $224. In March 2022, the price spiked higher to the $465 level.
Crude oil prices at over $100 per barrel are at the highest level since 2014. In March, prices soared to over $130 per barrel, the highest level since 2008. At over $7 per MMBtu, natural gas is at the highest price in April in fourteen years. Higher energy prices increase the production costs for many other commodities, and agricultural products are no exception. Moreover, agricultural commodity prices have soared to multi-year highs as the war in Ukraine and sanctions on Russia create a potent bullish cocktail for the products that feed the world as the planting season in the Northern Hemisphere is now underway.
Each year, the weather across the fertile growing regions determines the path of least resistance for grain and oilseed prices. In April 2022, agricultural products have a lot more to worry about than Mother Nature. The Invesco DB Agricultural ETF product (NYSEARCA:DBA) holds long positions in the leading agricultural products.
The Latest April WASDE Report Takes A Backseat To The Geopolitical Landscape
On April 8, the USDA released its monthly World Agricultural Supply and Demand Estimates Report on April 8 at the start of the 2022 planting season in the northern hemisphere. The USDA qualified the report, writing:
Note for the USDA qualifying the April WASDE Report (USDA)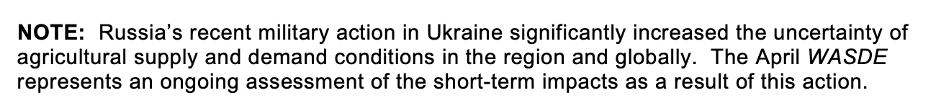
The monthly WASDE report is the gold standard for supply and demand data for agricultural producers and consumers. The war in Ukraine has severe ramifications for the commodities that feed the world, as Ukraine and Russia are Europe’s breadbasket. Moreover, Russia is a leading fertilizer producer and exporter, impacting farmers worldwide. The entire April WASDE report is available through this link.
I reached out to Sal Gilberte, the founder of the Teucrium family of grain and oilseed ETF products, including the WEAT, CORN, and SOYB ETFs. Sal told me:
The April WASDE pretty much came in as expected confirming tightening global grain supplies and much of the expected decline in South American soybean crops. At this point it would seem markets have become accustomed to higher volatility and prices as it awaits clarity on the true size of the Southern Hemisphere’s soybean harvest as well as planting progress across the entire Northern Hemisphere, including the spring planting (or not) of corn in Ukraine. Markets will digest information according to the agricultural calendar from this point forward, with uncertainty being the only certainty for at least the next six months. Things to watch closely through mid-summer are the soybean harvest in South America, planting progress across the US, Europe, and Russia, the summer wheat harvest (of maturing winter wheat) in Russia and possibly Ukraine, and the upcoming May WADE report that will give a first glimpse into the 22/23 growing season.
The bottom line is that geopolitical dynamics are trumping the weather for the commodities that feed the world in 2022.
Wheat Rose To A Record High In March
CBOT soft red winter wheat is the worldwide benchmark for the primary ingredient in bread.
Quarterly CBOT Wheat Chart (CQG)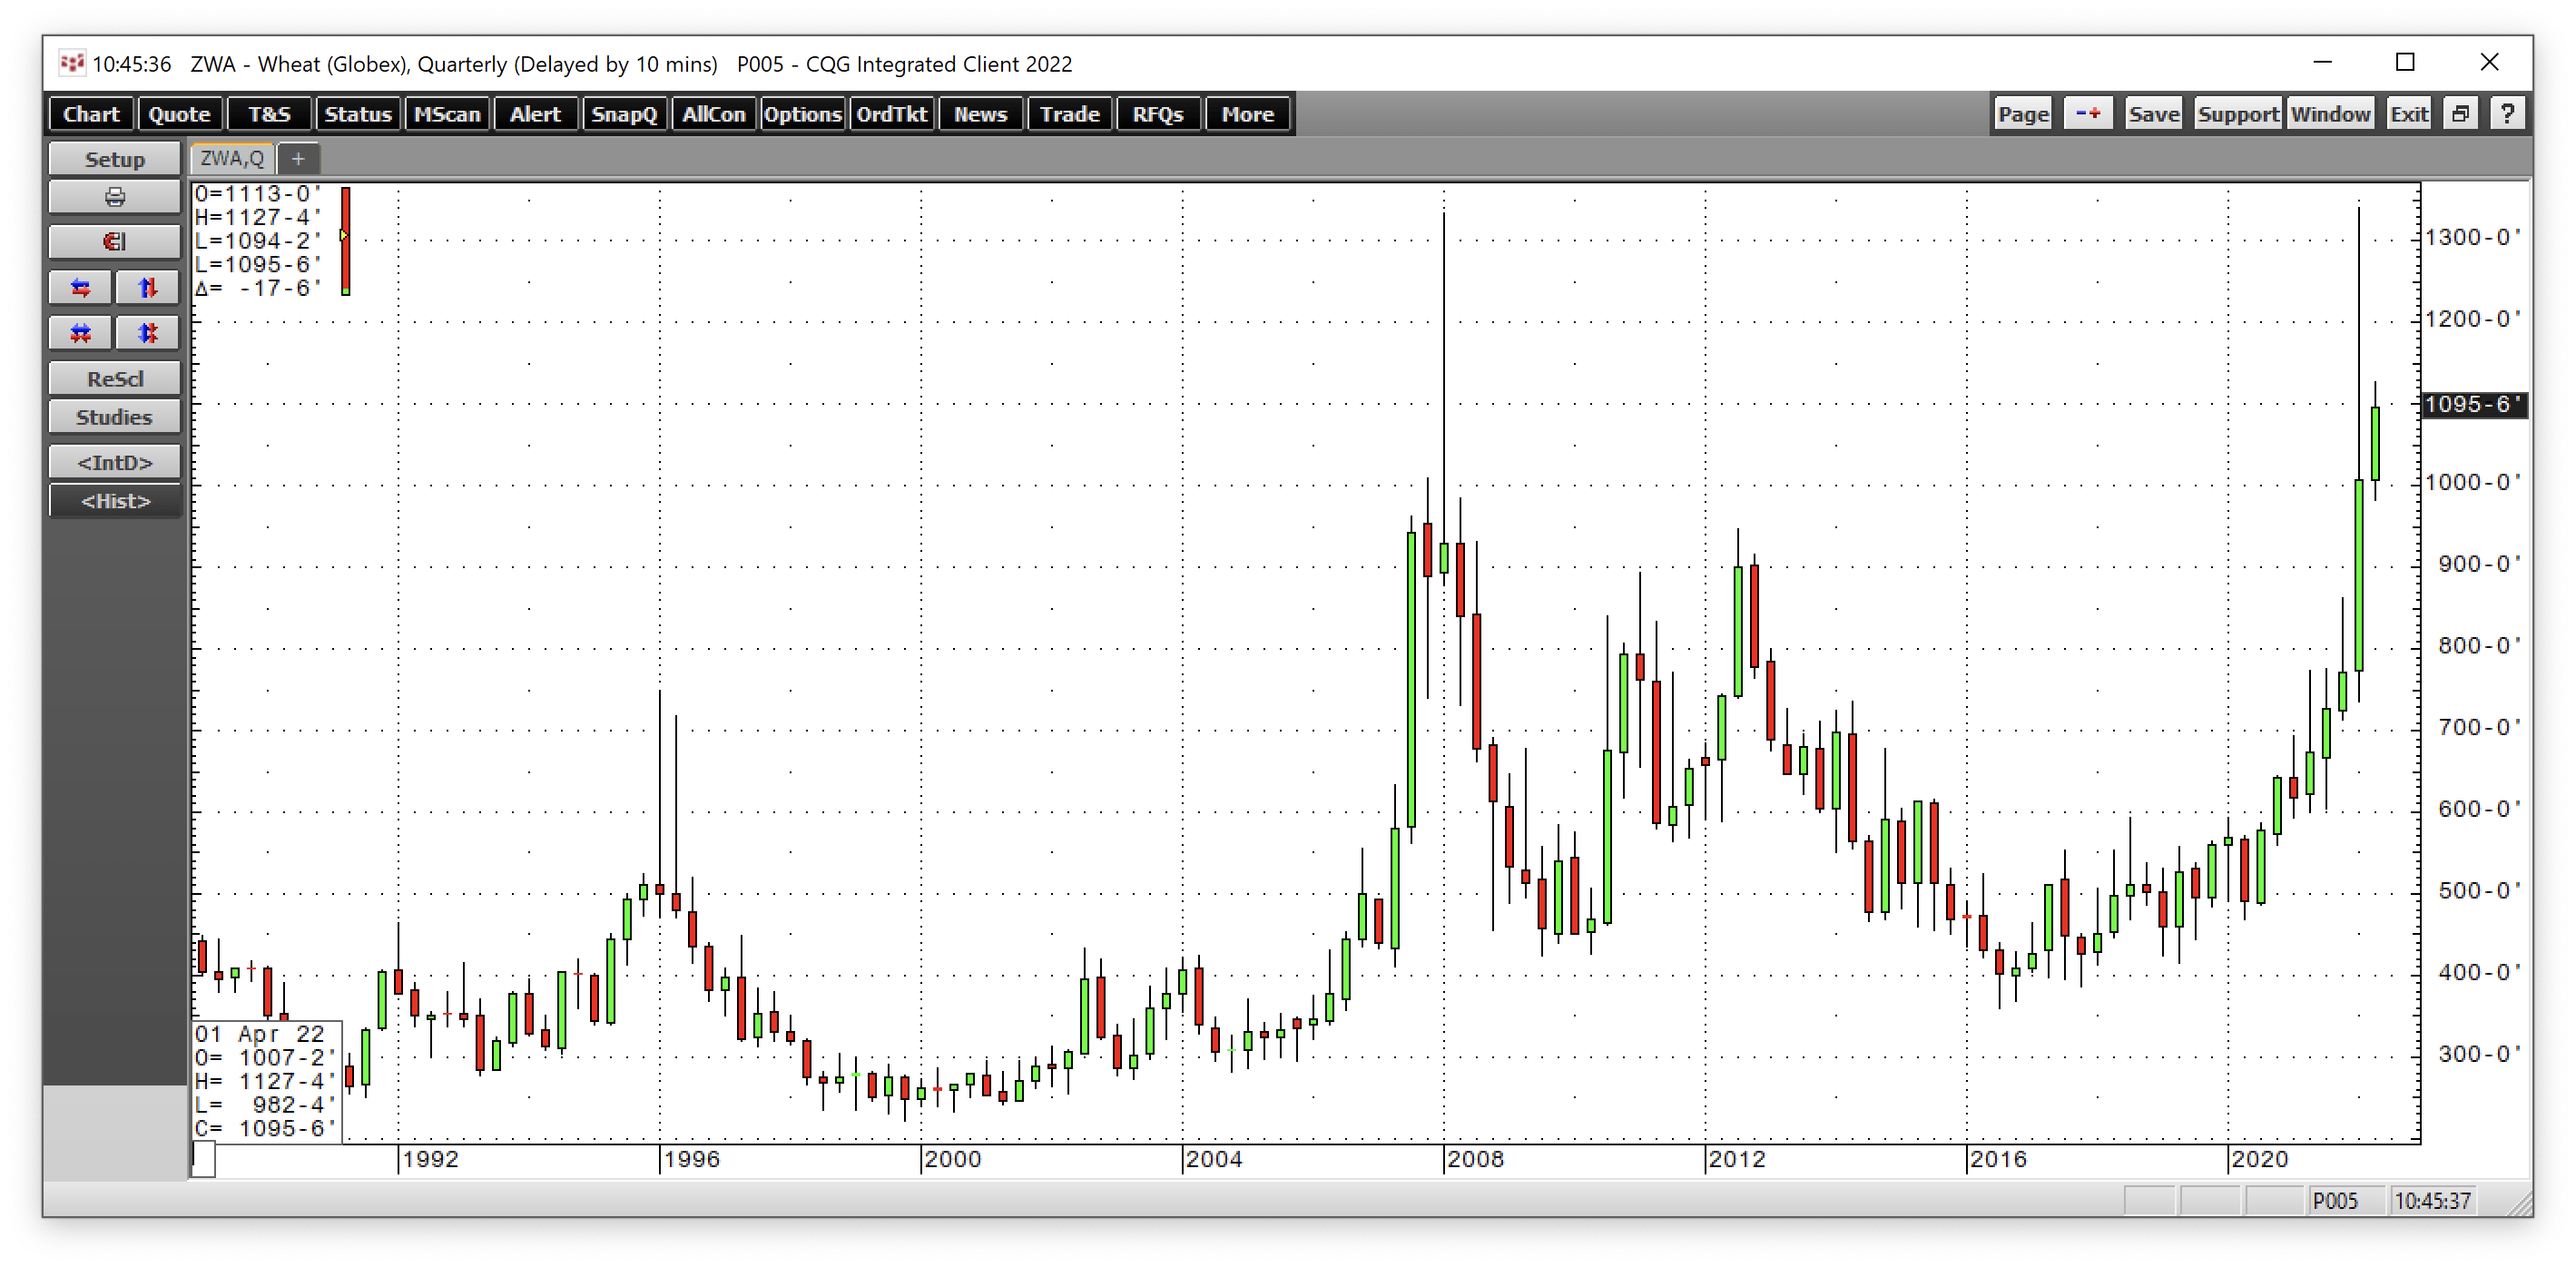
The chart shows the nearby CBOT wheat futures price rose to $13.40 per bushel in March, eclipsing the 2008 all-time high at $13.3450.
Many US bread manufacturers price their requirements using the KCBT wheat futures contract. The long-term norm for the price relationship between KCBT hard red and CBOT soft red winter wheat is a 20-30 cents premium for the KCBT wheat. Over the past years, as consumers purchased requirements on a hand-to-mouth basis, forgoing hedging, the CBOT wheat futures moved to a consistent premium to the KCBT wheat.
CBOT-KCBT Wheat Spread (Barchart)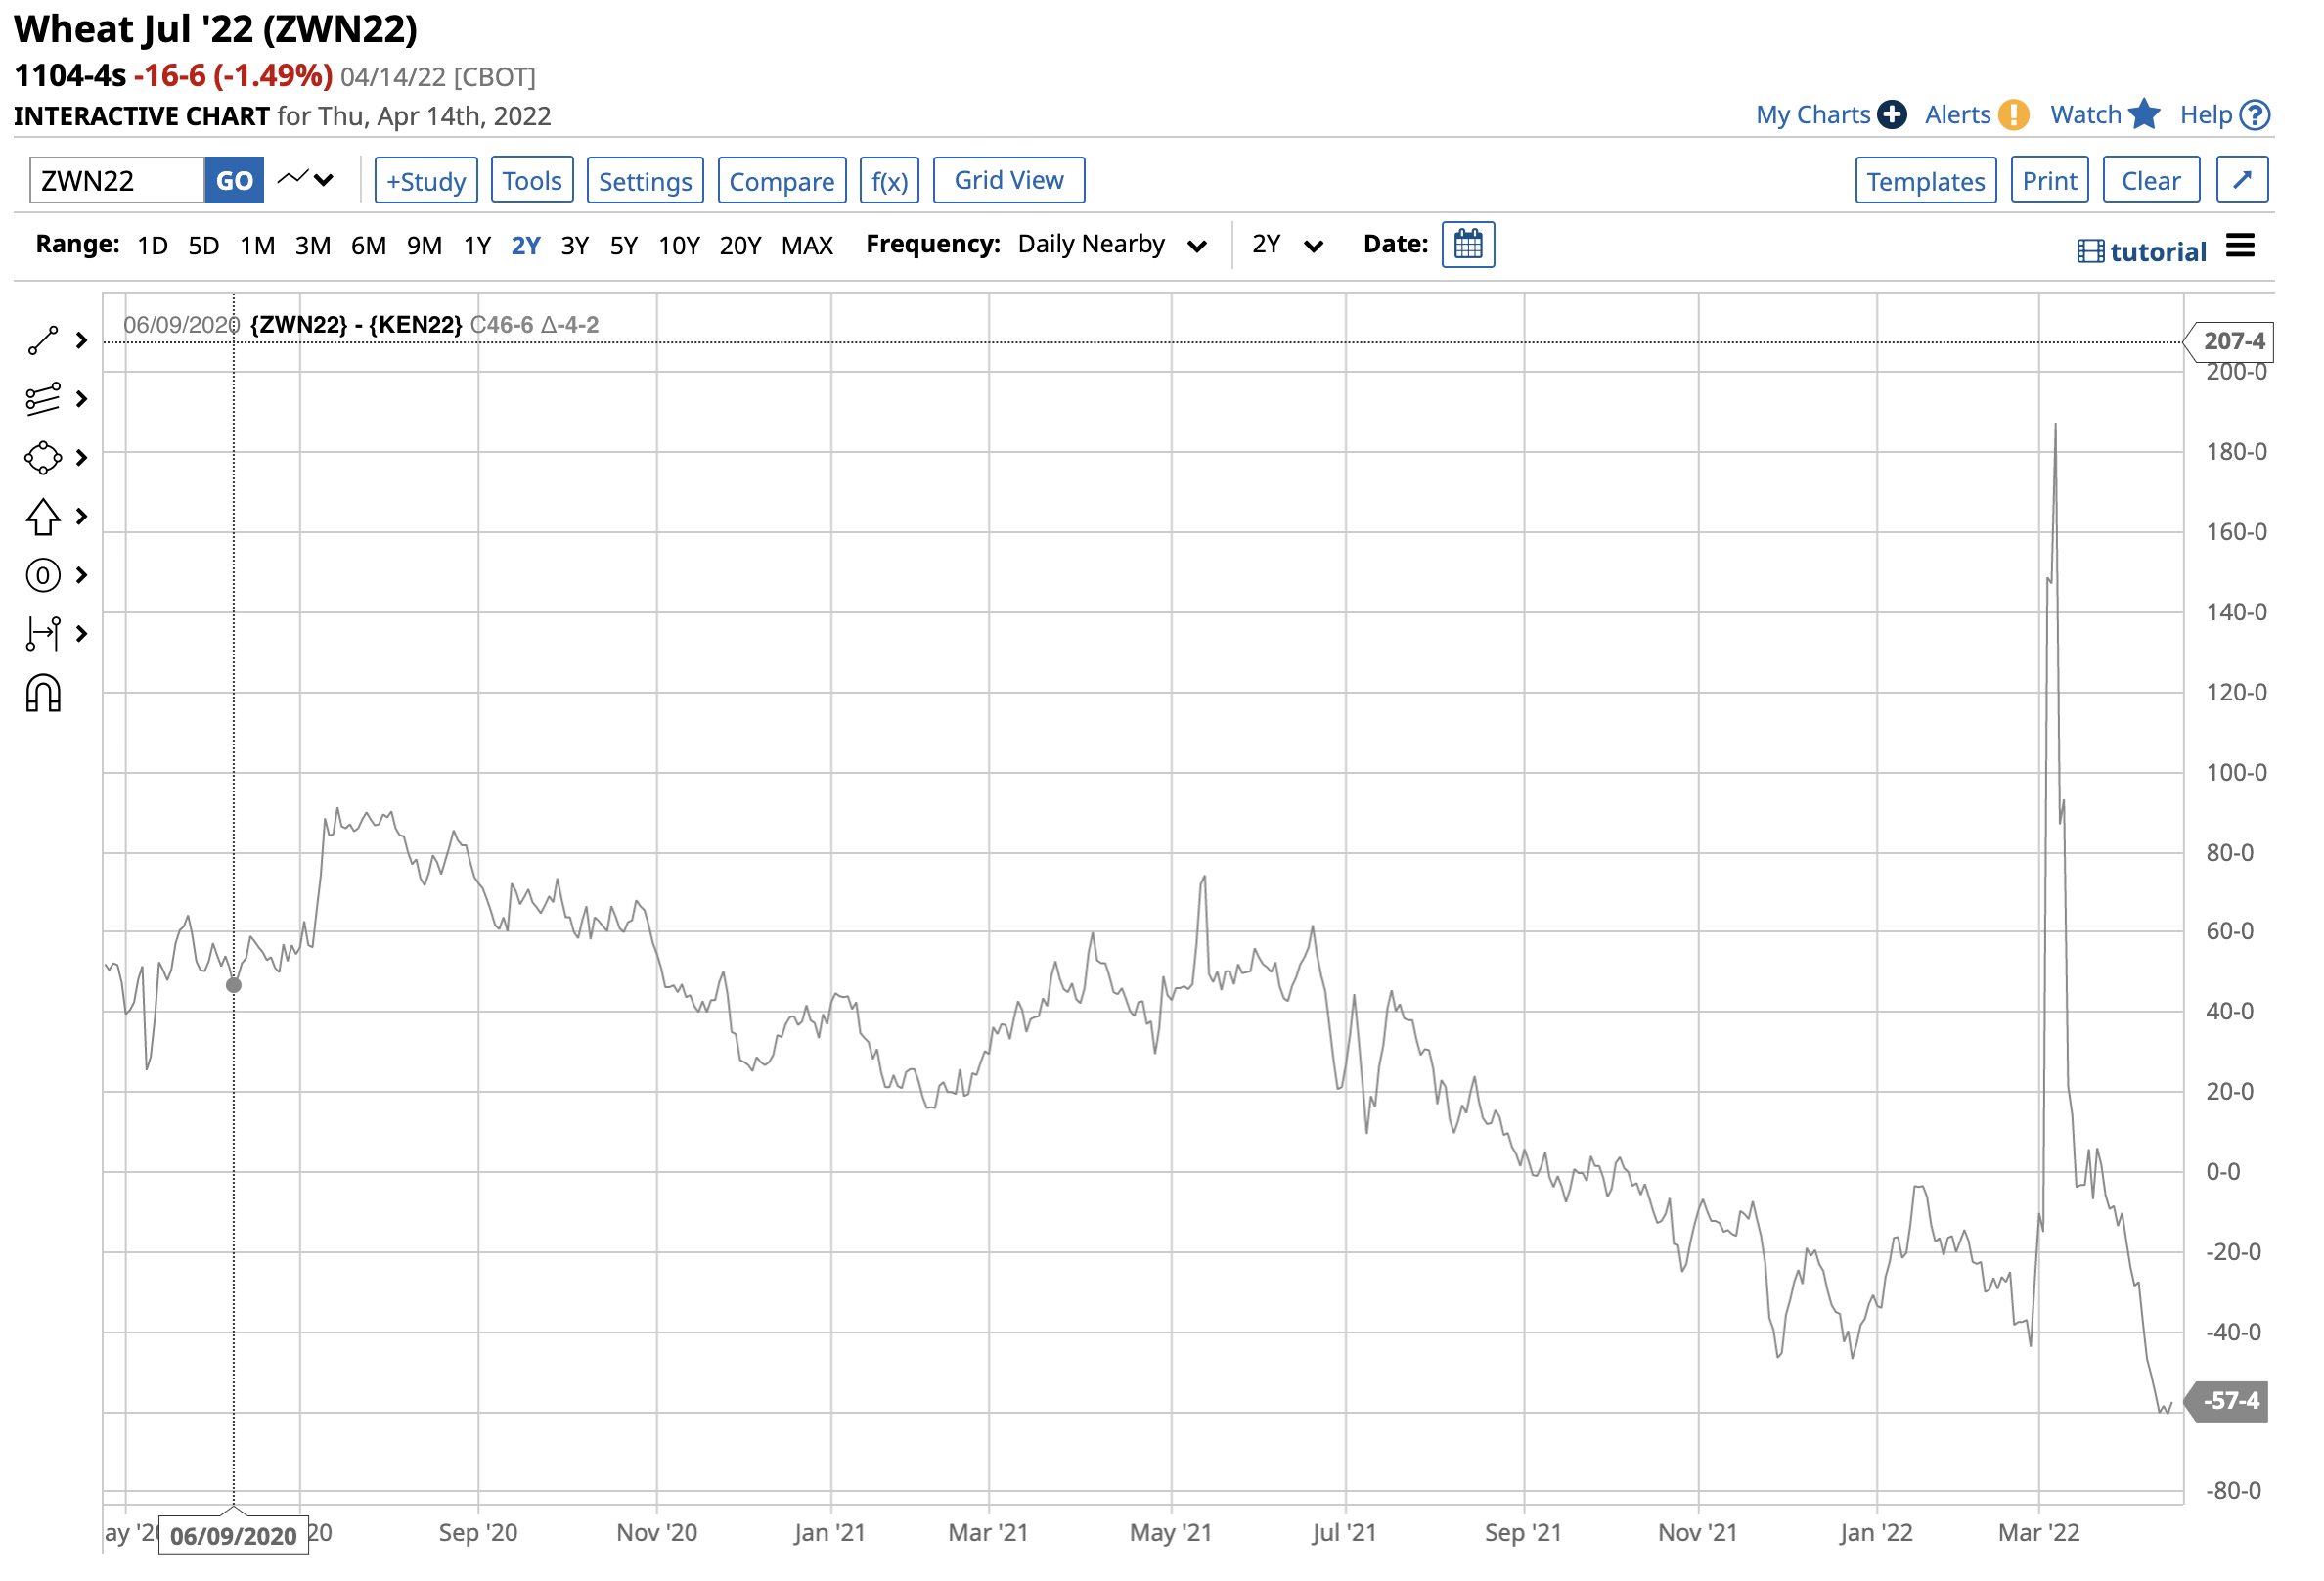
The chart of CBOT July futures minus KCBT July futures shows the hard red winter wheat moved to a 57.5 cents premium to CBOT wheat as of April 14. The move comes as consumers have increased their hedging activity because of concerns over rising wheat prices.
Wheat is a critical source of nutrition, and the highest prices in history in March and potential shortages will increase inflation in the West and cause famine in parts of the world. Nearby CBOT wheat futures were around the $11 per bushel level on April 14.
Corn And Beans Are Near All-Time Peaks
Corn and soybeans provide nutrition, but they are also energy commodities as biofuel inputs. Corn is the primary ingredient in US ethanol production, while soybean oil is required for biodiesel.
Quarterly CBOT Corn Futures Chart (CQG)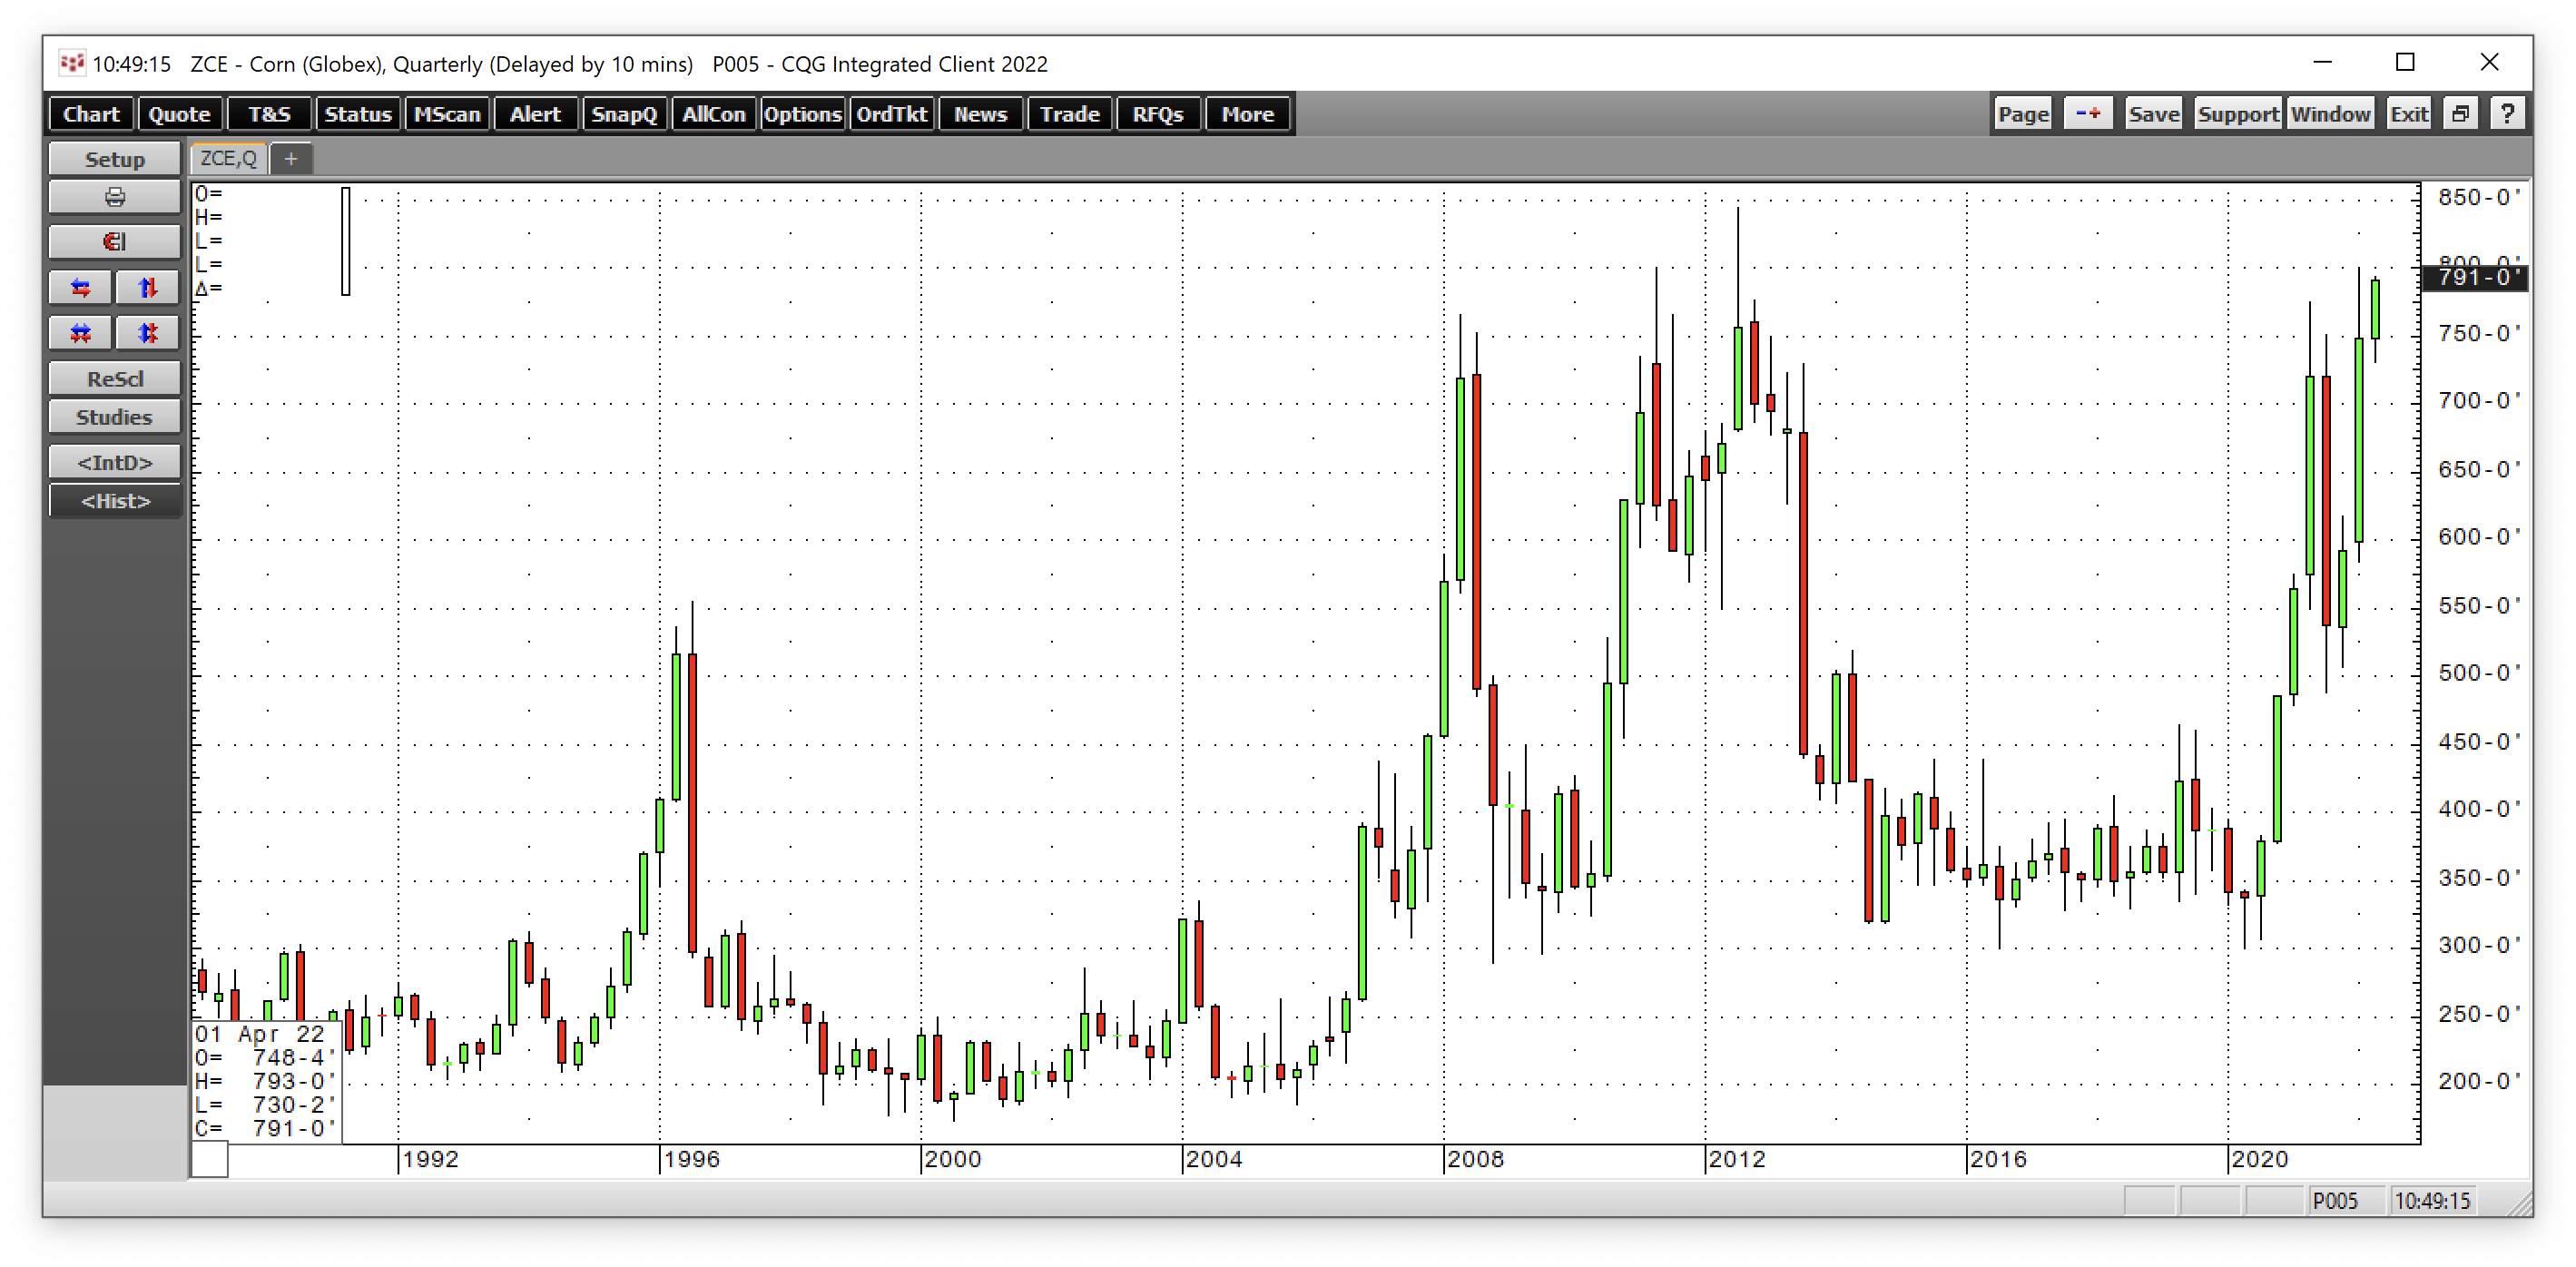
At $7.90 per bushel at the end of last week, nearby corn futures are not far below the 2012 all-time high of $8.4375 per bushel. Rising ethanol demand with oil and gas at multi-year highs only increases corn demand in 2022.
Quarterly Chart of CBOT Soybean Futures (CQG)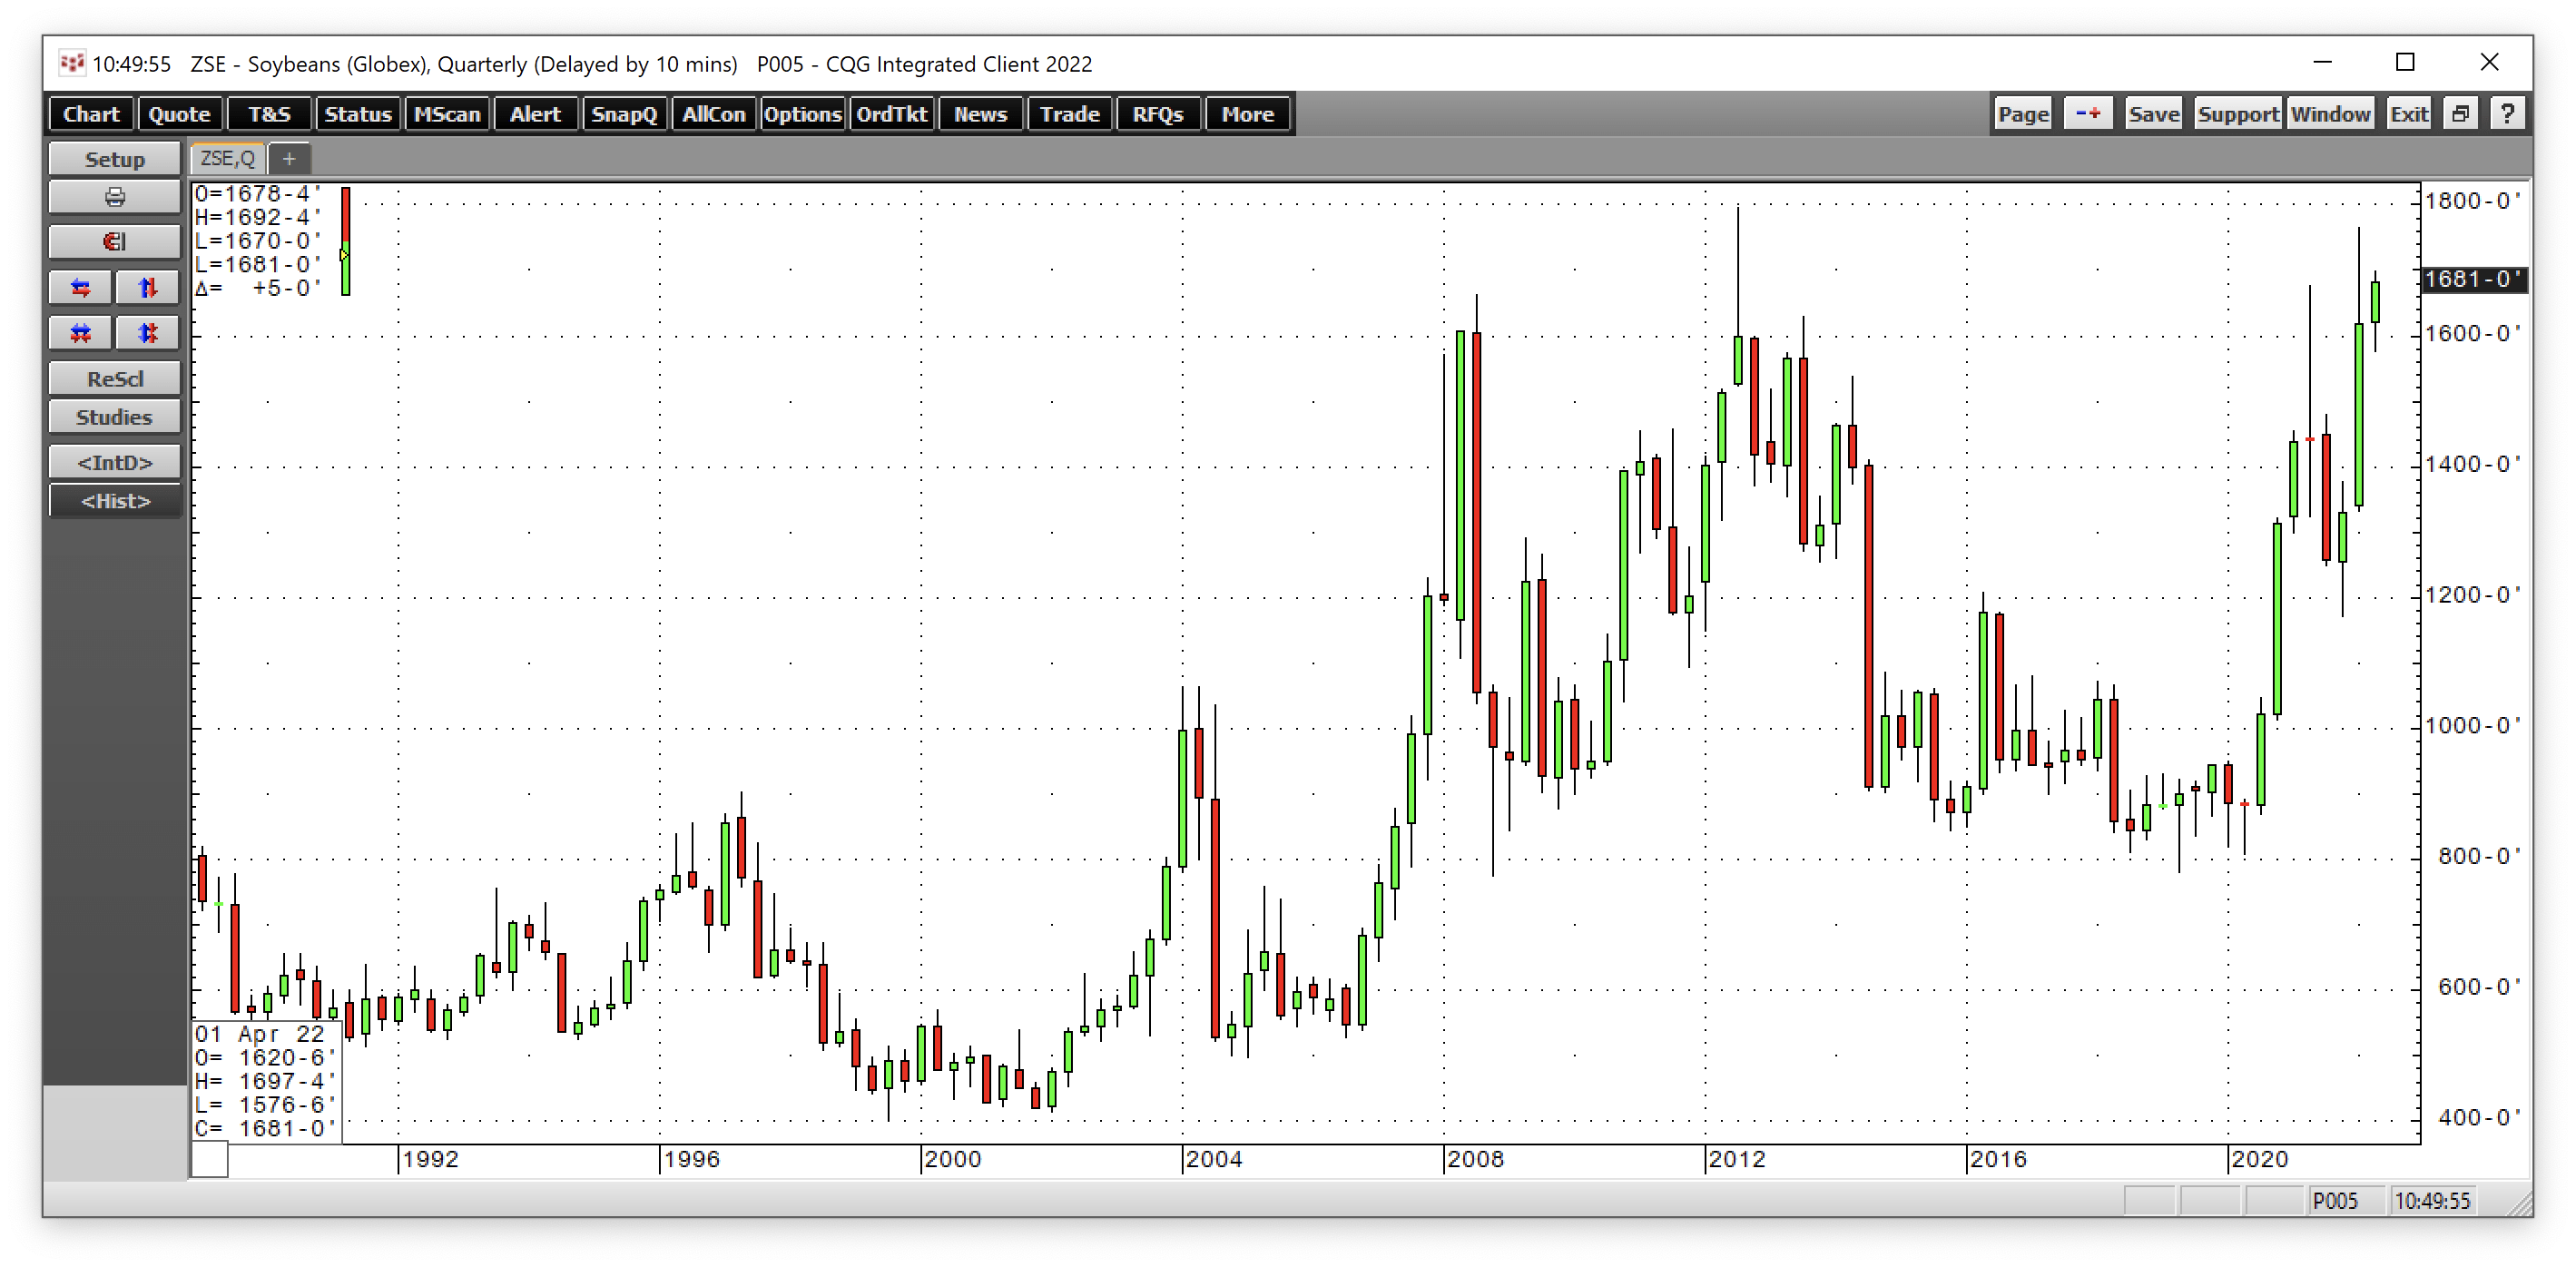
Nearby soybean futures traded to a high of $17.65 per bushel in Q1, only 29.75 cents below the 2012 all-time high of $17.9475. At $16.80 per bushel on April 14, the beans remain in a bull market.
Processors crush soybeans into meal and oil. The crush spread reflects the demand for the products and provides clues about fundamental supply and demand dynamics.
Quarterly Soybean Crush Spread (CQG)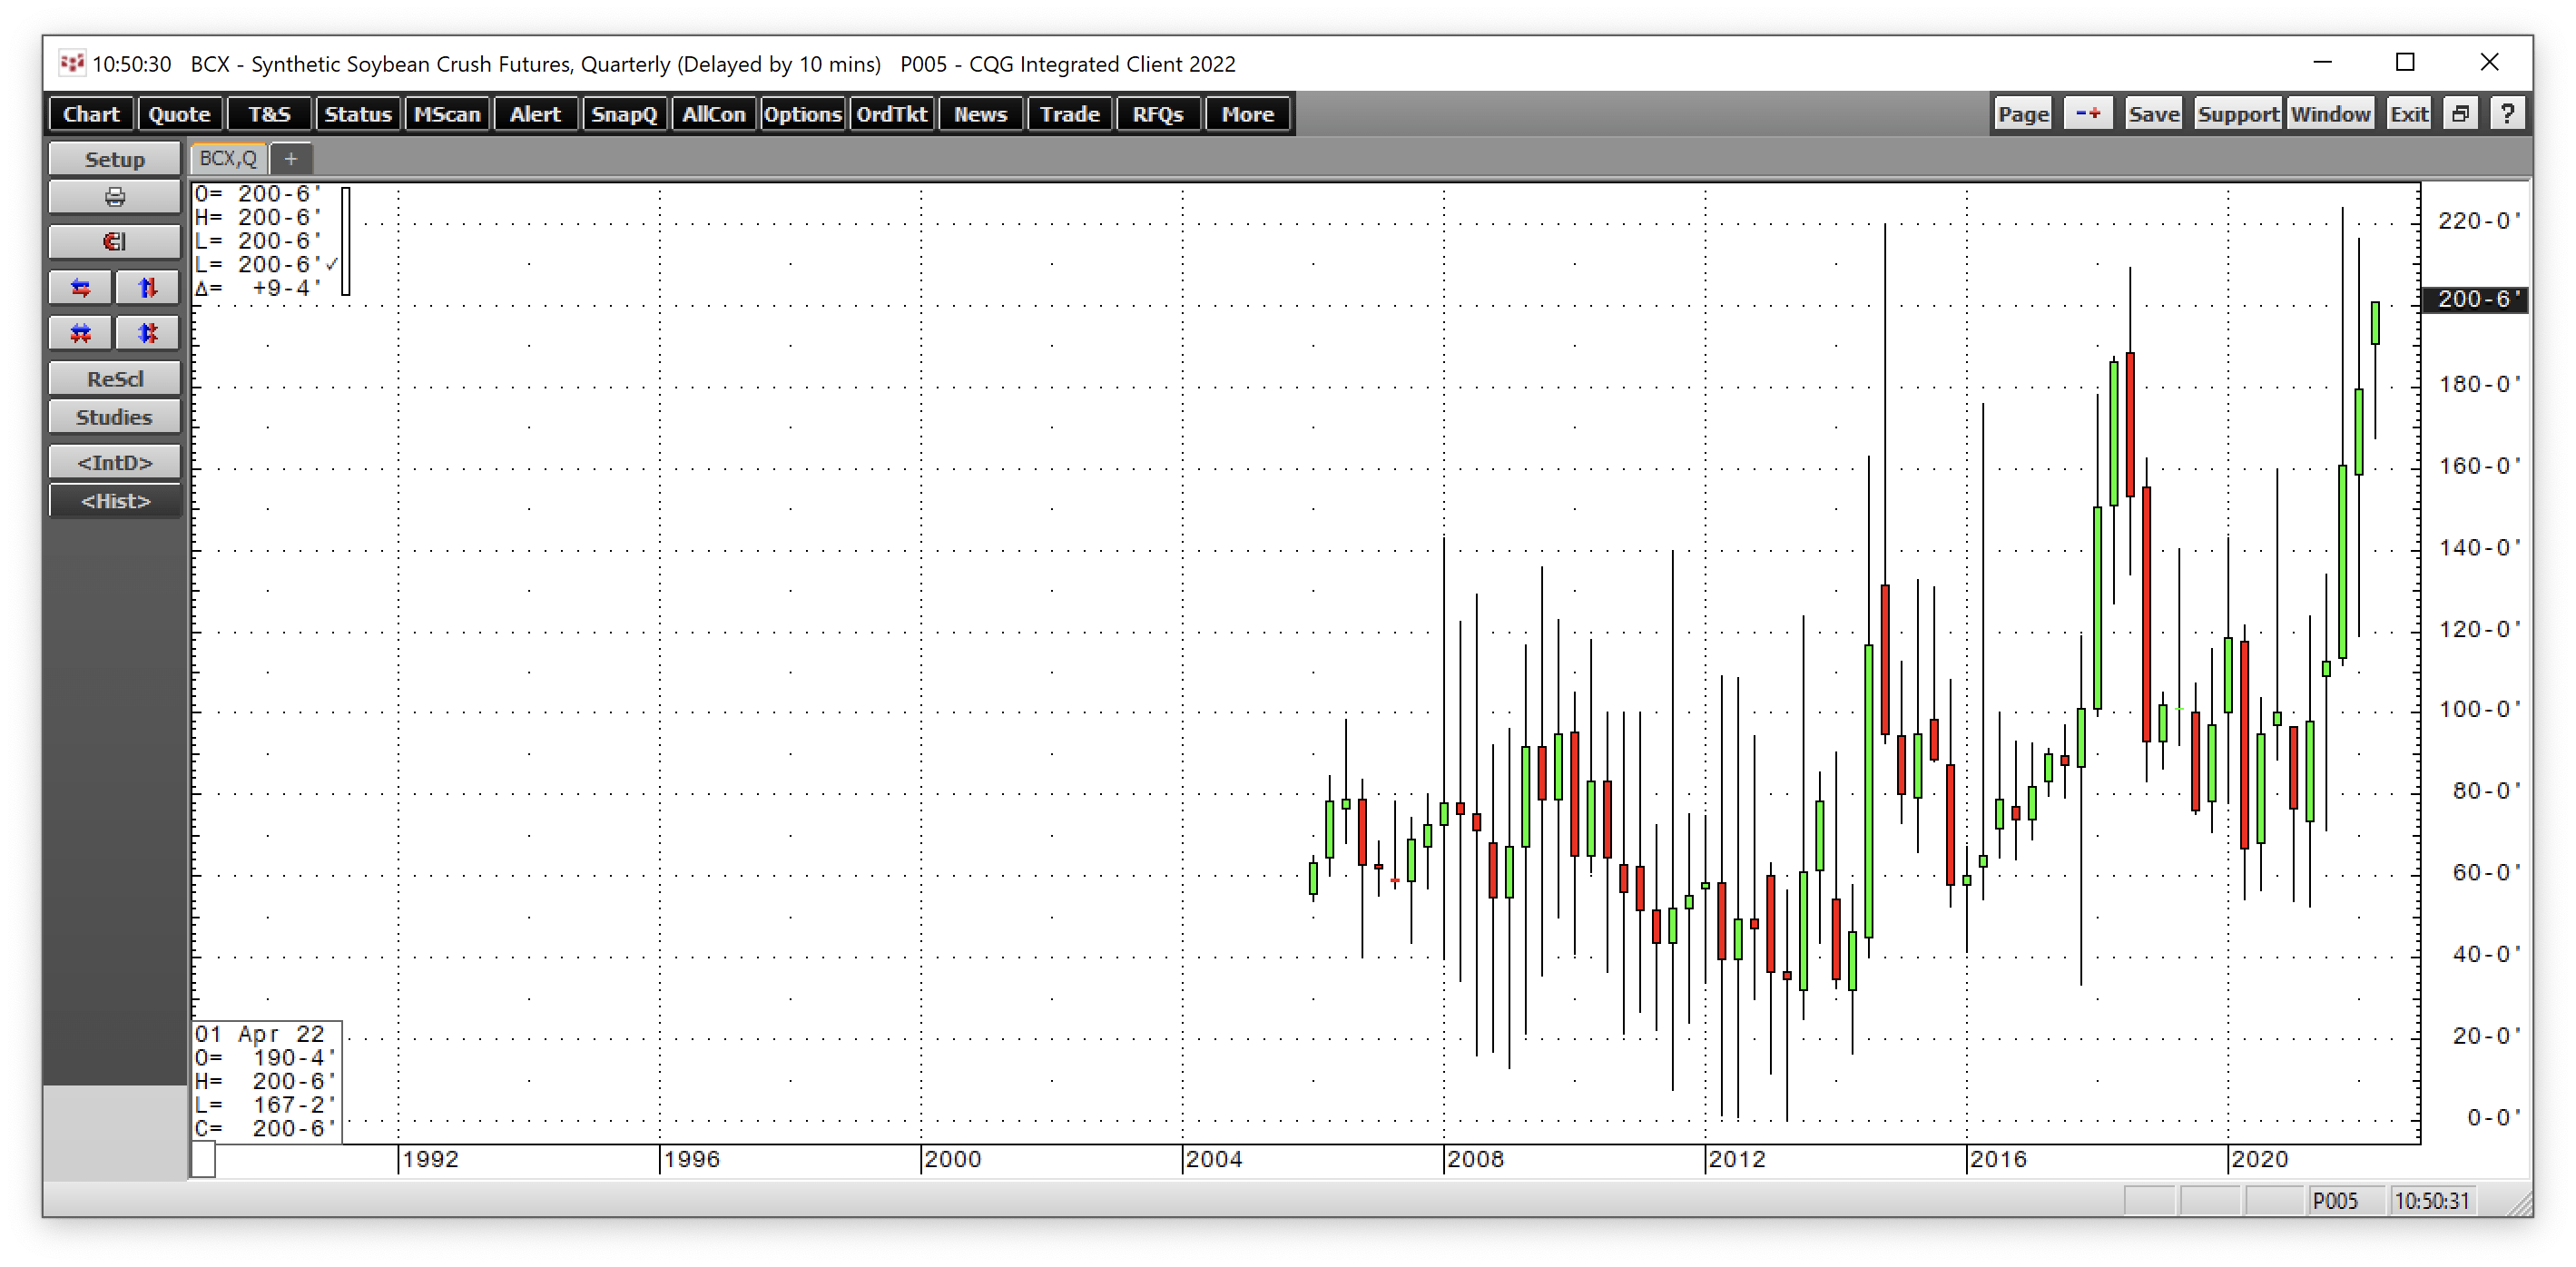
The chart of the May crush spread shows at $2 per bushel; it is close to an all-time high. Since April 2021, soybean products have outperformed the raw oilseeds, signifying the demand for products that translates to support for bean futures.
The Four Reasons To Expect Increasing Agricultural Prices Over The Coming Months And Years
Wheat, corn, and beans are heading into the 2022 growing season at the highest prices in years, if not history. Four factors should continue to keep the grain and oilseed bull charging higher over the coming weeks and months:
- South American crops were below bumper levels, weighing on global supplies. Supply chain bottlenecks continue to plague the grain markets.
- Inflation continues to push input prices higher. March CPI rose 8.5%, and PPI was 11.2% higher on a year-on-year basis. Energy prices and labor and financing costs have soared, putting upward pressure on prices.
- Fertilizer prices have exploded, and availability is problematic as Russia “temporarily” banned exports to “unfriendly” countries, including the US and Europe.
- Ukraine and Russia are Europe’s breadbasket. Fertile soil has become mine and battlefields. Moreover, the Black Sea ports are a war zone, which will impede exports. Russia and Ukraine export one-third of the world’s annual wheat supplies and are leading corn, barley, and other agricultural product exporters.
Each year is always a new adventure in the grain and oilseeds markets, with Mother Nature and her weather the primary determinate of the path of least resistance of prices. In 2022, Mother Nature is taking a backseat to the geopolitical turmoil. Meanwhile, as the global population increases by approximately twenty million each quarter, the world will require more agricultural products in 2022 than in 2021. Rising demand and the potential for supply shortfalls create a potent bullish cocktail for the commodities that feed the world.
The DBA Is A Highly Liquid ETF Product
The most direct route for a risk position for the top grain and oilseed markets is via the CME’s CBOT division futures and futures options contracts on corn, wheat, and soybeans. The Teucrium CORN, WEAT, and SOYB ETFs do an excellent job tracking the individual futures markets.
Market participants looking for a portfolio approach to agricultural commodities should consider the Invesco DB Agricultural ETF product (DBA). DBA’s top holdings include:
Top Ten Holdings of the DBA ETF Product (Barchart)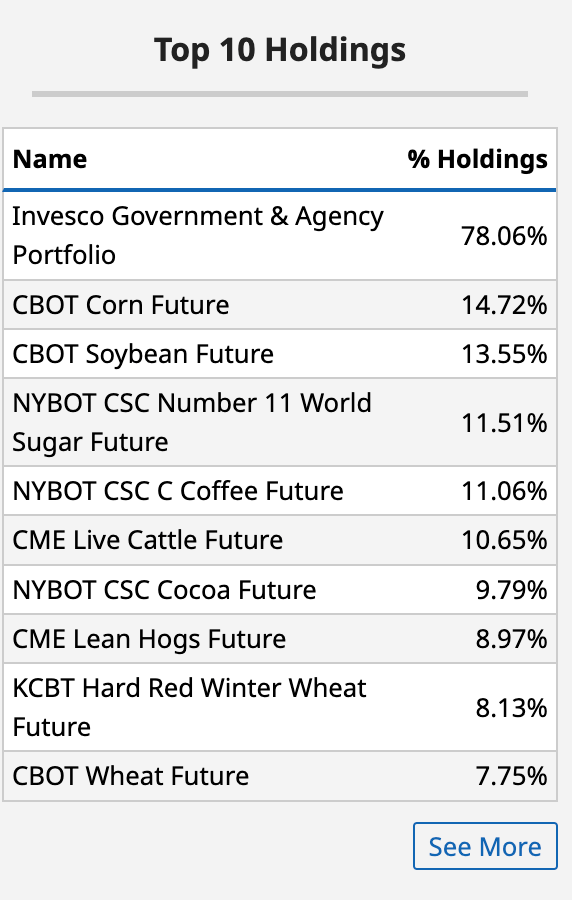
As the chart shows, DBA has a 44.15% exposure to corn, soybeans, CBOT, and KCBT wheat futures, with long positions in other critical agricultural products.
At $22.57 per share, DBA had $2.154 billion in assets under management and trades an average of over 3.36 million shares each day. DBA charges a 0.93% management fee.
Chart of the Price Action in the DBA ETF product (Barchart)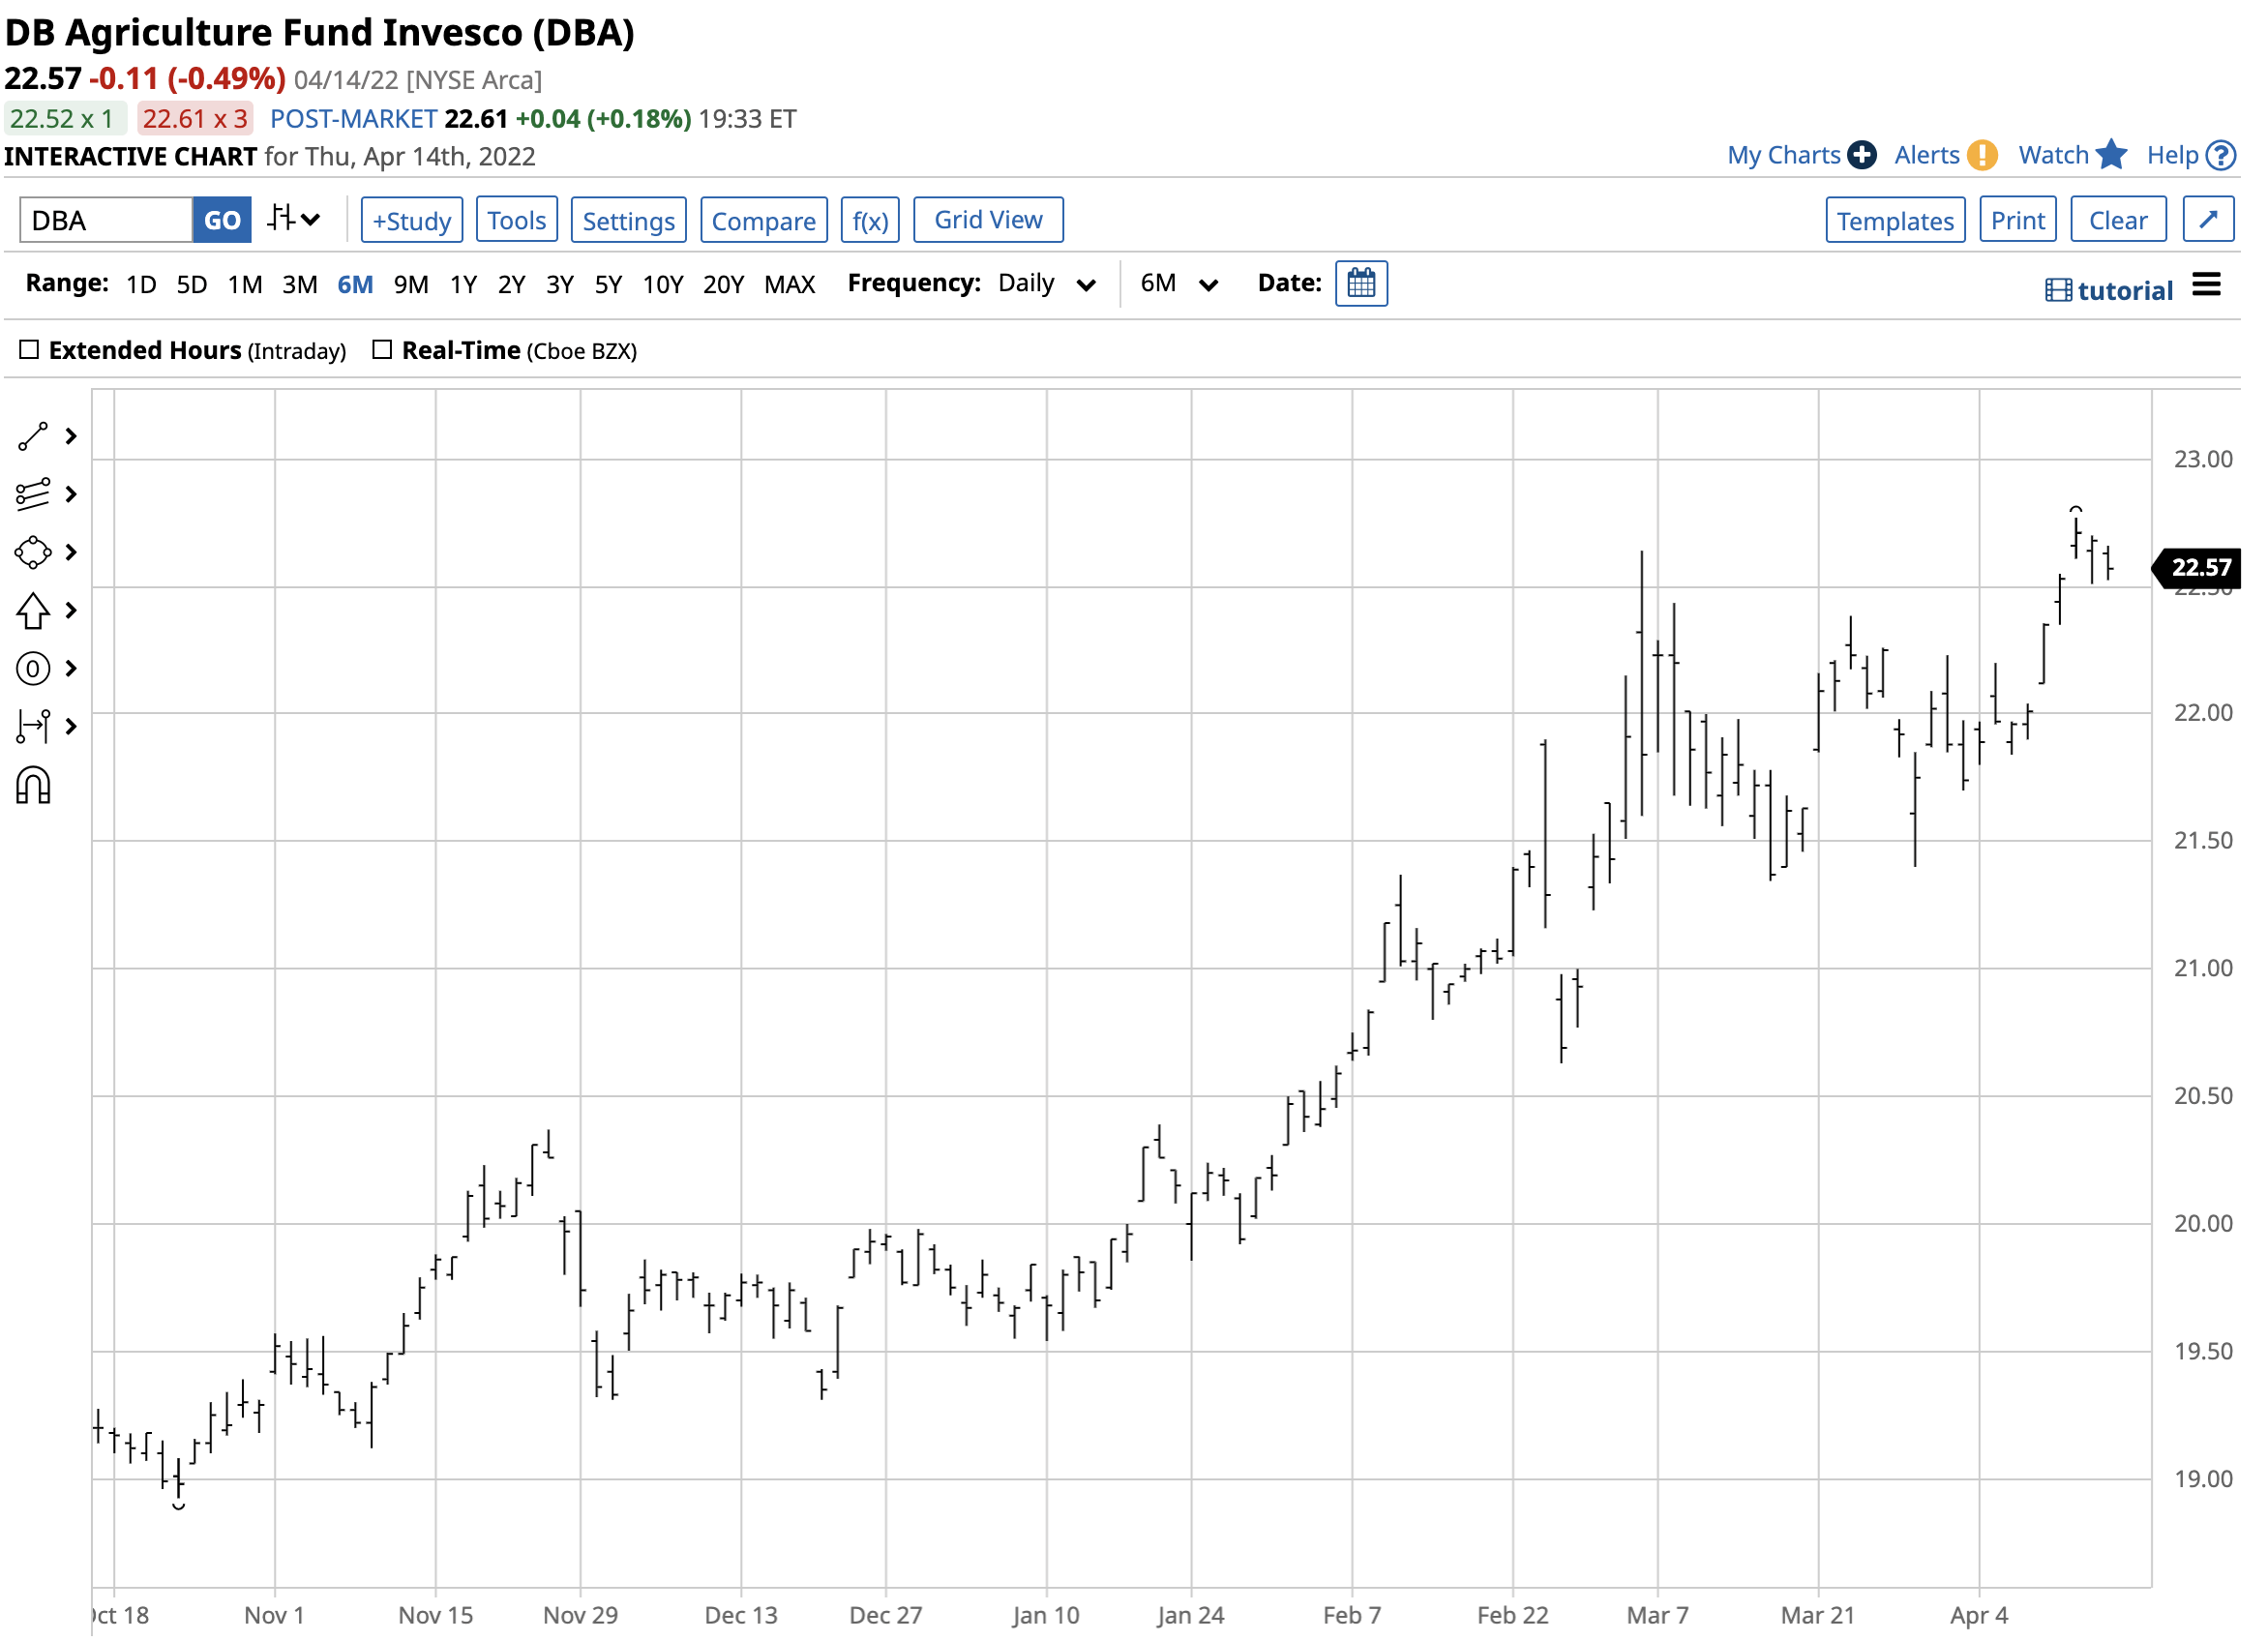
The chart highlights the rise in the DBA ETF from $19.75 at the end of 2021 to $22.57 per share on April 14. The 14.3% gain in 2022 may be the beginning for the ETF as beans could head out of the teens on the upside, wheat could continue to make new record highs, and corn could head for $10 per bushel or higher in the current environment.
The April WASDE report was a sideshow as the main event for agricultural commodities is transpiring in Ukraine. The situation looks like it will worsen over the coming months, corresponding with the growing season for the crops that feed the world.
Be the first to comment