

da-kuk/E+ via Getty Images
It’s been 25 months since I put out my bullish article on Essential Utilities, Inc. (NYSE:WTRG), and in that time the shares have returned about 29% against a gain of about 73% for the S&P 500. Although the stock performance hasn’t been terrible, I don’t like underperforming the S&P 500, so it’s time to review this name. I’ll decide whether or not to buy more, sell the shares I’ve got or hang on by looking at the most recent financial history here, and by looking at the stock as a thing distinct from the underlying business.
Welcome to the “thesis statement” portion of the article, dear readers. It’s at this point when I write out for you the “gist” of my thinking. I do this to both save you time, and give you the opportunity to escape from my articles before being exposed to all of the “Doyle mojo.” You’re welcome. I’m of the view that investing is a relativistic game. I can buy X or I can buy Y. The problem with Essential Utilities, in my view, is that there are better alternatives out there, and so I’ll be selling my shares. The company had a great year in 2021, but the valuation is no longer unambiguously attractive. I don’t expect a massive drop in price, but I don’t see much hope of a huge gain either. Finally, I should point out that the puts I sold earlier added about 5.5% to my returns here. This draws our attention yet again to the fact that short puts have the potential to add significant alpha, while reducing risk. The problem in this case is that the premia on offer for reasonable strike prices are too low to make selling puts worthwhile. For instance, the December Essential Utilities puts with a strike of $35 are currently bid at $0. Thus, in my view, it wouldn’t be worth selling puts in this case.
Essential Utilities – Financial Snapshot
I think the most recent year has been quite good for this company. In particular, both revenue and net income were up dramatically in 2021 relative to the same period in 2020. The top line was about 28.5% higher, and net income is about 51.5% higher than it was in 2020. Additionally, cash from operations spiked fully 27% from the year ago period, suggesting that this is now a much more powerful cash flow generator than it was at any point in its history.
The more historically minded among you may remember that 2020 was a uniquely bad year. You may recall that that was the year the world was caught in the grip of a global pandemic that had seriously deleterious effects on economies. For that reason, you would be forgiven for worrying that any comparison to 2020 will make 2021’s results look artificially good. If that’s your worry, dear readers, fret no further. The company’s performance in 2021 was even better than it was in 2019. Revenue was 111% higher, and net income was up by a whopping 92.2%. In sum, the financial performance in 2021 has been quite good in my estimation.
Dividend Sustainability
I know what you’re thinking, dear readers. “We get that you have this near miraculous ability to calculate a percentage change, and we readers are all very, very impressed by that, but what about the dividend?” Well, first, many thanks, dear readers. I know it is impressive to be able to calculate a percentage change, but it’s always nice to be reminded of it. Second, you people want to read about the dividend, so I’m going to write about the dividend.
I think the dividend is important for two reasons. First, it’s supportive of price, meaning that the stock of a company that pays a regular, sustainable dividend has a price floor below which it won’t go. Second, investors like predictability, and there’s little better than a predictable injection of cash from a dividend into your account.
As my regulars know, when it comes to dividends, I compare the size and timing of future cash obligations with the size and timing of current and likely future sources of cash. I’ll start by looking at the obligations. I’ve plucked the following table of contractual obligations from page 58 of the latest 10-K for your enjoyment and edification. We see from this that the company will spend ~$560.5 million on various obligations this year, and an average of ~$566.7 million over the subsequent two years.
Essential Utilities Contractual Obligations (Essential Utilities Latest 10-K)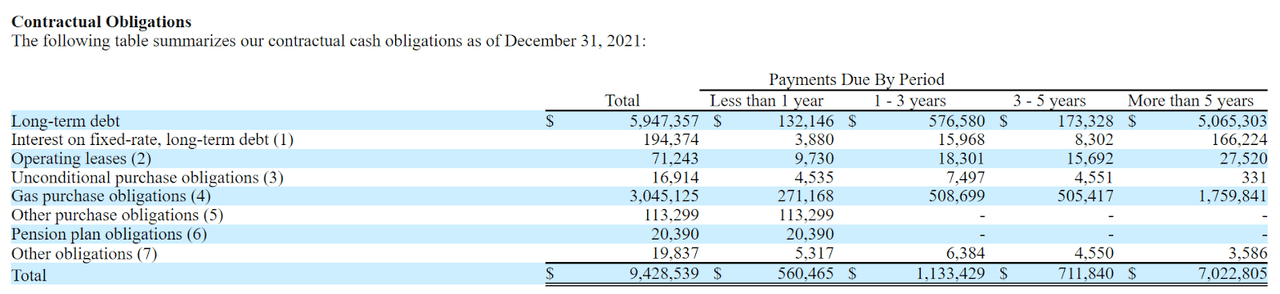
Against these obligations, the company currently has about $10.6 million in cash. Additionally, over the past three years, they’ve generated an average of about $497 million from cash from operations. At the same time, they’ve spent an average of $1.998 billion on CFI activities. If we strip out the property plant and equipment purchases in 2021, and acquisitions in 2020, the CFI average falls to about $491 million.
All of this suggests to me that the dividend isn’t particularly well covered here, especially compared to many other companies I’ve covered recently. In order for me to consider buying more of these shares, the valuation will have to be quite attractive.
Essential Utilities Financials (Essential Utilities investor relations)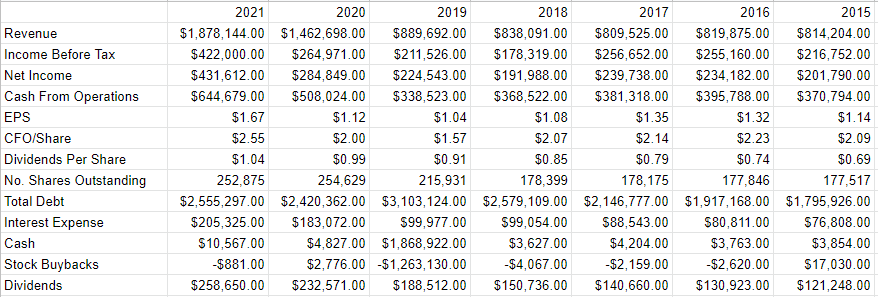
The Stock
Some of you who follow me for some reason know that this is the point in the article when I become even more downbeat than usual. It’s here where I start writing about risk-adjusted returns, and how even the stock of a great company can be a terrible investment at the wrong price. A company can make a great deal of money, but the investment can still be a terrible one if the shares are too richly priced. This is because all businesses are essentially just organisations that organise a bunch of inputs, adds value to those inputs, and then sells products or services (hopefully) for a profit. The stock, on the other hand, is a proxy whose changing prices reflect more about the mood of the crowd than anything to do with the business. In my view, stock price changes are much more about the expectations about a company’s future. This is why I look at stocks as things apart from the underlying business.
Now if you expect that I’m the type of person to make a point and then move on, prepare to have your expectations subverted as I belabour this disconnect between the company and the stock. I’ll demonstrate the importance of looking at the stock as a thing distinct from the business by using the stock of Essential Utilities itself as an example. The company released annual results on March 1st. If you bought this stock that day, you’re up about 7% since then. If you exactly one month, you’re down about 5% since. Obviously, not much changed at the firm over this short span of time to warrant a near 12% variance in returns. The differences in return came down entirely to the price paid. The investors who bought virtually identical shares more cheaply did better than those who bought the shares at a higher price. This is why I try to avoid overpaying for stocks.
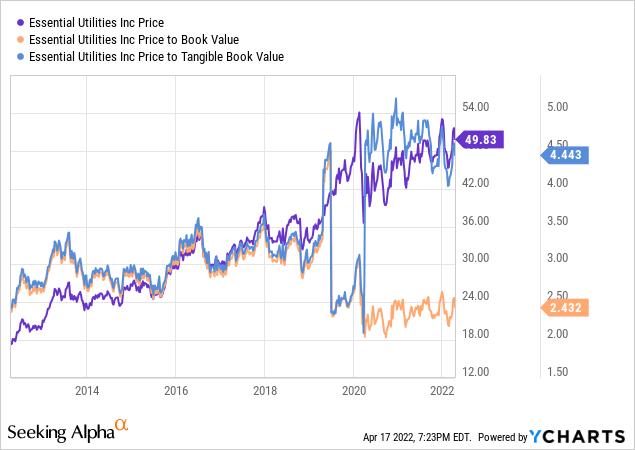
My regulars know that I measure the cheapness (or not) of a stock in a few ways, ranging from the simple to the more complex. On the simple side, I look at the ratio of price to some measure of economic value like sales, earnings, free cash flow, and the like. Ideally, I want to see a stock trading at a discount to both its own history and the overall market. In my previous missive, I became excited by the fact that both price to book and price to tangible book dropped to multi year lows. In particular, these both dropped to ~2.6 times. Price to tangible book is now much more expensive per the following:
In addition to simple ratios, I want to try to understand what the market is currently “assuming” about the future of this company. In order to do this, I turn to the work of Professor Stephen Penman and his book “Accounting for Value.” In this book, Penman walks investors through how they can apply the magic of high school algebra to a standard finance formula in order to work out what the market is “thinking” about a given company’s future growth. This involves isolating the “g” (growth) variable in a fairly standard finance formula. Applying this approach to Essential Utilities at the moment suggests the market is assuming that this company will grow at a rate of ~10% in perpetuity, which I consider to be very optimistic. Given all of the above, I’ll be selling my shares.
Conclusion
I’m of the view that investing is a relativistic game. We can choose stock X or stock Y. Pointing this out sounds embarrassingly obvious, but when we review a given company, we can “go deep” and thus forget that there are countless alternatives available to us. It’s in that frame of mind that I approached Essential Utilities. It hasn’t been as much of a stinker as some of my worst performers, but it hasn’t been great either. There are safer, higher yielding dividends available to me, so why continue to lock up capital on this name? While I don’t expect a crash anytime soon, I think there are greener pastures available. In my view, investors who own Essential Utilities would be wise to consider what I consider to be superior alternatives.
Be the first to comment