

RobsonPL
The Crédit Agricole Group is not only the largest retail bank in France, but also the largest retail bank in the European Union. The Group consists of Crédit Agricole S.A., whose stock trades in the U.S. under the tickers (OTCPK:CRARY) and (OTCPK:CRARF), as well as a network of 39 regional Crédit Agricole banks, and a larger network of over 2,400 local mutual banks. More than 11 million mutual shareholders own shares in the mutual banks, which themselves own shares in the regional banks, which in turn own over half the shares of Crédit Agricole S.A. This structure can be seen in the below image from the Crédit Agricole 2021-22 Integrated Report.
Crédit Agricole 2021-22 Integrated Report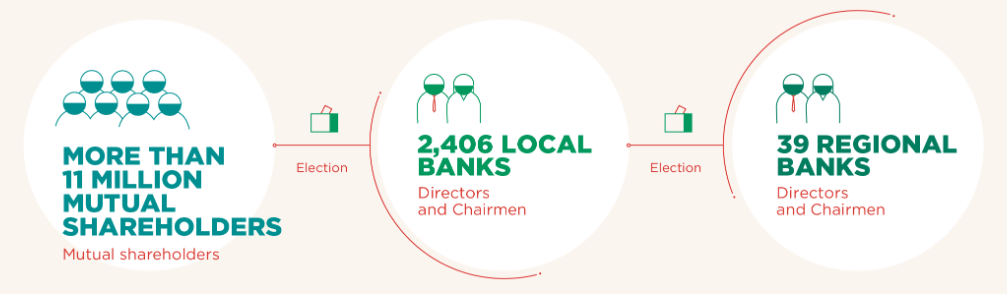
Of the 39 Crédit Agricole regional banks, 12 are publicly traded on European exchanges. Their shares have historically been cheap. I first encountered them in a 2016 post on the Value Investing France blog, which quoted the Graham and Doddsville value investing newsletter from Spring 2013:
These things are trading at 25%-40% of tangible book… These entities are trading at five or six times earnings. They’re paying dividends of five to seven percent.
Source: Graham & Doddsville Issue XVIII (Spring 2013) (Opens as PDF)
Much has changed since 2013, but the Crédit Agricole regional banks have stayed very cheap:
|
Crédit Agricole Regional Bank |
LTM P/B (8/12/22) |
LTM P/E (8/12/22) |
LTM Dividend Yield (8/12/22) |
|
Crédit Agricole Mutuel Brie Picardie Société coopérative |
0.22 |
4.72 |
5.5% |
|
Crédit Agricole Mutuel de Paris et d’Ile-de-France |
0.28 |
6.01 |
4.5% |
|
Crédit Agricole Mutuel Atlantique Vendée |
0.16 |
5.02 |
5.0% |
|
Crédit Agricole Mutuel Nord de France Société coopérative |
0.19 |
5.99 |
6.3% |
|
Crédit Agricole Mutuel du Languedoc Société coopérative |
0.21 |
4.64 |
5.4% |
|
Crédit Agricole Mutuel Toulouse 31 |
0.18 |
4.53 |
5.8% |
|
Crédit Agricole Mutuel de Normandie-Seine Société coopérative |
0.17 |
4.97 |
5.2% |
|
Crédit Agricole Mutuel d’Ille-et-Vilaine Société coopérative |
0.18 |
6.10 |
3.5% |
|
Crédit Agricole Mutuel de La Touraine et du Poitou Société Coopérative |
0.16 |
5.39 |
4.8% |
|
Crédit Agricole du Morbihan |
0.16 |
4.16 |
4.6% |
|
Crédit Agricole Mutuel Alpes Provence Société coopérative |
0.17 |
4.23 |
5.0% |
|
Crédit Agricole Mutuel Loire Haute-Loire – Société coopérative |
0.19 |
4.99 |
5.1% |
Source: TIKR
These regional banks’ shares are cheap for a reason. The banks have very low returns on equity (ROE) of 3 to 5 percent, meaning they earn only 3 to 5 cents a year for each dollar of their equity. That said, in today’s world of high stock valuations, consistently profitable companies trading at low single digit P/E ratios and P/B ratios less than 0.3 with dividend yields around 5% are tempting investments, even if they have low returns on equity.
One problem with investing in the Crédit Agricole regional banks, though, is deciding which ones to invest in. One solution is to buy shares in all the banks. However, each Crédit Agricole regional bank operates in a different area of France with a different GDP per capita. Thus, I was curious if areas with higher GDPs per capita might have Crédit Agricole regional banks that earn higher returns.
France is divided into regions, which are then divided into smaller departments. To examine this question, I looked at the 2016 GDP per capita for the regions where the 12 publicly traded Crédit Agricole regional banks have branches. Similarly, I looked at the 2015 GDP per capita for the departments where the 12 publicly traded Crédit Agricole regional banks have branches (since the 2016 data was not available). This data was available on Wikipedia. I would not normally use Wikipedia as a source, but the data there cited statistics from the Organization for Economic Co-operation and Development (OECD) and France’s official National Institute of Statistics and Economic Studies (INSEE), which seemed reliable.
Most of the Crédit Agricole regional banks have branches in multiple departments, and a few operate in multiple regions. To account for this, I found the average 2015 GDP per capita across all the departments where each bank has branches. I then calculated an average department GDP per capita for that bank. Similarly, I found the average 2016 GDP per capita across all the regions where each bank has branches, and then calculated an average region GDP per capita for that bank. I then compared each bank’s average department and region GDP per capita against its average ROE between 2016 and 2021.
|
Bank Name |
2016-21 Average ROE |
Average Department GDP Per Capita (2015) |
Average Region GDP Per Capita (2016) |
|
Crédit Agricole Mutuel Brie Picardie Société coopérative |
4.9% |
36,071 € |
32,363 € |
|
Crédit Agricole Mutuel de Paris et d’Ile-de-France |
4.5% |
53,700 € |
69,423 € |
|
Crédit Agricole Mutuel Atlantique Vendée |
3.7% |
36,894 € |
36,729 € |
|
Crédit Agricole Mutuel Nord de France Société coopérative |
3.4% |
35,384 € |
32,363 € |
|
Crédit Agricole Mutuel du Languedoc Société coopérative |
4.9% |
33,778 € |
34,252 € |
|
Crédit Agricole Mutuel Toulouse 31 |
4.0% |
48,366 € |
34,252 € |
|
Crédit Agricole Mutuel de Normandie-Seine Société coopérative |
3.9% |
33,142 € |
34,254 € |
|
Crédit Agricole Mutuel d’Ille-et-Vilaine Société coopérative |
3.4% |
33,142 € |
34,254 € |
|
Crédit Agricole Mutuel de La Touraine et du Poitou Société Coopérative |
3.5% |
34,614 € |
34,549 € |
|
Crédit Agricole du Morbihan |
3.8% |
31,016 € |
35,272 € |
|
Crédit Agricole Mutuel Alpes Provence Société coopérative |
3.2% |
34,541 € |
38,213 € |
|
Crédit Agricole Mutuel Loire Haute-Loire – Société coopérative |
4.8% |
30,467 € |
39,763 € |
Source: TIKR, Wikipedia
My hypothesis was that the higher a bank’s average department and region GDP per capita, the higher the bank’s average ROE would be between 2016 and 2021.
Tableau Public Dashboard created by author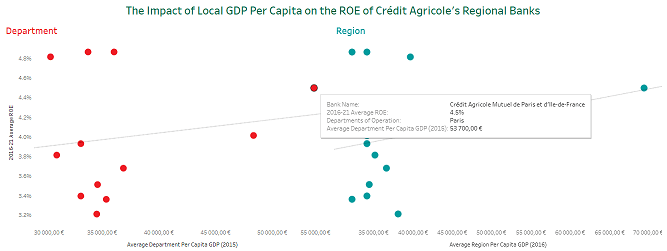
As can be seen above, this correlation did appear in the data, but only very loosely. In fact, it is entirely based on Crédit Agricole Mutuel de Paris et d’Ile-de-France. This bank is an outlier because it operates in the area around Paris, which has a much higher GDP per capita than the rest of France. If you remove it from both plots, the correlation disappears entirely:
Tableau Public dashboard created by author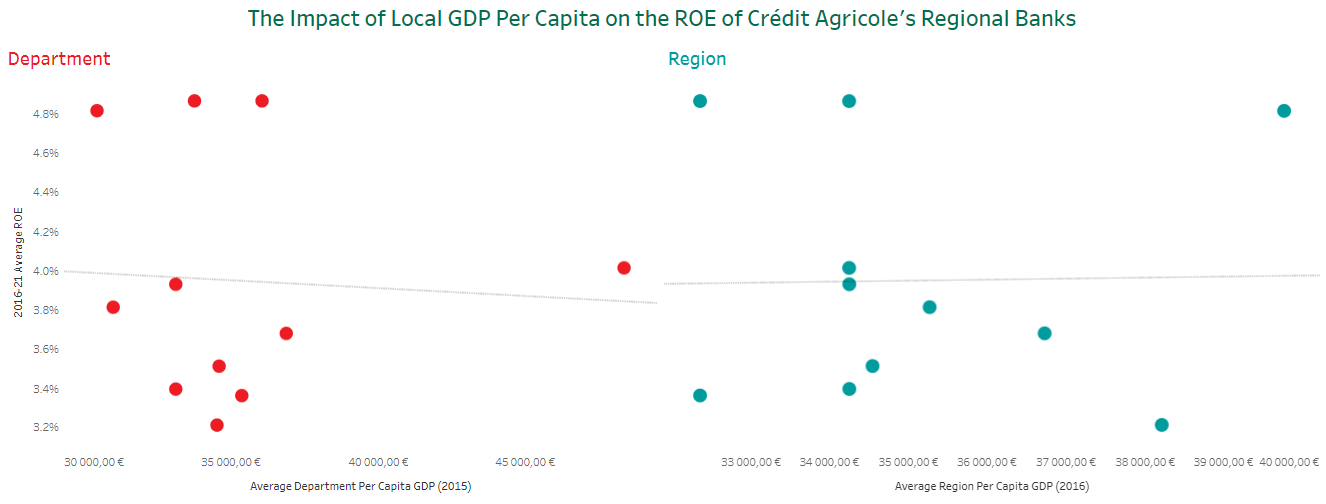
Thus, contrary to expectations, average department and region GDP per capita has essentially no impact on the return on equity of the Crédit Agricole regional banks that operate in those departments and regions.
Conclusions
This outcome offers valuable lessons for investors. First, it means that investors in the Crédit Agricole regional banks should not be too concerned about the income of the regions where the banks operate. Instead, they should mostly focus on the characteristics of the banks themselves, such as return on equity, dividend yield, and price to earnings and price to book ratio.
However, I believe this outcome also offers lessons for investors elsewhere, especially the U.S. The U.S. has many regional and community banks for investors to choose from. One way investors might make that choice is to consider the income of the communities where these banks operate. The data from the Crédit Agricole regional banks indicates, however, that this might not be the best method.
Regardless of the broader lessons, the Crédit Agricole regional banks are clearly cheap. It is true they have been cheap for a long time, like most European banks. It is also true this cheapness might be deserved, given their low returns on equity. Finally, it is worth noting that the regional banks do not have American stock tickers, meaning that investors will have to buy their shares through one of the European exchanges where they trade.
In that context, an investor might be interested in Crédit Agricole S.A. as an alternative investment to the Crédit Agricole regional banks. Crédit Agricole S.A. appears cheap like the Crédit Agricole regional banks, with a price to book ratio of around 0.5, a price to earnings ratio around 6, and a dividend yield of around 10%. It also has a high single digit ROE, which was 9.1% in 2021.
That said, even though Crédit Agricole S.A. is part of the same Crédit Agricole Group as the Crédit Agricole regional banks, they are not interchangeable investments. Crédit Agricole S.A. primarily focuses on commercial and investment banking, asset management, insurance, and other business lines that the regional banks lack the scale for.
In that context, only 30% of Crédit Agricole S.A.’s revenues and a smaller fraction of its net income comes from retail banking. This is different from the regional banks, who primarily focus on retail banking.
Crédit Agricole 1H 2022 Financial Presentation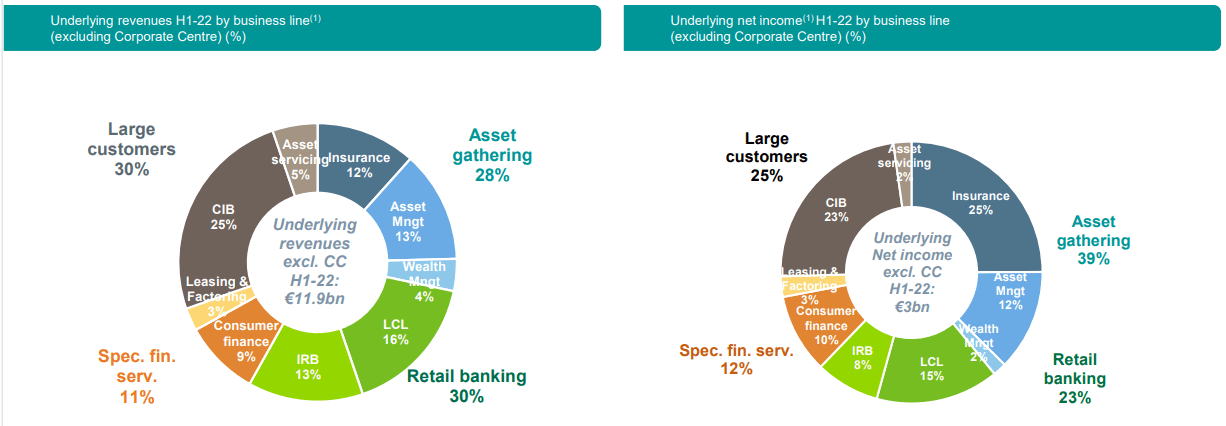
Source: Crédit Agricole 1H 2022 Financial Presentation (opens as PDF)
Even this is deceptive, since much of Crédit Agricole S.A.’s retail revenues come from outside France, unlike the regional banks. The company has retail operations in Poland, Italy, and Egypt which are major drivers of its retail banking revenues. In that context, Crédit Agricole S.A.’s business lines are actually almost totally different from those of the regional banks, being much more diversified.
These more diversified exposures also expose Crédit Agricole S.A. to more diversified risks. In 2011 and 2012, the company took several billion euros in losses from its investments in Greece. More recently, the company has taken losses on its $7 billion in Russia and Ukraine exposure. Beyond that, some of the company’s other lines of business, such as investment banking and insurance, have been associated with steep losses for other banks in the past.
Of course, this doesn’t mean that Crédit Agricole S.A. is a bad investment. I am invested in the stock because it looks cheap and has a reasonably strong return on equity. That said, it is a different type of investment than the Crédit Agricole regional banks, and it would be an error to think they are the same just because they share the Crédit Agricole name.
Beyond that, while Crédit Agricole S.A. is currently earning a stronger return on equity than the regional banks, this might not be true in the future. The Spring 2013 Graham and Doddsville article noted that, at that time, the regional banks’ “ROE [ran] in the mid-single digits to about 10%.” With interest rates rising again for the first time since then, it’s plausible their returns on equity could approach such levels again. Until then, investors in these banks will receive dividend yields in the mid-single-digits while also diversifying their investments into a market—rural France—that they probably lack exposure to. This seems like a good deal, though more research is required.
Be the first to comment