

Sundry Photography/iStock Editorial via Getty Images
The Home Depot (NYSE:HD) is the world’s largest home retailer with a 17% market share in an industry with an addressable market of over +$900B. In 2021, they reported +$151B in net sales and generated +$14B in free cash flows (FCFs). Furthermore, the dividend was increased by 15% and it is now growing at a 10-YR CAGR of 20%. The long-term strategic goal of the company is to reach +$200B in sales, which is certainly attainable, given the fundamental backdrop of the company.
Despite core strengths, shares are selling off on fears of rising rates and the possibility of slowing economic growth. Contrary to existing perceptions, the outlook for the home improvement market is favorable to HD. The increasing number of aging homes in the U.S. is supportive of continued growth in the repair and remodel market. In addition, the underlying financial position of households is strong, and they are significantly less indebted than in prior years.
As interest rates continue to increase, potential homebuyers will get more selective. Since old homes don’t renovate themselves, sellers will have to invest in the improvements to make the sale. The recent pullback has presented an attractive opportunity for long-term investors who believe in the continued longevity of the housing market.
The Charts
HD is currently trading at about $310. This is down about 25% from their high of $416 and about 13% above their average levels for the past several years.
Y-Charts – HD Price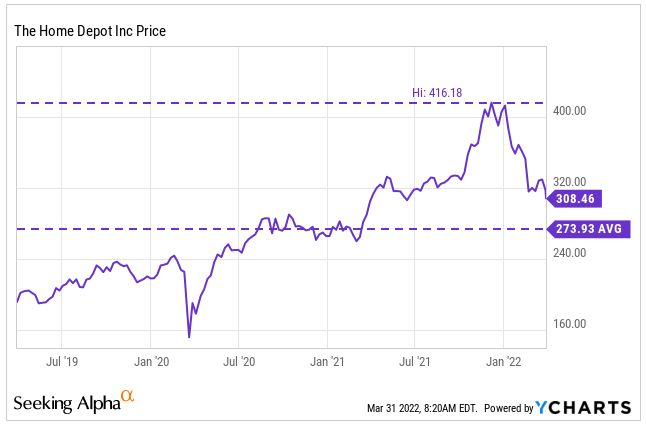
In the past three months, HD is down 24% versus a decline of 18% for Lowe’s and only 3% for the broader market.
Y-Charts – 3MTH Total Returns Comparisons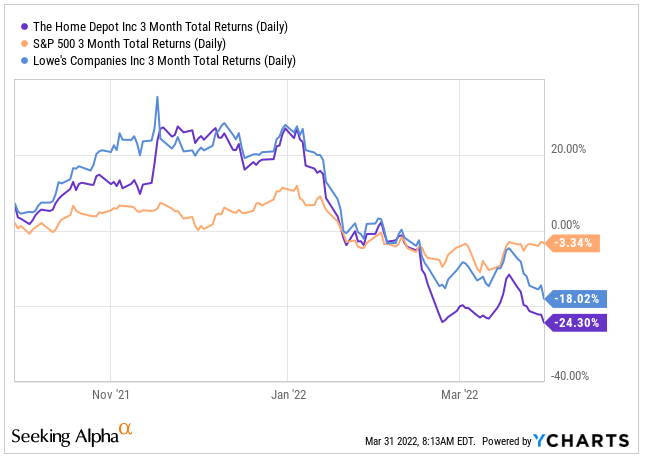
The declines in HD appear overdone compared to their historical performance against both the broader market and Lowe’s. In the past ten years, HD has consistently outperformed on annualized returns. The stock has been on a downtrend recently, but its drop is more than that of Lowe’s, who, historically has lagged or performed on par, at best, with HD.
Y-Charts – Annualized Total Returns Comparisons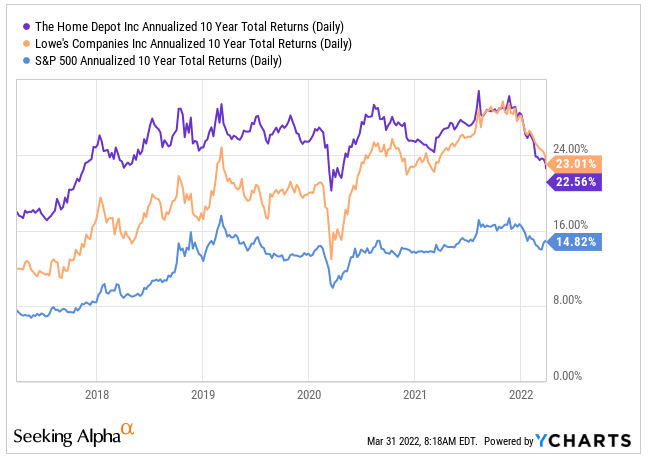
Recently the 200-day moving average of HD surpassed the 50-day moving average. This indicates bearish sentiment and could potentially signal further losses ahead. On days in which the stock moves higher, it will be important to monitor whether the stock can hold above its resistance level. If HD continually retreats after meeting resistance, deeper losses are possible.
Y-Charts – 200/50 Day Moving Average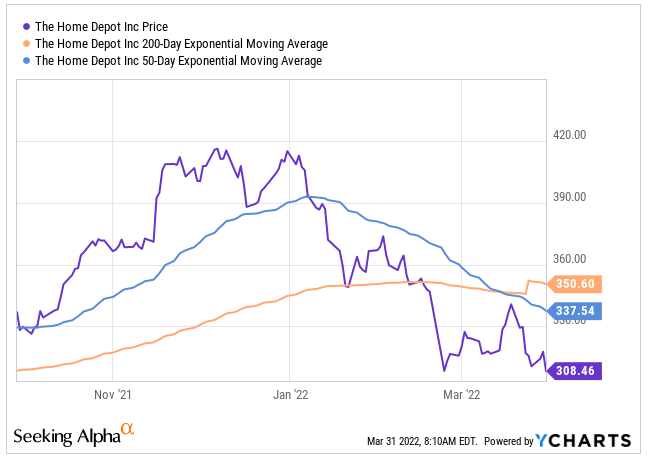
From a relative strength perspective, HD appears to be nearing oversold territory. This also appears to be the case with Lowe’s. The S&P on the other hand is heading up towards overbought territory. Perhaps HD and Lowe’s are forward indicators of what is to come in the broader market. Or, it’s possible that these two stocks truly are oversold.
Y-Charts – RSI Comparisons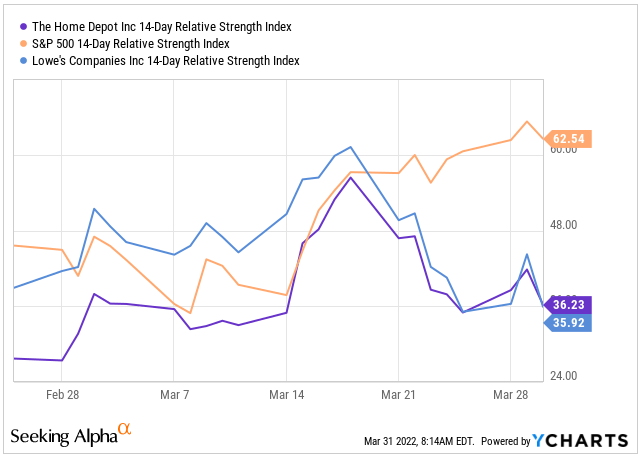
The decline in HD has resulted in a slightly discounted pricing multiple. In 2018, its P/E reached a high of 29x. But the stock has historically trended at about 23.1x. Currently, the multiple is 19.9x. A return to the historical average would yield a stock price of approximately $360.
Y-Charts – P/E Ratio Comparisons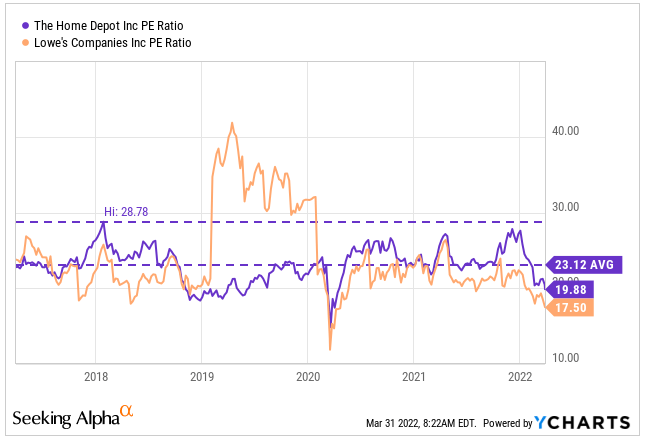
HD has declined much further than the broader market, and there is currently bearish sentiment on the stock based on its moving averages. However, the stock appears to be approaching oversold territory. Additionally, the current pricing multiple is at a discount to historical averages. HD has consistently outperformed the S&P in prior years, and there is little indication that is about to change.
The Opportunity
The leading indicator of remodeling activity projects growth in improvement and repair expenditures to remain steady through 2022. While DIY activity is expected to slow from pandemic-era levels, homeowners are still expected to initiate larger discretionary renovations that had been postponed during the pandemic. One estimate predicts large projects continuing double-digit growth all through 2022 and 2023, before tapering off. As people spend more time away from their homes, any declines in DIY should be offset by an increase in the PRO market, who tend to spend more than the average DIYer.
At John Burns Real Estate Consulting (JBREC), one statistic stated that those who have remodeled in the past were 3.7% more likely to remodel again, spending an average of 11% more. In addition, another statistic states that 80% of features in a home become outdated within 15-20 years. Since most homes in the U.S. are older than 20 years, this provides a favorable population for future remodels.
With household net worth at all-time highs, the ability of existing homeowners to tap into their equity to finance large projects is as strong as it’s ever been. Additionally, favorable demographics support continued growth in improvement spending. In general, remodeling expenditures rise sharply among owners age 35 and over, due to higher incomes and growing families. Spending then remains at this elevated level until homeowners approach their retirement years. This indicates a long runway of improvement projects in the years ahead.
Board of Governors of the Federal Reserve System (US), Households; Net Worth, Level [BOGZ1FL192090005Q], retrieved from FRED, Federal Reserve Bank of St. Louis![Board of Governors of the Federal Reserve System (US), Households; Net Worth, Level [BOGZ1FL192090005Q], retrieved from FRED, Federal Reserve Bank of St. Louis; https://fred.stlouisfed.org/series/BOGZ1FL192090005Q, April 1, 2022](https://static.seekingalpha.com/uploads/2022/4/1/49921492-16488111294758239_origin.png)
While existing homeowners are seeing large gains in their net worth, rising home prices continues to push homeownership out of reach for many Americans. The price for existing homes rose 15% in February, alone. Yet, the increases have yet to slow home buying activity. In fact, applications submitted by potential homebuyers have risen for the past three out of four weeks, according to the Mortgage Bankers Association.
S&P Dow Jones Indices LLC, S&P/Case-Shiller U.S. National Home Price Index [CSUSHPISA], retrieved from FRED, Federal Reserve Bank of St. Louis![S&P Dow Jones Indices LLC, S&P/Case-Shiller U.S. National Home Price Index [CSUSHPISA], retrieved from FRED, Federal Reserve Bank of St. Louis; https://fred.stlouisfed.org/series/CSUSHPISA, March 31, 2022.](https://static.seekingalpha.com/uploads/2022/4/1/49921492-16488111300091505_origin.png)
With rates rising and projected to continuing rising, there are concerns that overall activity will slow. For example, average mortgage rates recently hit 4.67%, according to the weekly release from Freddie Mac. This was the highest reading since December 2018. At the beginning of the year, rates were 3.22%. On a $400K house, that would result in a yearly increase of approximately $4,000 on a household mortgage payment. Despite the increase, however, mortgage debt service payments as a percentage of disposal personal income are still at an all-time low, accounting for less than 4% of disposal personal income in 2021.
Board of Governors of the Federal Reserve System (US), Mortgage Debt Service Payments as a Percent of Disposable Personal Income [MDSP], retrieved from FRED, Federal Reserve Bank of St. Louis![Board of Governors of the Federal Reserve System (US), Mortgage Debt Service Payments as a Percent of Disposable Personal Income [MDSP], retrieved from FRED, Federal Reserve Bank of St. Louis; https://fred.stlouisfed.org/series/MDSP, March 31, 2022.](https://static.seekingalpha.com/uploads/2022/4/1/49921492-16488111305291677_origin.png)
Overall household debt service payments are also at all-time lows. While overall debt is on an uptrend from the lows, the percentage is still low by historical standards. Prior to 2010, households were spending over 12% of their disposable personal income on debt service. That has since fallen to just above 9%.
Board of Governors of the Federal Reserve System (US), Household Debt Service Payments as a Percent of Disposable Personal Income [TDSP], retrieved from FRED, Federal Reserve Bank of St. Louis![Board of Governors of the Federal Reserve System (US), Household Debt Service Payments as a Percent of Disposable Personal Income [TDSP], retrieved from FRED, Federal Reserve Bank of St. Louis; https://fred.stlouisfed.org/series/TDSP, March 31, 2022.](https://static.seekingalpha.com/uploads/2022/4/1/49921492-16488111307685227_origin.png)
HD has benefitted from the uptick in DIY home improvement projects resulting from COVID-related lockdowns. With more people embarking on other activities outside of their homes, there is a perception that home improvement projects will steadily decline. Rising rates are creating additional uncertainties. Despite the concerns, the outlook is positive. The underlying strength of consumers’ balance sheets is strong, and many have access to record equity in their homes. The population of older homes in the U.S. continues to increase and most will require modernization to retain their value, especially in an era of rising rates. These structural trends will continue being tailwinds for HD.
The Fundamentals
Author’s Assessment of Strength of Fundamentals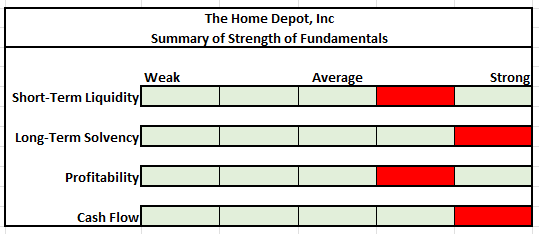
The company’s balance sheet consists principally of inventory, which accounted for 75% of total current assets at the end of 2021. Inventories did increase significantly in 2021 due to increased purchases. The effect of the purchases could be seen in the drop in the cash balance from +$7.9B at the end of January 2021 to +$2.3B at the end of January 2022.
Total Current Assets – Form 10-K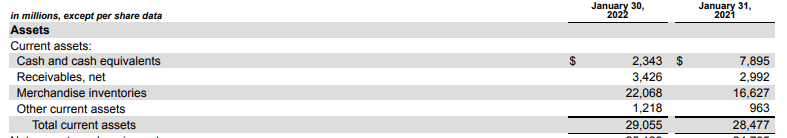
Inventory acquired by the company is consistently turned over on a timely basis. On average, it takes between 65-70 days to sell off inventory. Since inventories account for most of the company’s current assets, inventory turnover is critical, especially because the low quick ratio indicates the company doesn’t have enough liquid assets to cover their total current liabilities.
Author’s Calculations of Various Liquidity Ratios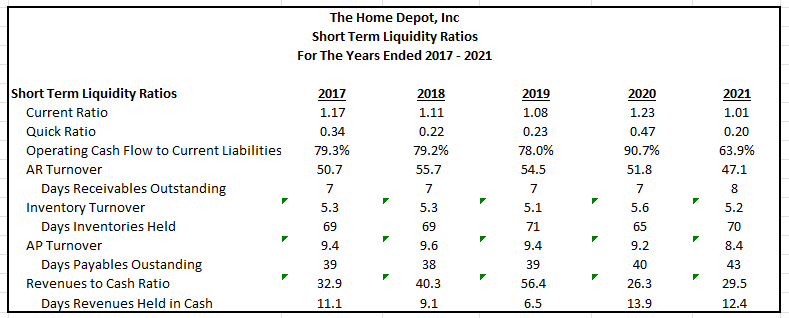
The effectiveness of the company’s working capital management is indicated by the number of days of other financing required by the company after accounting for short-term supplier provided financing. In 2021, there were 78 days in which cash conversion was pending from the sale of inventory and the collection of A/R. In this timespan, the company held off payment to their suppliers for 43 days. Thus, there were only 35 days in which HD needed to tap into existing cash on hand or other financing sources to fund their current working capital needs.
Author’s Calculations of Days of Other Financing Required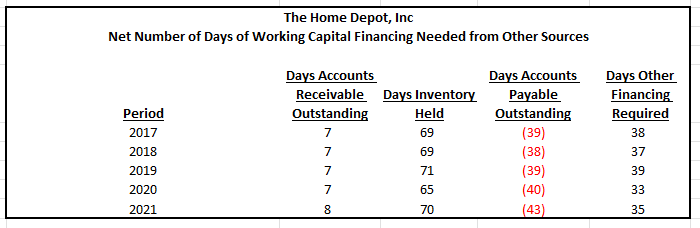
From a long-term standpoint, HD operates on a high degree of debt to assets and equity. This is not a concern, however. Their net debt/EBITDA was 1.3x at the end of 2021, and their interest coverage ratio of 17.7x indicates a strong ability to meet their interest obligations. In addition, the Z-Score of 8 suggests a 0% chance of bankruptcy.
Author’s Calculations of Long-Term Solvency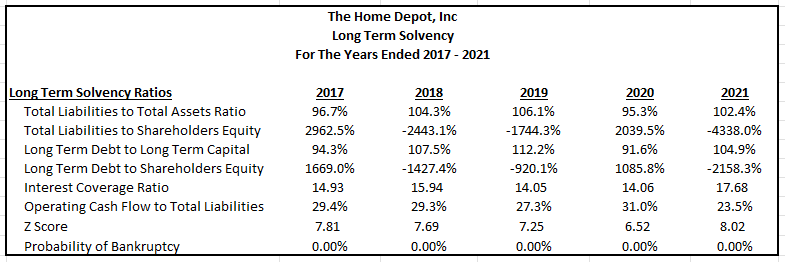
In addition to easily covering their interest payments, the company also has minimal repayment risk. Nearly 80% of the company’s total obligations are due after the 2026 fiscal year, and the amounts due prior to then are spread out evenly each year.
Summary of Debt Maturities – Form 10-K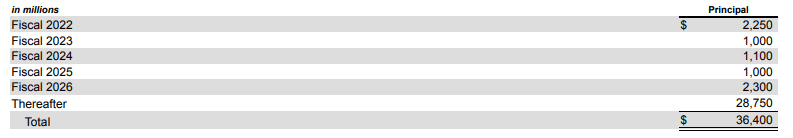
The strength of the company’s balance sheet is reinforced by their consistent ability to generate positive returns and cash flows. In 2021, revenue growth slowed from 2020, but it was still up by double-digits. Additionally, their net income and EBITDA margins both surpassed levels achieved for the past five years. Moving forward, growth is expected to moderate, but margins will remain strong, regardless.
Author’s Calculations of Historical Margins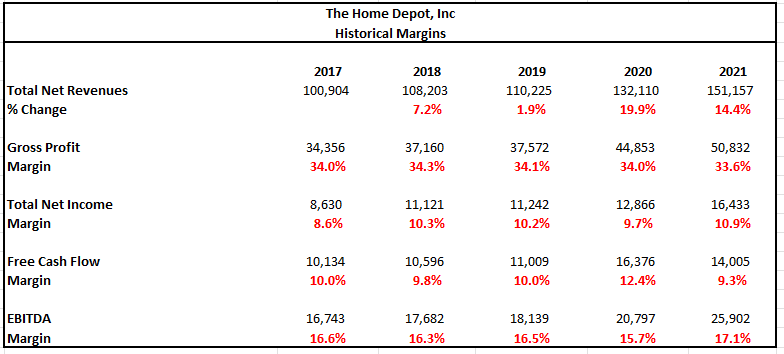
FCF margins were down, but that is partly due to the inventory build in the current year. Still, even with the inventory build, FCF came in at +$14B, which was lower than 2020, but 27% higher than in 2019. If purchases of inventory were at more normalized levels, FCF would have been approximately +$18B, which is 10% greater than 2020 and 64% greater than 2019.
Strong cash flow generation is resulting in significant shareholder payouts. Dividends have been growing at a CAGR of 18% over the past five years and the company has nearly +$10B remaining on their share repurchase authorization. Both FCF and operating cash flow cover the dividends by more than 2x and the payout is less than 50% of net income, indicating strong coverage. At present, there are no indications that future payouts are at risk.
Author’s Summary of Cash Flow Statement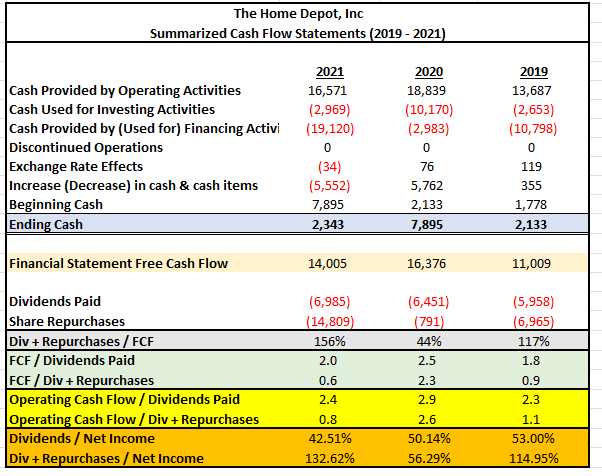
The overall fundamentals of HD are strong. The company is effective at managing their working capital, and they have adequate cash on hand to cover their working capital needs. In addition, their long-term viability is solid with no significant near-term debt maturities and no risk of missing their interest obligations in the interim. The balance sheet is anchored by a history of delivering strong earnings and generating significant FCFs. Finally, funds not invested into the business are returned to shareholders in the form of fully covered dividend payments and share buybacks.
Target Share Price
Various methodologies were utilized to obtain an indication of the intrinsic share price of HD. The results are provided in the chart below. The quickest methods involved simply applying the historical multiples to current pricing. Doing so yielded target prices with a low of $292 to a high of $342.
When applying models involving future cash flows, results came in at a low of $317 and a high of $371. With these models, the rate on 10-YR U.S. Treasuries is a critical variable in the computations. Since rates are projected to increase, the model incorporated the current rate, which was 2.5% at the time of analysis, as reported in The Wall Street Journal. And for hypothetical purposes, the analysis also utilized a rate of 3%.
When considering the results of all methods, the average target price worked out to be $335.
Author’s Summary of Results of Various Valuation Methodologies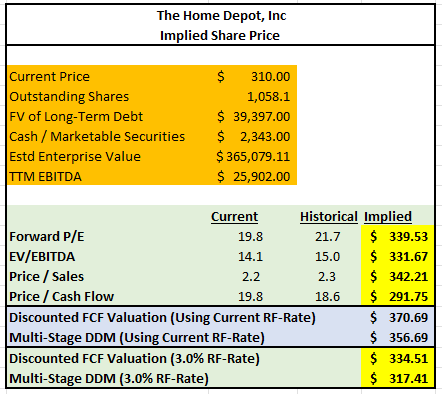
For illustration purposes, a further explanation is provided below of the methodology used for the DDM.
The first step in the model was to determine the discount rate to utilize in the model. For this, use of the capital asset pricing model (CAPM) was preferable. The model is a function of the stock beta and the risk premium, which is the difference between the expected return on the market and the risk-free rate. The beta of the stock is 1.06, as reported in Morningstar. The risk-free rate was the rate on 10-YR U.S Treasuries, which was 2.50%, as reported in The Wall Street Journal. The historical risk premium is 5.5%. Thus, the expected return on market is 8.00%. After inputting these variables into the CAPM, a discount rate of 8.33% was obtained.
Author’s Calculation of Discount Rate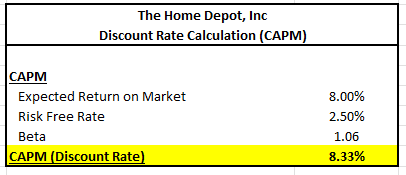
The next step was to input revenue and balance sheet related data from the past five years. The results are provided below. Upon analyzing the results, a few observations were made.
- Net income margins are approximately 10%
- Total liabilities are over 100% of total assets
- Total shareholders’ equity is negative
- The asset turnover ratio is 2.12
Author’s Inputs of Historical Income Statement and Balance Sheet Data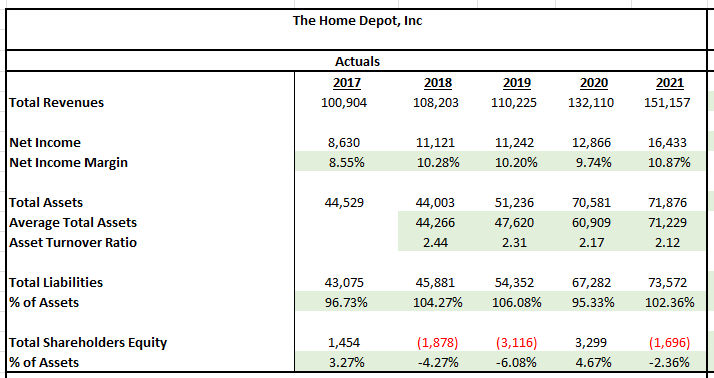
The observations noted above were then used to generate a forecast for the next five years. By projecting out total revenues and total assets, net income and total liabilities and shareholders’ equity were derived using the applicable percentages noted earlier.
Forecasted revenues are shown below. This model assumes that the company will reach their goal of +$200B in total net sales in five years.
Author’s Projections of Total Revenues
To explicitly link asset growth with sales growth, the asset turnover rate of 2.12 was used to project total future assets. The results are shown below.
Author’s Projections of Total Assets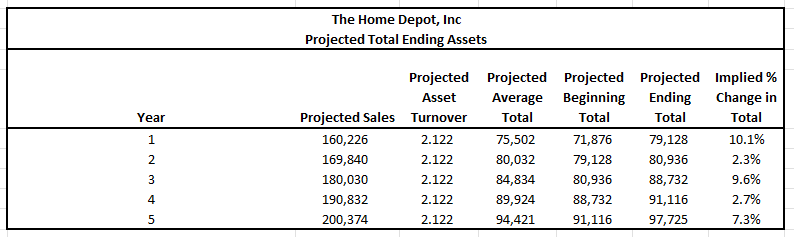
One will notice that the implied % change in total assets fluctuates from year to year, whereas for purposes of this model, sales were expected to grow smoothly each year. To smooth out these asset fluctuations, the CAGR of total assets was calculated. In the model above, total assets were expected to grow to $97,725 from $71,876. This represents a CAGR of 6.34%. The final projected totals using this growth rate are summarized below.
Author’s Smoothing of Total Assets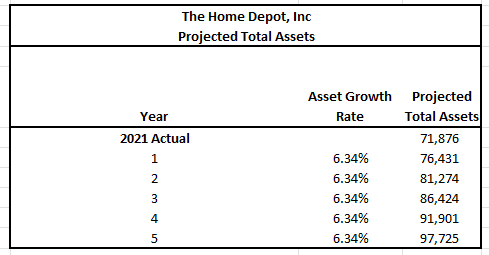
The totals above were inputted into the five-year model below. The total equity and net income in year five were the critical inputs required for the continuing value calculation.
Author’s DDM Model Summary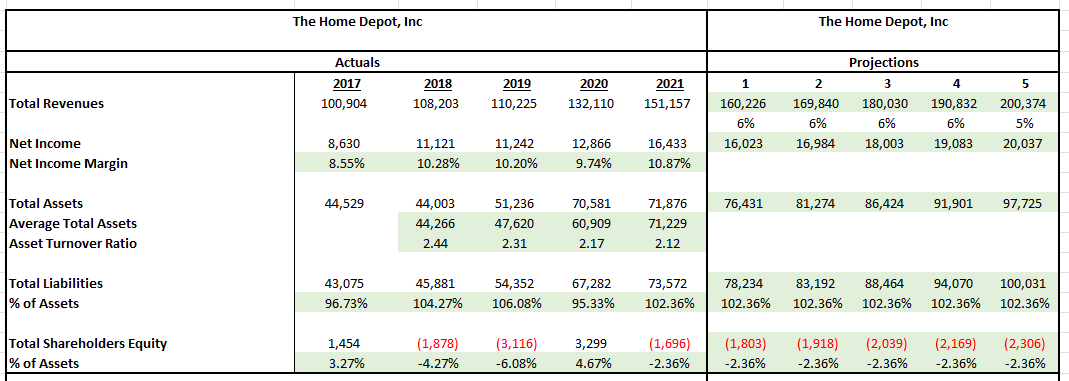
One of the final steps in the model was to input the historical shareholder payouts and share issuance data of the past five years and prepare a projection using the historical averages. The summary below provides the results of this analysis. HD had nearly +$10B left under their current share repurchase program. This model assumes that the remaining repurchases will occur ratably over the next five years. Additionally, HD has been issuing stock at about 0.2% of sales, and the dividend payments have been about 4.5% of sales. Both are projected to account for the same share moving forward. Using these averages, the projections were prepared, and they were then discounted using a rate of 8.33%.
Author’s Projections of Future Shareholder Payouts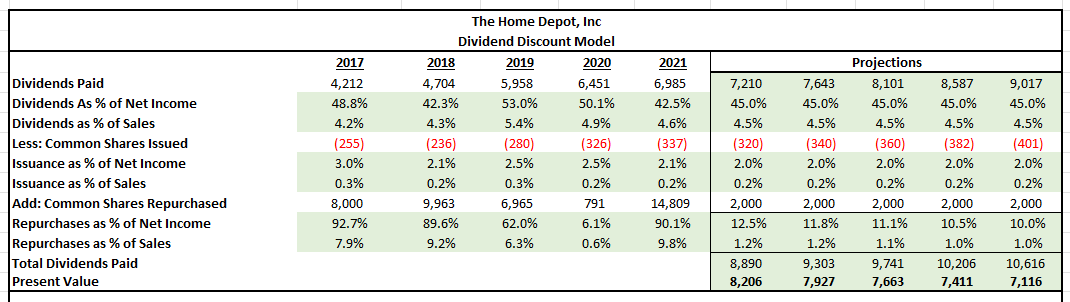
Upon summing the present value of the net shareholder payouts above, the total was added to the continuing value that was calculated using a projected growth rate of 4%.
Author’s Final Calculation of Intrinsic Share Value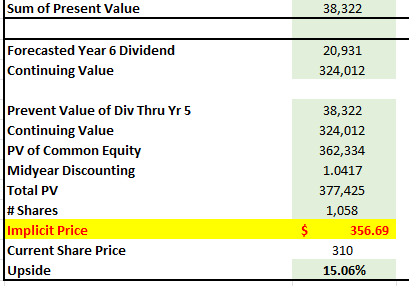
As seen above, the results of the model yielded a result of $357. Taken together with the multiples approach, an average price target of $335 is appropriate.
Primary Risks
HD’s financial performance depends significantly on the stability of the housing and home improvement markets, as well as general economic conditions. Adverse or uncertain conditions in the housing market or the broader economy in general could adversely impact the confidence or financial condition of the consumer, causing them to decide against purchasing home improvement products and services or impacting their ability to pay for products and services.
Prices of certain commodity products, including lumber and other raw materials, are volatile and subject to fluctuations based on various external factors, such as supply and demand, inflationary pressures, competition, and market speculation. Significant increases in the cost of these inputs could have a negative impact on the company if they are unable to pass through the increases to their customers.
In addition to rising input costs, supply chain disruptions could adversely affect HD’s ability to receive and deliver their inventory in a timely manner. This can result in increased transportation costs if the company chooses to utilize expedited shipping or dissatisfied customers if they are not provided their goods in a timely manner or if the products they need are continually out of stock. This may result in the loss of future business with both existing and prospective customers.
Conclusion
The current declines in HD appear to be overdone. Despite outperforming the broader markets in prior years, the stock is currently down 24% over the past three months. The threat of rising rates and a slowing economy are credible concerns. The pullback in DIY projects after stellar activity over the past two years is another potential reality. Despite the negative sentiment, the outlook is positive.
The home improvement market is projected to remain steady for the next two years. In addition, most homes in the U.S. are at the age that support the repair and remodel market. Record equity in existing homes will provide homeowners with a financing source for the larger projects that were delayed due to COVID. These projects will be outsourced to the PRO market, who will spend more than the average DIYer. Moreover, as younger generations progress into their later years, the demand for housing will increase in-turn.
HD’s fundamentals are strong enough to capture new opportunities or get through any challenges that may arise in the near-term or down the road. The company is effective in managing and deploying their working capital, and their ability to consistently generate positive free cash flows is a strength that has rewarded shareholders for many years. The significant share price decline in recent months has presented an opportunity for new and existing shareholders to anchor their portfolios with this home improvement leader.
Be the first to comment