

Saran_Poroong
On June 16, I posted an article on Seeking Alpha, “How To Tell When the Bear Market is Over.” The key points were:
- The trend turns up
- Volume increases with the new upward direction
- Prices move up when the economic report is clearly negative
At the time of the report, none of these triggers had occurred. Since then, we have some positive indicators.
Backdrop
On Wednesday the Fed raised rates by 75 bps. It was expected. But the market moves on anticipation, so the issue is now, “What Will the Fed Do Next?” The market seems to be expecting another 75 bps hike, but now there is an increasing opinion that the Fed will pivot and start lowering rates next year.
The economy is very different now than it was when the Fed raised rates in 1979. Back then our debt was lower, baby boomers were coming into the workforce spurring spending, and women were finally entering the workforce in more significant positions.
Now we have very different demographics, with boomers retiring and cutting spending. Women are no longer a driving force. Debt to GDP is now 130% instead of 30%. If the Fed stays the course, we are likely to see a recession.
How Did the Market React?
The key take-away from the Powell press conference was his statement: ‘‘We are now at levels broadly in line with our estimates of neutral interest rates, and after front-loading our hiking cycle until now we will be much more data-dependent going forward.’’
What did the market do? Charts 1, 2, and 3 show the 5-minute price moves of the S&P 500 (SPY), Nasdaq (QQQ), and the long bond ETF (TLT). On the SPY and QQQ charts, we see a jump up after 1 pm (Central time), following the announcement. The TLT chart shows a drop indicating expectation of lower rates. But the Fed is still going to raise rates, perhaps twice more. On Thursday TLT reverses and goes sideways for the remainder of the week while both SPY and QQQ continue to rally.
Interactive Brokers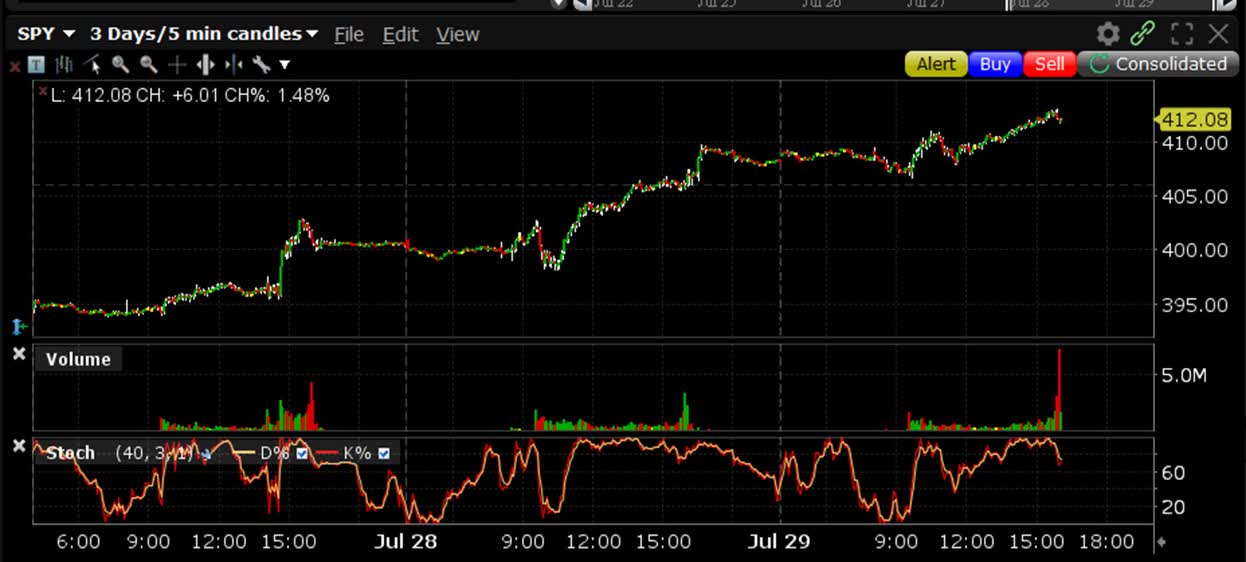
Chart 1. SPY 5-min chart Wednesday through Friday
Interactive Brokers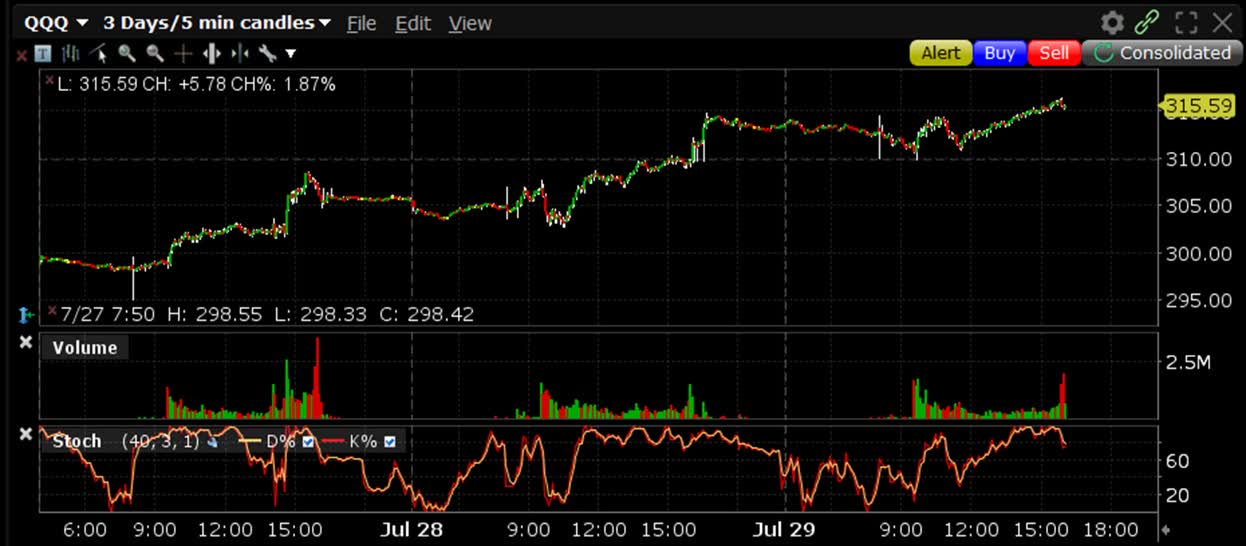
Chart 2. QQQ 5-min chart Wednesday through Friday
Interactuve Brokers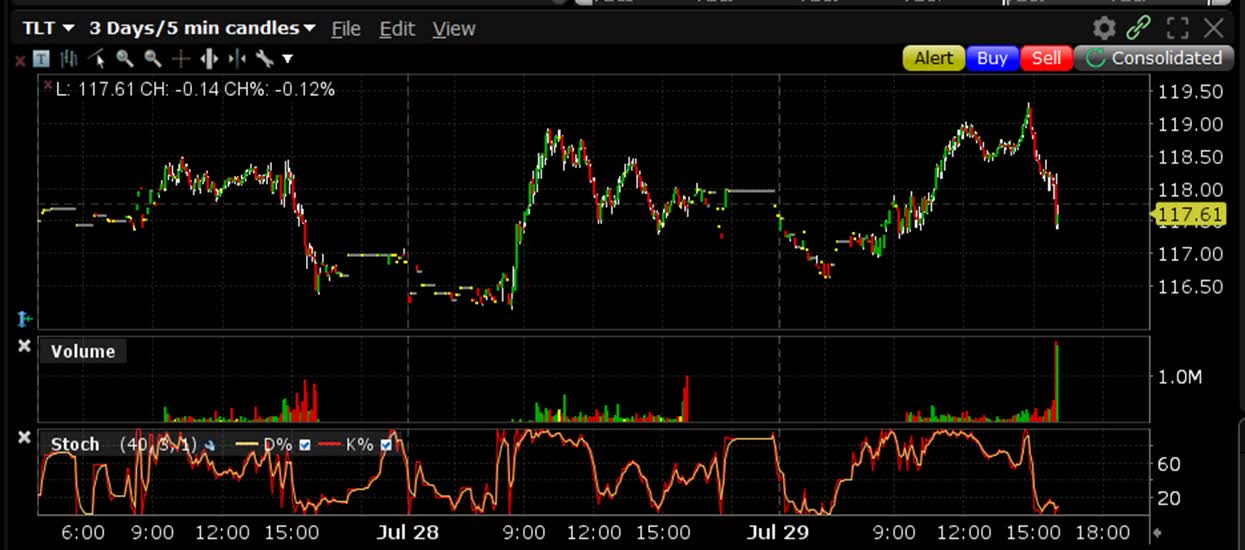
Chart 3. TLT 5-min chart Wednesday through Friday.
I normally expect “buyer’s remorse,” but it did not happen. But today, Monday, August 1, rates are slightly higher. That’s not a concern now, but something to watch.
Personally, these market moves seem a bit optimistic and preemptive. Rates will still go higher, unemployment should increase, and inflation will be slow to reverse. But as a technical trader, I’m going to follow the rules. This was a negative report with a positive reaction. It satisfies the 3rd and most important rule.
The Trend
In all three markets, the 20-day moving average has turned up. It happened on July 13. The 10-day trend turned up on June 27, a month ago. Regardless of mixed earnings reports and the Fed’s intention to raise rates quickly, the stock market has been moving higher for more than a month – not fast until this week, but higher. You can see where it started in Chart 4.
Data source: CSI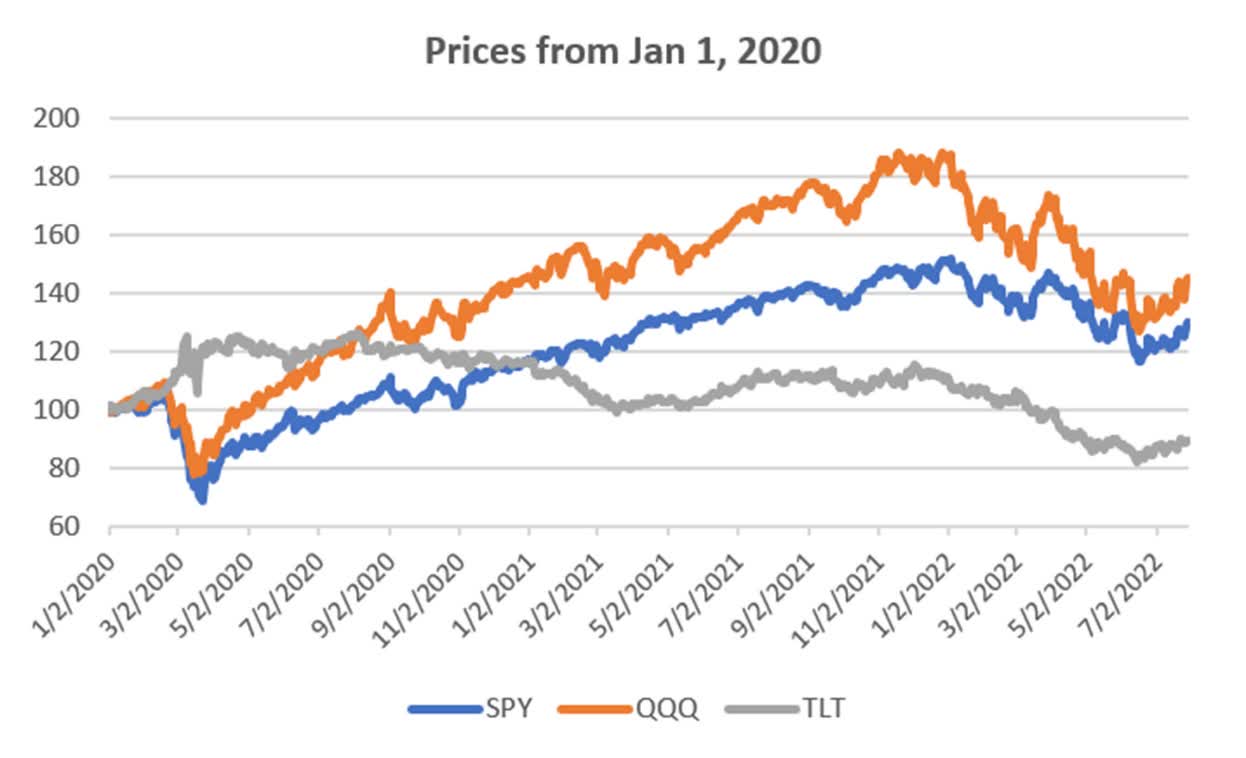
Chart 4. Prices turn higher in June, interest rates turn lower (an upwards move in TLT).
Volume
Having satisfied two of the three conditions, what about volume? Typically, a major sell-off turns into a quiet period, where investors do nothing. That doesn’t seem to have happened here. Then we can’t confirm that volume is increasing, but it is holding steady.
Data source: CSI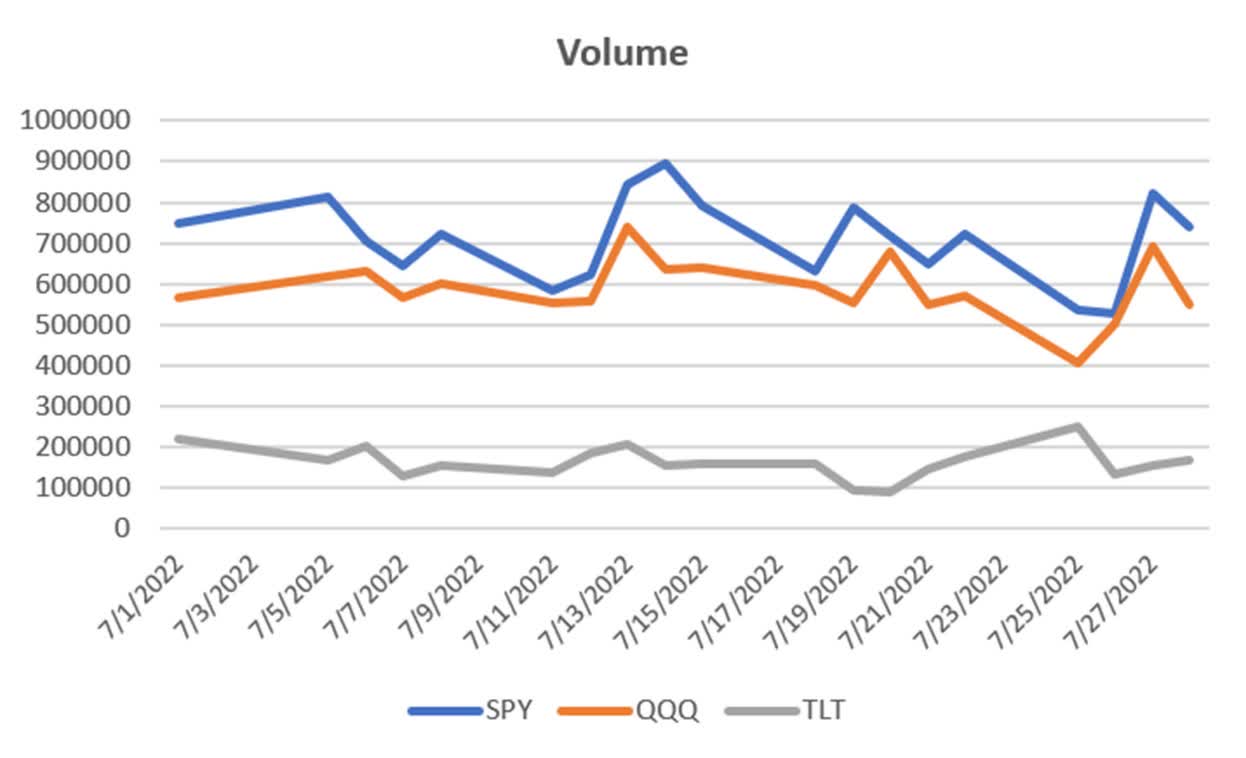
Chart 5. Volume of SPY, QQQ, and TLT from July 2022.
Confirmation
If we are going to feel more comfortable about saying this is the bottom, we can look at energy and grain prices, two of the more important commodities contributing to inflation. Chart 6 shows cash gasoline and natural gas prices from 2022. Gasoline has pulled back about 22% from its highs, and is down another 4% today, while natural gas has rallied after its decline.
Data source: CSI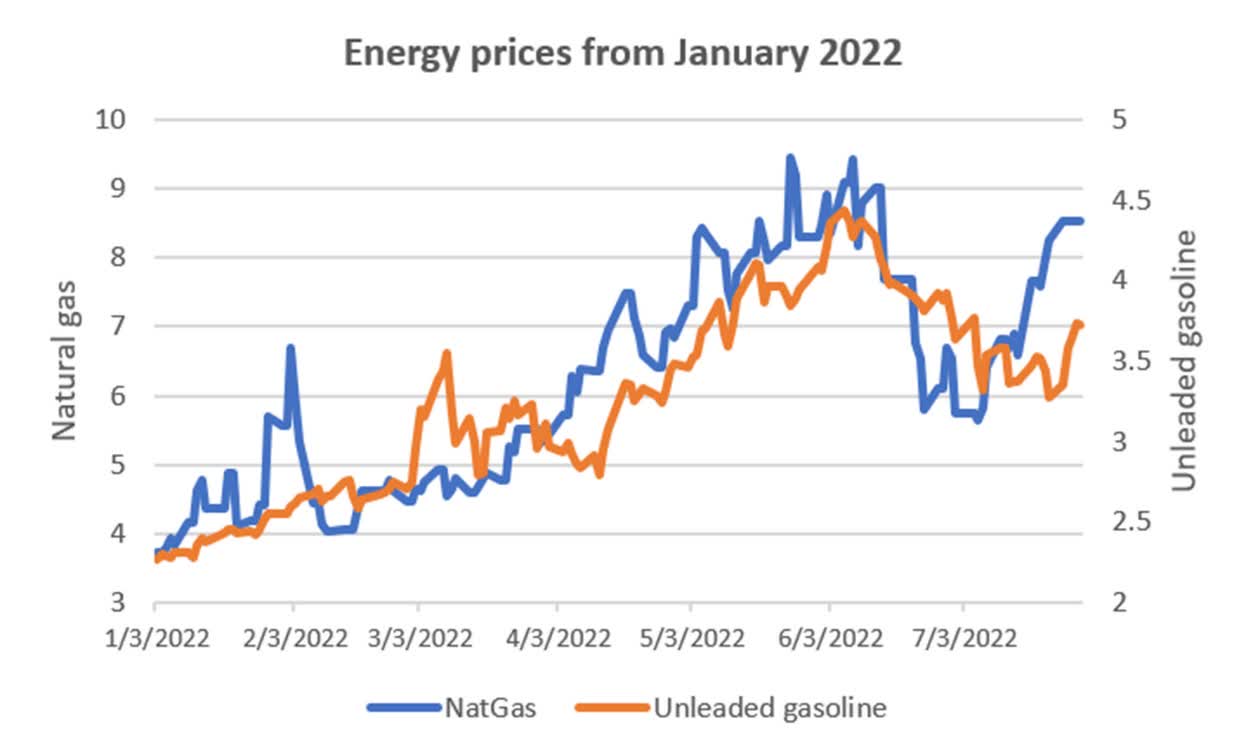
Chart 6. Natural gas and unleaded gasoline prices from January 2022.
We can understand why natural gas has rallied. Russia continues the close off supplies to Europe. It may go higher. But gasoline is more of a guess. There seems to be enough gasoline, so the decline would be caused by a lack of demand. At high prices, everyone is conserving. In which case, it is not likely to make new highs. It is, however, much higher than a year ago, which contributes to inflation, just not as much as a month ago.
Wheat has also been in the news. Ukraine is a big supplier of wheat and Russia has prevented its exports. It still does. That’s why I find the drop in wheat prices confusing. Having peaked at $13, it is now at $8, a drop of nearly 40% and back to levels before the war. Yet nothing seems to have changed. Corn, a more U.S. market, has a similar pattern (see Figure 7).
Data source: CSI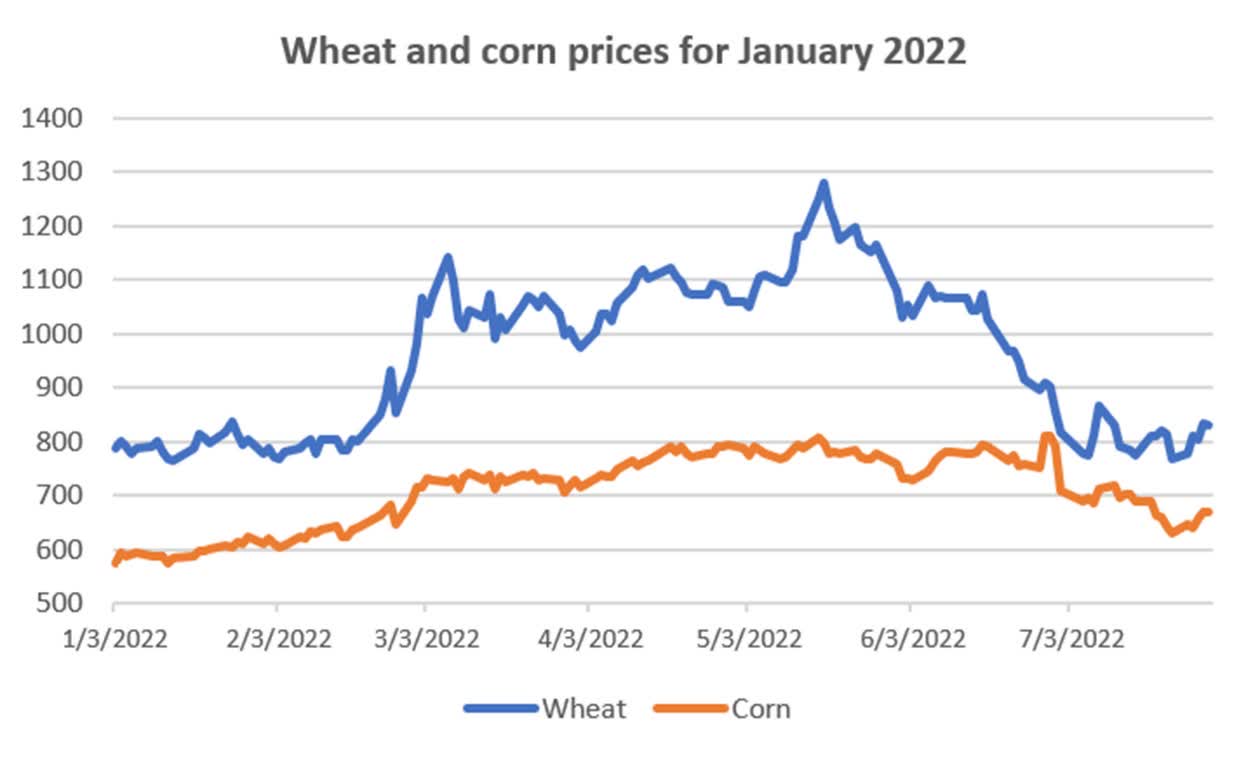
Figure 7. Wheat and corn cash prices from January 2022.
Conclusion
The reason why I am an algorithmic trader is because I can’t explain what is happening. We expect higher interest rates, job loss, sustained inflation, but the market rallies. Investors have decided that this is the bottom, or likely to be the bottom. Yes, prices seem to be normalizing and the Fed may raise rates slower. It is enough to satisfy traders.
How to Trade as Safely as Possible
I am not recommending that you go long here, but many traders want to be in a rally as soon as possible. I simply follow my system, which tends towards longer-term trends. I may miss the beginning of the move, but I follow the rules that have worked for a long time.
If you want to enter now, then pay attention to the 20-day moving average or the previous low of your stock or ETF. Exit on a new low or when the trend turns down.
This may be the bottom of the market. We won’t know for a long time. But it is likely that there will be another sell-off. Interest rates will go higher, and we will be bombarded with good news and bad news. We have no idea how the market will react. It has a mind of its own. Best be safe. You can be early in the rally if you know where you will exit and stick to it. You can always reenter. At some point you’ll be right!
Be the first to comment