

Financial term CPI (Consumer Price Index) on green finance background. Trend Up and Down, Flat Vladimir Zakharov/iStock via Getty Images
It is often said that history repeats itself, sometimes in a good way and sometimes not so good. With inflation in the U.S. and globally rising measurably over the past year, history buffs are drawing comparisons to the bad old days of the 1970s when inflation raged, and painful measures were undertaken to reverse its course. To be sure inflation has moved front and center in the past year. In February, consumer prices rose 7.9% yearly matching the rate it hit in 1978, although falling shy of the 14.6% peak rate that it hit in April 1980 as shown on Chart I attached. No one wants to revisit that earlier period of stagflation and the double-digit level of interest rates that became a hallmark of the effort to break the back of the price spiral.
In reviewing that earlier period, we have found several similarities and differences between then and the current experience. For starters, to quote a phrase from the late Milton Friedman, inflation is always and everywhere a monetary phenomenon of excessive growth. Inflation starts with too much money chasing too few goods and then it becomes endemic if not checked. As shown on Table I attached, excessive money growth has been has hit new heights over the past few years. In the period from 2015-2020 the M2 money supply rose at a respectable nearly 8% annual rate. But in a valiant effort to combat the global pandemic the Federal Reserve acted quickly and forcefully. It provided massive amounts of liquidity and guarantees to the financial system, and it was instrumental in monetizing an exorbitant amount of federal government spending in 2020-2021. In that two-year period the M2 money supply rose at a gigantic 17.75% rate, and it has only recently begun to slow.
Not too dissimilar, Table I also shows that from 1970 to 1980 money supply growth accelerated to a nearly double-digit rate in a much smaller domestic and global economy. Not only was the Federal Reserve called upon to finance the Viet Nam war, but under the guidance of then Fed Chairman Arthur Burns, it also bended to political pressure to boost economic activity in front of the 1972 election. Inflation began accelerating in the early 1970s and it was thought to be manageable as the first stage of wage and price controls held inflation in check. But then the global economy was rocked by the twin shocks of a Middle East oil embargo which quadrupled the oil price in a matter of months, and a failed anchovy and grain harvest which ignited a sharp increase in food prices. What began as a temporary manageable problem quickly deteriorated and eventually took on a life of its own.
It was only two years ago that the Federal Reserve was guiding policy toward boosting inflation. A pandemic induced fear of deflation outweighed any concern over inflation. And even as inflation began to pick up in 2021, it was first welcomed; then it was described as being merely a transient by-product of the post pandemic economy; but now something possibly far more persistent. Belatedly recognizing this persistence, current Fed Chairman Powell is vowing to beat it into submission in the model of former Fed Chairman Paul Volcker. Deserved or not, Paul Volcker is widely given credit for conquering the double-digit inflation of the late 1970s and early 1980s. Those who disparage the current Fed Chair disdainfully proclaim that while Mr. Powell talks like Paul Volcker, his actions are more akin to those of Arthur Burns.
The late 1970s inflation created numerous distortions. Household purchasing power was ravaged by rising prices. Fixed income recipients and investors lost out. Indeed, in 1978 famed investor Leon Cooperman termed government bonds to be certificates of confiscation. Inflation distorted profits as well. Inventory valuation became a significant portion of overall profits creating a gulf between total profits and operating profits So far at least neither of these distortions has risen in intensity, but they may very well rise in importance if inflation is left unchecked.
Recognizing inflation’s destructive power of the late 1970s, the Reagan administration supported an anti-inflation monetary policy early in its first term. And this support did not waver despite twin recessions in the 1980-82 time span. Similarly, the Biden administration is voicing support for the Fed’s newly found anti-inflation policy stance. A big question is whether this support will be sustained if economic activity slides in the coming year, and whether the current Fed Chair has the fortitude to do whatever may be necessary to slay the inflation dragon.
Like the 1970s, food and energy shocks are proving to be the spark that is currently igniting inflation. In that earlier period the economy was more vulnerable to such a shock than it is now. At that time there was roughly a one-to-one relation between energy usage and economic growth. And food comprised roughly 21.5% of the household budget. With advances in technology, one unit of energy is used to generate about three units of GDP in the present day economy while food represents only about 15% of the household budget.
During the 1970s this country was very dependent on imported energy to power the economy while Europe was essentially energy self-sufficient. Today those roles are largely reversed with the U.S importing only about 10% of its energy needs, but Europe importing about 25% of its power needs, nearly half of which comes from Russia.
Further, approximately 25% of the workforce was unionized in the 1970s, and collective bargaining agreements began including cost of living escalators into wage contracts. This facilitated a wage-price spiral. Union contracts currently represent only about 10% of the total, so there is less propensity for the onset of a wage-price spiral. However, from anecdotal reports it seems that many companies are voluntarily offering cost of living adjustments as an inducement to employees to reduce labor mobility because of the current tight labor market.
Similarities between the 1970s and early 1980s are stark, but there are subtle and worrisome differences. Feeling the angst of the electorate, in 1979 President Jimmy Carter appointed Paul Volcker as Fed Chair to a term that lasted into 1987, spanning two administrations. At the time President Carter also named Alfred Kahn as Chairman of a newly formed Council on Wage and Price Stability (CWPS). Money supply growth plummeted in the 1980-82 period and simultaneously Alfred Kahn’s CWPS was instrumental in the deregulation of the airline and trucking industries. Kahn’s appointment was significant and in our view its achievements were under appreciated by the investment community then and now. But the fact is that from 1977 to 1982 the cost of freight fell by about 25% while service expanded. By July 1982 consumer inflation fell from its 14.6% peak to only 2.4% as shown on Chart I. It was also around this time that President Reagan fired the Air traffic controllers for engaging in an illegal strike. This was widely credited with moderating wage inflation for many years.
While the Carter- Reagan administrations supported competition and deregulation, the Biden administration is decidedly pro union and pro regulation. As one example, the Biden team is a staunch supporter of the PRO act, an acronym for Protecting the Right to Organize. One provision of the act would impose initial contract terms on newly unionized firms. Another would prevent a company from hiring permanent replacements for striking workers. Since assuming the presidency nearly 5000 new regulations have been added to the Federal Register. Approximately 16% of these directly and indirectly affect the fossil fuel industry, and not in a way that is meant to encourage domestic exploration and production.
Domestic oil production is currently running nearly 2 million barrels per day below its pre pandemic peak even as oil prices are above the levels that prevailed in 2018-2019. There are numerous reasons including pressure by investors for more favorable capital allocation, pressure on banks to shy away from funding new projects, pressure from climate activists, and a vow by political powers to fully replace fossil fuel with renewable energy sources.
But the world is now in a different place owing to developments in Eastern Europe. Food and energy inflation is erupting and the security of the supply of necessities is in the forefront as it was in the 1970s. Ukraine alone is the world’s fourth largest exporter of corn and the eighth largest exporter of wheat. Russia and Ukraine account for about 30% of global wheat exports, about 20% of global corn exports, and nearly 80% of sunflower exports. The two countries are major producers of ammonia nitrate for fertilizer. In the energy sector Russia has become the world’s third largest producer and the world’s second largest exporter. Supply is currently being interrupted by between one and three million barrels per day with the likelihood that this could soon rise. At this time natural gas is still flowing from Russia into Europe, but this could change at any time.
Regardless how current hostilities between Russia and Ukraine evolve, Russia will be viewed as a pariah state and its access to global markets will be curtailed while its ability to export basic resources will be curtailed. Similarly fossil fuel supply from the Middle East may be less secure as political developments have soured relations with western governments. Internal tensions between Saudi Arabia, Iran and Israel are ever present and a potential source of instability.
So, like the 1970s and early 1980s food and energy shocks, were the spark that ignited an inflation that had its roots in the excessive monetary growth of the prior decade. But in that earlier period shocks proved to be temporary as market forces were allowed to operate in an efficient non-regulatory environment. The response to high food prices was huge expansions in planted acreage in South America and elsewhere. Energy exploration expanded greatly with big discoveries in Mexico, Alaska, the North Sea and in Russia. Shortages were resolved in the 1980s and market power shifted away from repressive regimes.
Today food and energy shocks are more concerning because market forces are being hindered by excessive regulation and restricted capital flows. These we think will complicate the task of monetary policy in its fight against inflation. The result could be that while inflation is unlikely to be as severe as it was at the peak forty odd years ago, it could be more persistent, resulting in an enduring stretch of subpar economic activity.
An open question is whether the current monetary authority and the current administration have the fortitude to endure this fight. If past experience is any guide the task would be made easier if markets were allowed to operate freely. So, if Jerome Powell is to be the new Paul Volcker, it would be encouraging if one could identify the new Alfred Kahn. Perhaps Germany’s Olaf Scholz is taking up this mantel in Europe. Thumbing his nose at predecessors Gerhard Schroeder and Angela Merkel, the Nord Stream Two gas pipeline is being cancelled. And he is reconsidering scheduled retirements of conventional nuclear and coal fired power plants while vowing to expand natural gas availability and pursuing a reasoned expansion of renewable energy sources.
Such a policy mix would be popular in this country. But to date while the Biden administration promises to expand natural gas exports to help wean Europe away from dependence on Russia, it is doing little to facilitate the expansion of domestic supply. Meanwhile, the administration seems wedded to accelerating a push toward renewables, seemingly oblivious or even supportive of higher prices for fossil fuel as a means of hastening a transition. In the current environment we think a deregulation czar is more appropriate than an inflation czar, but where is the new Alfred Kahn when we need such a person?
Ample supply of feedstuffs and fossil fuel led to relatively stable prices over the past thirty years. This created a sense of complacency which is now being challenged. We suspect food and energy security will be an increasingly important theme as the decade progresses. This would imply a higher level of buffer stocks than was thought normal, and a higher equilibrium price level. Coupled with the absence of the counterweight of deregulation, this could mean that the Federal Reserve may have to stay tighter and for longer than otherwise.
|
Table I Growth Rates for Selected Periods |
Annualized 5-year rates |
||||||||
|
GDP |
Real GDP |
CPI |
CPI Food |
CPI Energy |
WTI Crude Oil |
M2 |
|||
|
1965-1970 |
7.65 |
5.05 |
4.26 |
4 |
2.13 |
2.79 |
6.33 |
||
|
1971-1975 |
9.44 |
2.66 |
6.74 |
8.33 |
10.53 |
27.2 |
9.88 |
||
|
1976-1980 |
11.14 |
3.67 |
8.89 |
7.74 |
15.39 |
27.35 |
9.84 |
||
|
1981-1985 |
8.71 |
3.3 |
5.49 |
4 |
3.37 |
-5.63 |
9.43 |
||
|
1986-1990 |
6.57 |
3.33 |
3.96 |
4.61 |
0.1 |
-2.62 |
5.92 |
||
|
1991-1995 |
5.08 |
2.57 |
3.12 |
2.32 |
0.62 |
-5.53 |
1.99 |
||
|
1996-2000 |
6.06 |
4.31 |
2.47 |
2.49 |
3.43 |
10.46 |
6.14 |
||
|
2001-2005 |
4.93 |
2.55 |
2.55 |
2.59 |
7.29 |
13.26 |
6.41 |
||
|
2006-2010 |
2.91 |
0.98 |
2.23 |
2.86 |
3.63 |
7.06 |
5.71 |
||
|
2015-2020 |
2.79 |
1.12 |
1.78 |
2.3 |
-0.54 |
-4.23 |
7.98 |
||
|
2019-2021 |
3.73 |
1.03 |
2.95 |
3.69 |
5.22 |
9.23 |
17.75 |
||
|
2020-2021 |
10.86 |
5.67 |
4.69 |
3.94 |
20.81 |
73.32 |
16.36 |
||
Source Chart created by author with data from FRED
Chart I
CPI (BLS)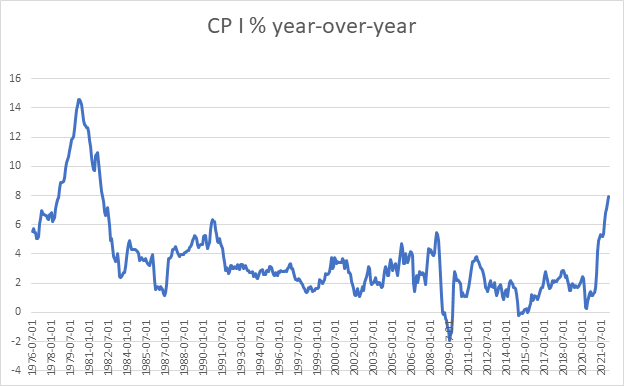
Be the first to comment