

Say-Cheese/iStock via Getty Images
The USDA’s October World Agricultural Supply and Demand Estimates Report told the corn market the outlook for corn is for reduced supplies, increased feed requirements and residential use, lower exports and corn used for the ethanol mandate, and smaller ending stocks. Meanwhile, the USDA said foreign corn inventories declined because of reductions in China and Ukraine, with global stocks at 301.2 million tons, down 3.3 million tons from the September WASDE report.
I reached out to Sal Gilberte, the founder of the Teucrium family of grain ETF products, including the Teucrium Corn Fund (NYSEARCA:CORN), Teucrium Wheat Fund (WEAT), and Teucrium Soybean Fund (SOYB) exchange-traded funds (“ETFs”). Sal’s take on the USDA’s report was:
October’s WASDE report really hammered home the tightness in U.S. grain markets and reemphasized the fact that although the world will produce a record amount of wheat again this year, it will still use more than it produces. Inside the US more wheat will be used than grown for the sixth consecutive year, and more soybeans will be used than grown for the third consecutive year. This year the US will also use more corn than it produces. All the big grain balance sheets are tightening inside the U.S. and the U.S. is the world’s number one corn exporter, the number two soybean exporter, and the number five wheat exporter – and that’s if EU wheat exports are viewed as a single block. As a result of tight fundamentals, prices of all three grains are trading at elevated levels well above their cost of production. History has shown that over time elevated grain prices tend to trade back toward their cost of production, but that is as a result of farmers around the world responding to the higher prices and increasing levels of total production to levels above those of total demand. Until that scenario becomes a reality, it would seem that grain prices and the volatility of grain prices will remain elevated relative to historical norms.
Sal’s comment, “This year the U.S. will also use more corn than it produces,” is bullish, even though corn prices remain at the highest level in years. The Teucrium Corn ETF product moves higher and lower with the coarse grain’s price.
The price action in corn is bullish
Nearby CBOT corn futures reached a low of $3.0025 in April 2020, the lowest price since September 2009. The eleven-year low gave way to a decade high in 2021 and 2022.
Long-Term Corn Futures Chart (Barchart)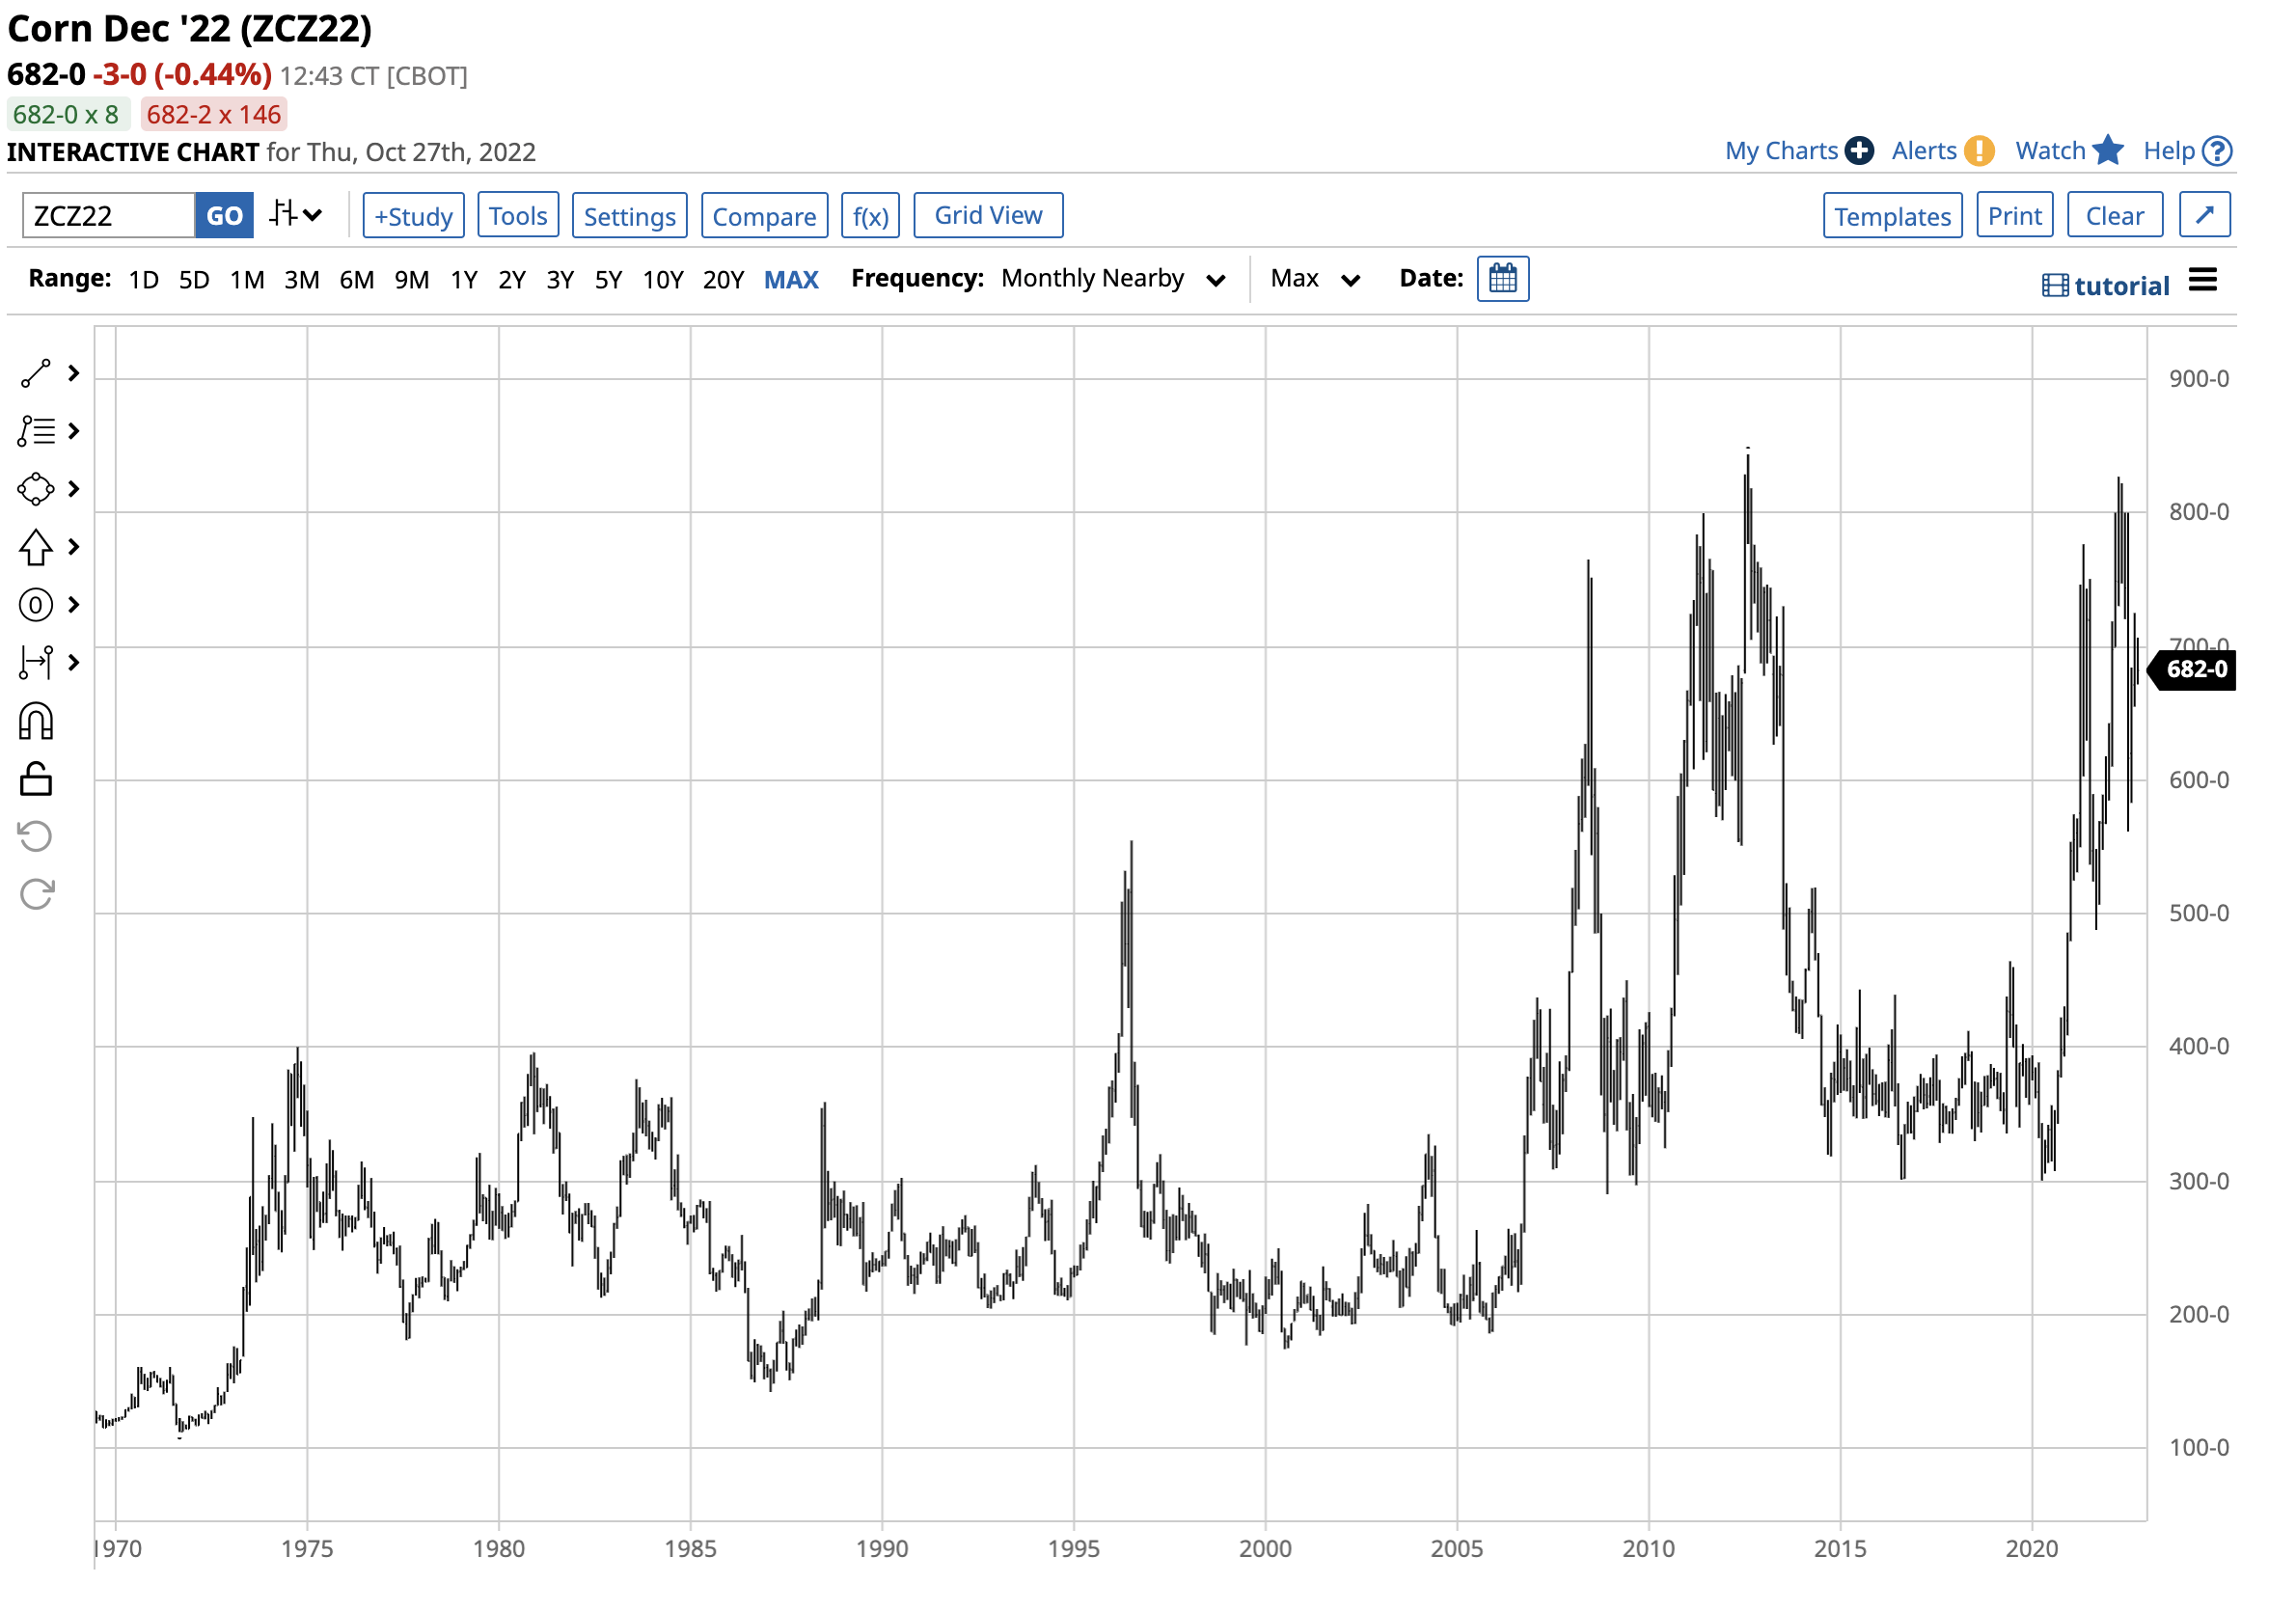
The chart highlights corn futures’ ascent to $8.27 per bushel in April 2022, only 16.75 cents shy of the 2012 $8.4375 all-time high. Corn futures ran out of bullish steam at the $8.27 level and corrected. On October 27, the nearby futures were at the $6.82 level, the highest level since 2013. Despite the correction that took corn futures 17.5% lower than the April peak, the long-term chart shows the trend remains bullish after the 2022 harvest in the Northern Hemisphere.
Corn is food and fuel
Corn is an essential food product that feeds the world. Corn is an ingredient in many of the products we consume daily, but it is also an agricultural product that powers our lives. In the U.S., the ethanol mandate means that each gallon of gasoline that fuels our cars contains gasoline. The U.S. is the world’s leading corn producer and exporter, and refineries process a significant percentage of corn output into ethanol.
While the weather is the leading factor impacting the path of least resistance of corn prices each year, the trends in traditional energy markets can dictate corn’s price path.
Long-Term Gasoline Futures Chart (Barchart)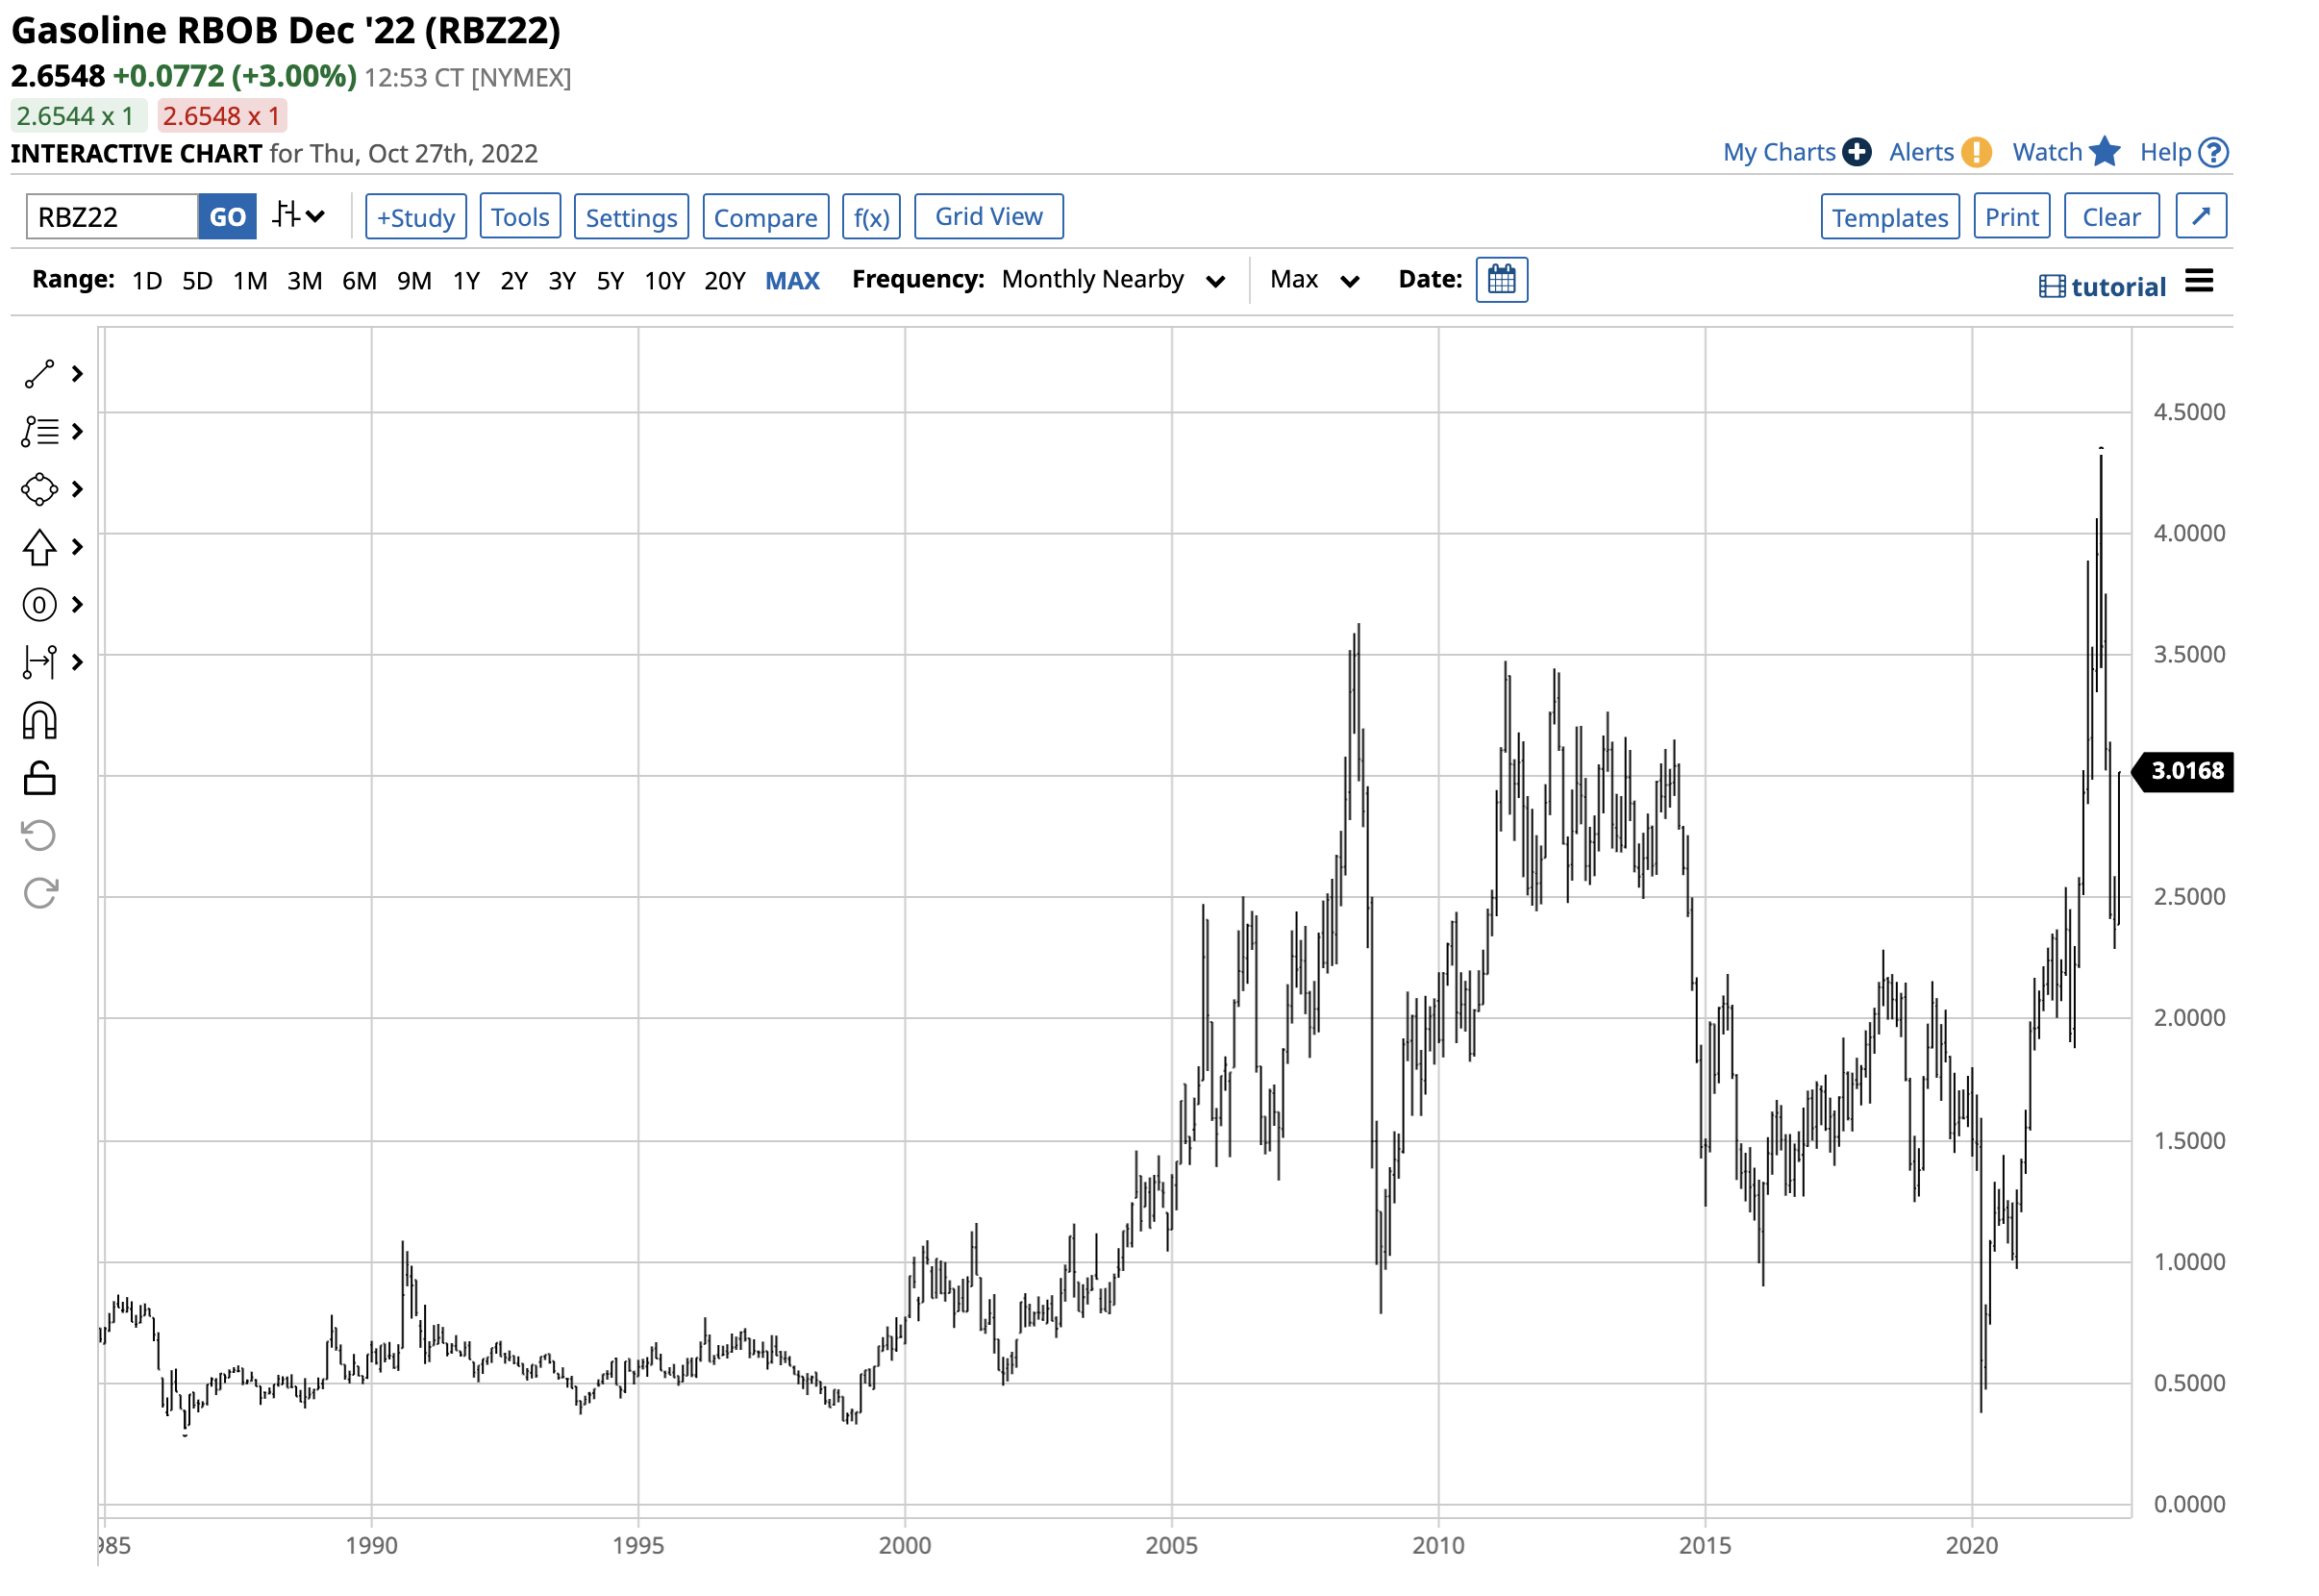
The chart illustrates gasoline prices reached a record peak of $4.3260 per gallon wholesale in June 2022. At the $2.6486 level on October 27, gasoline is at its highest price in October in a decade. The summer is the peak season for gasoline demand during the annual driving season. High gasoline prices support elevated corn prices.
The world’s leaders as the addressable market grows
The U.S. was the world’s leading corn-producing country in 2021, with Ukraine as the sixth top producer.
Global Corn Production in 2021 (Statista)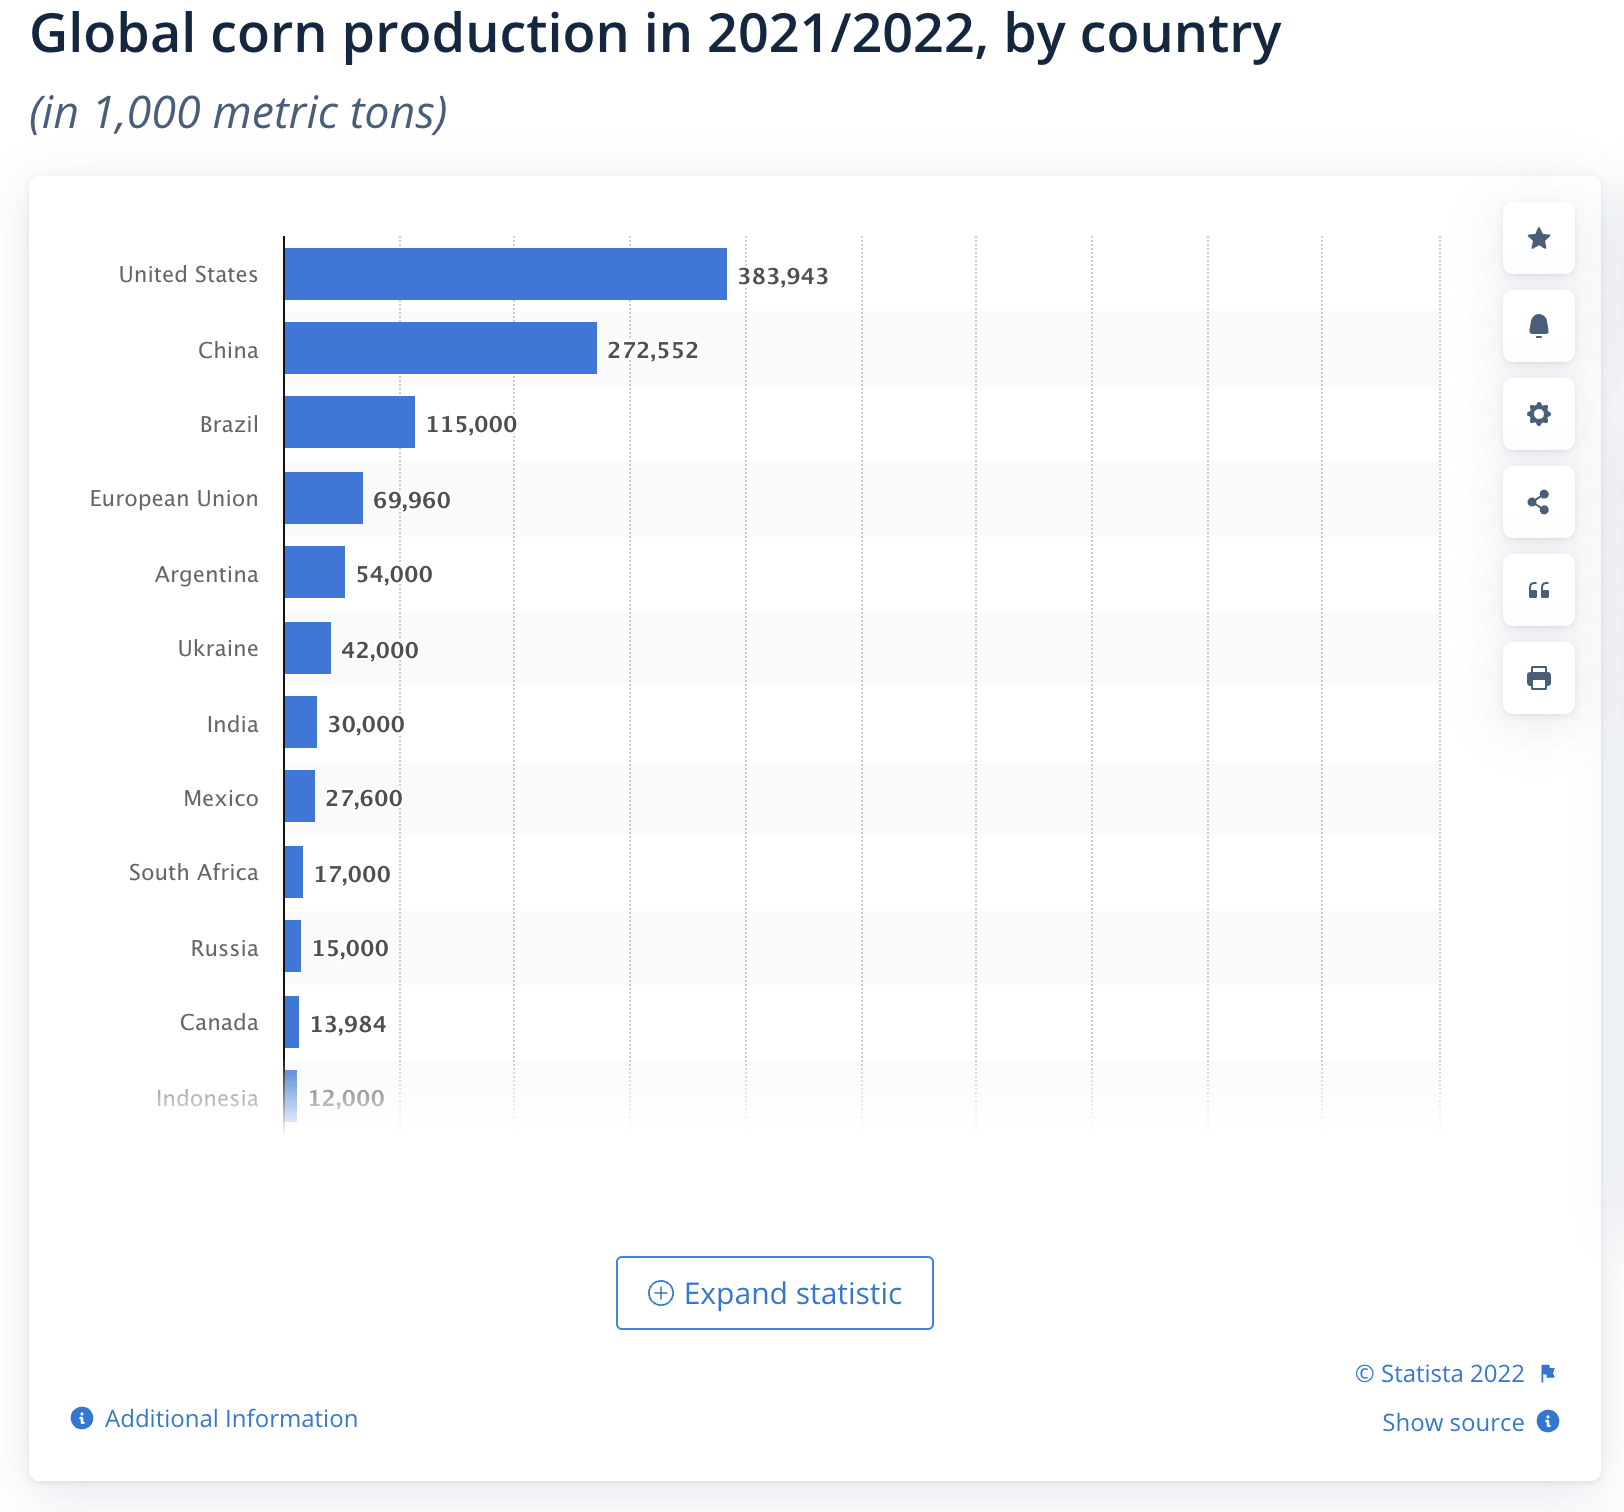
Meanwhile, the U.S. was the leading corn exporter in 2021, with Ukraine the third top exporter, supplying the world with 11.4% of annual exports.
Leading Corn Exporting Countries in 2021 (Wordstopexports.com)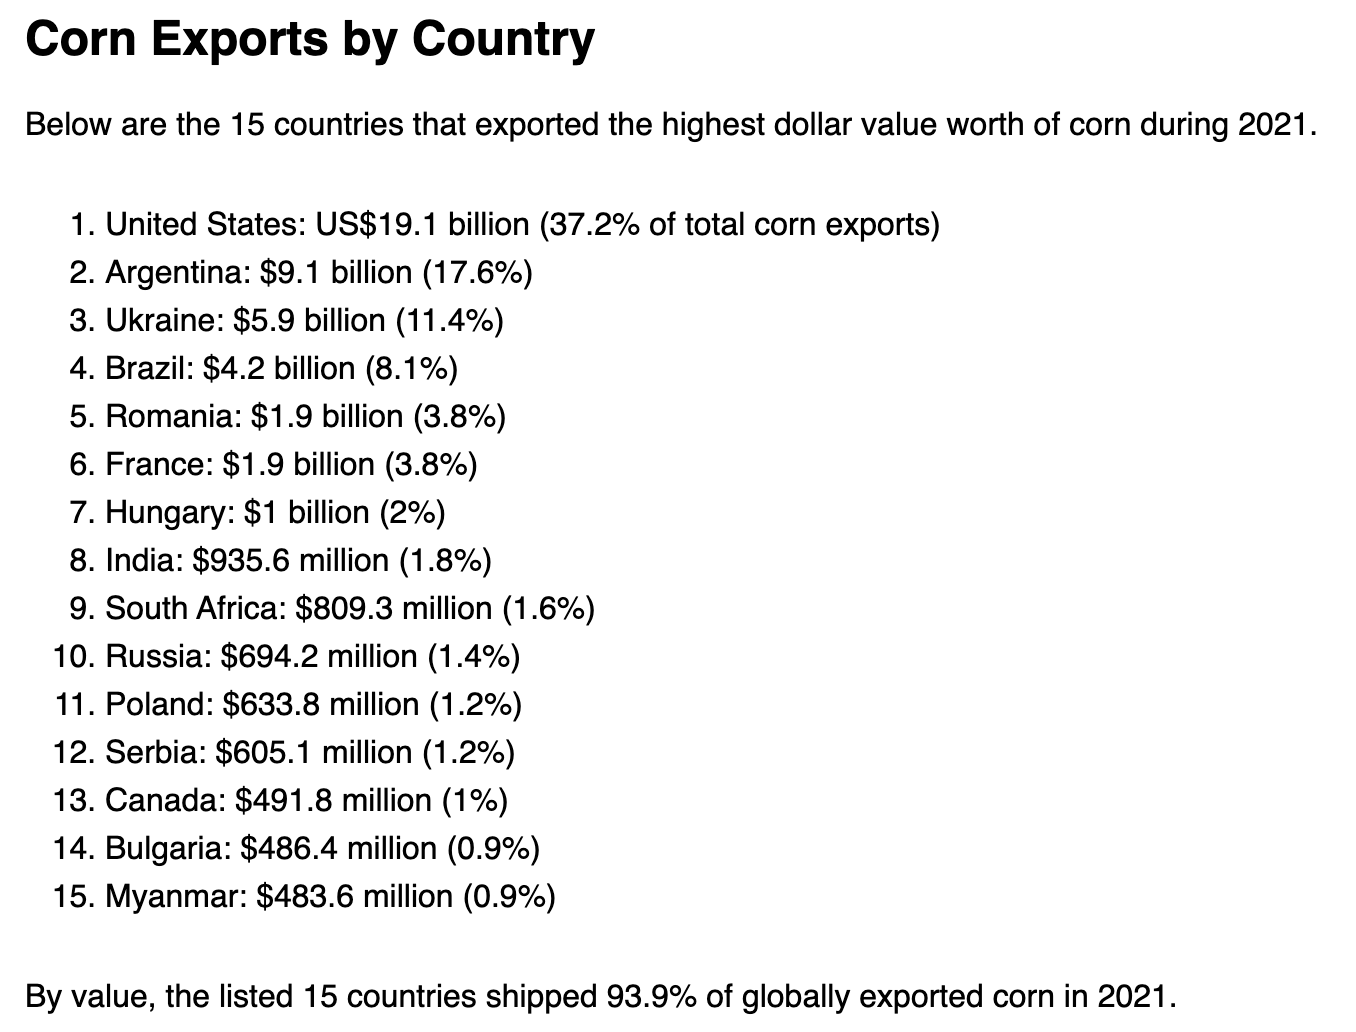
China, Mexico, and Japan were the top importing countries last year.
Leading Corn Importing Countries in 2021 (Statista)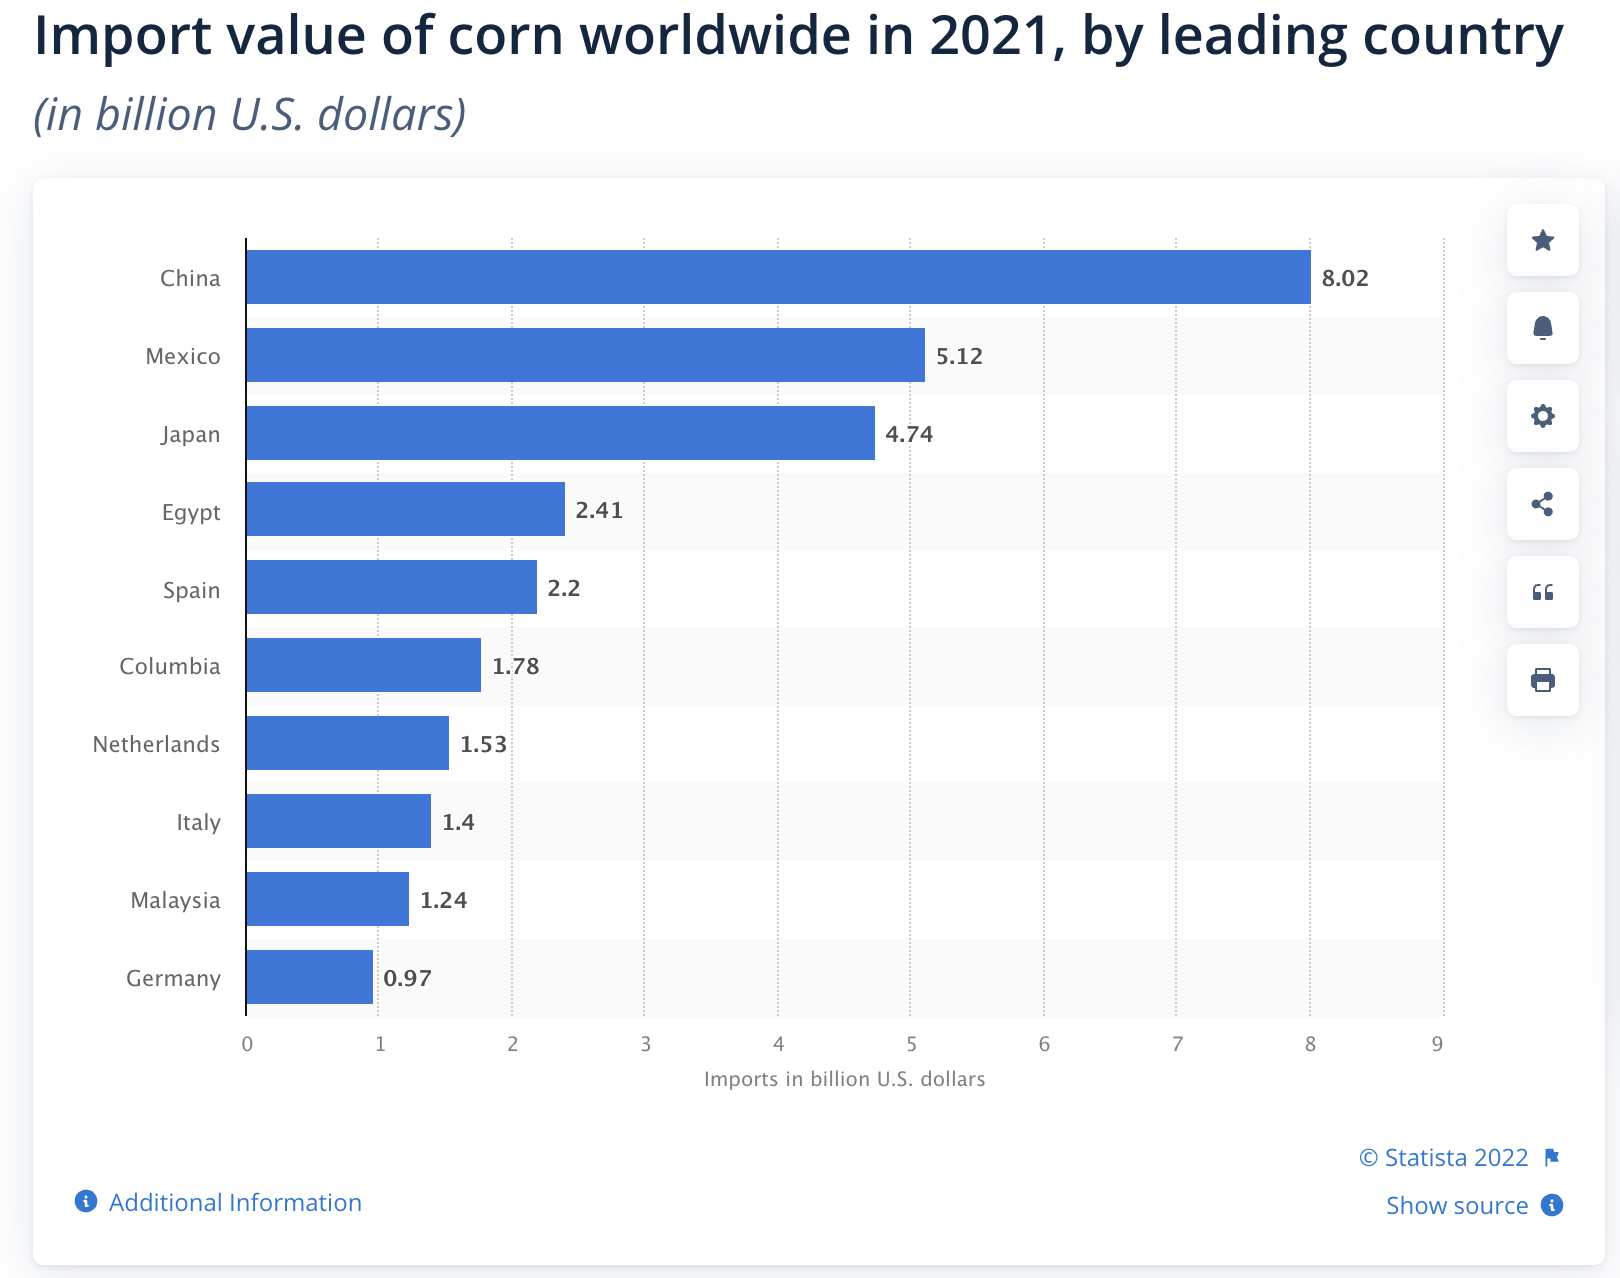
Each year, the world’s population grows, and there are more mouths to feed and lives to power.
Global Population Growth Since 1950 (Macrotrends.net)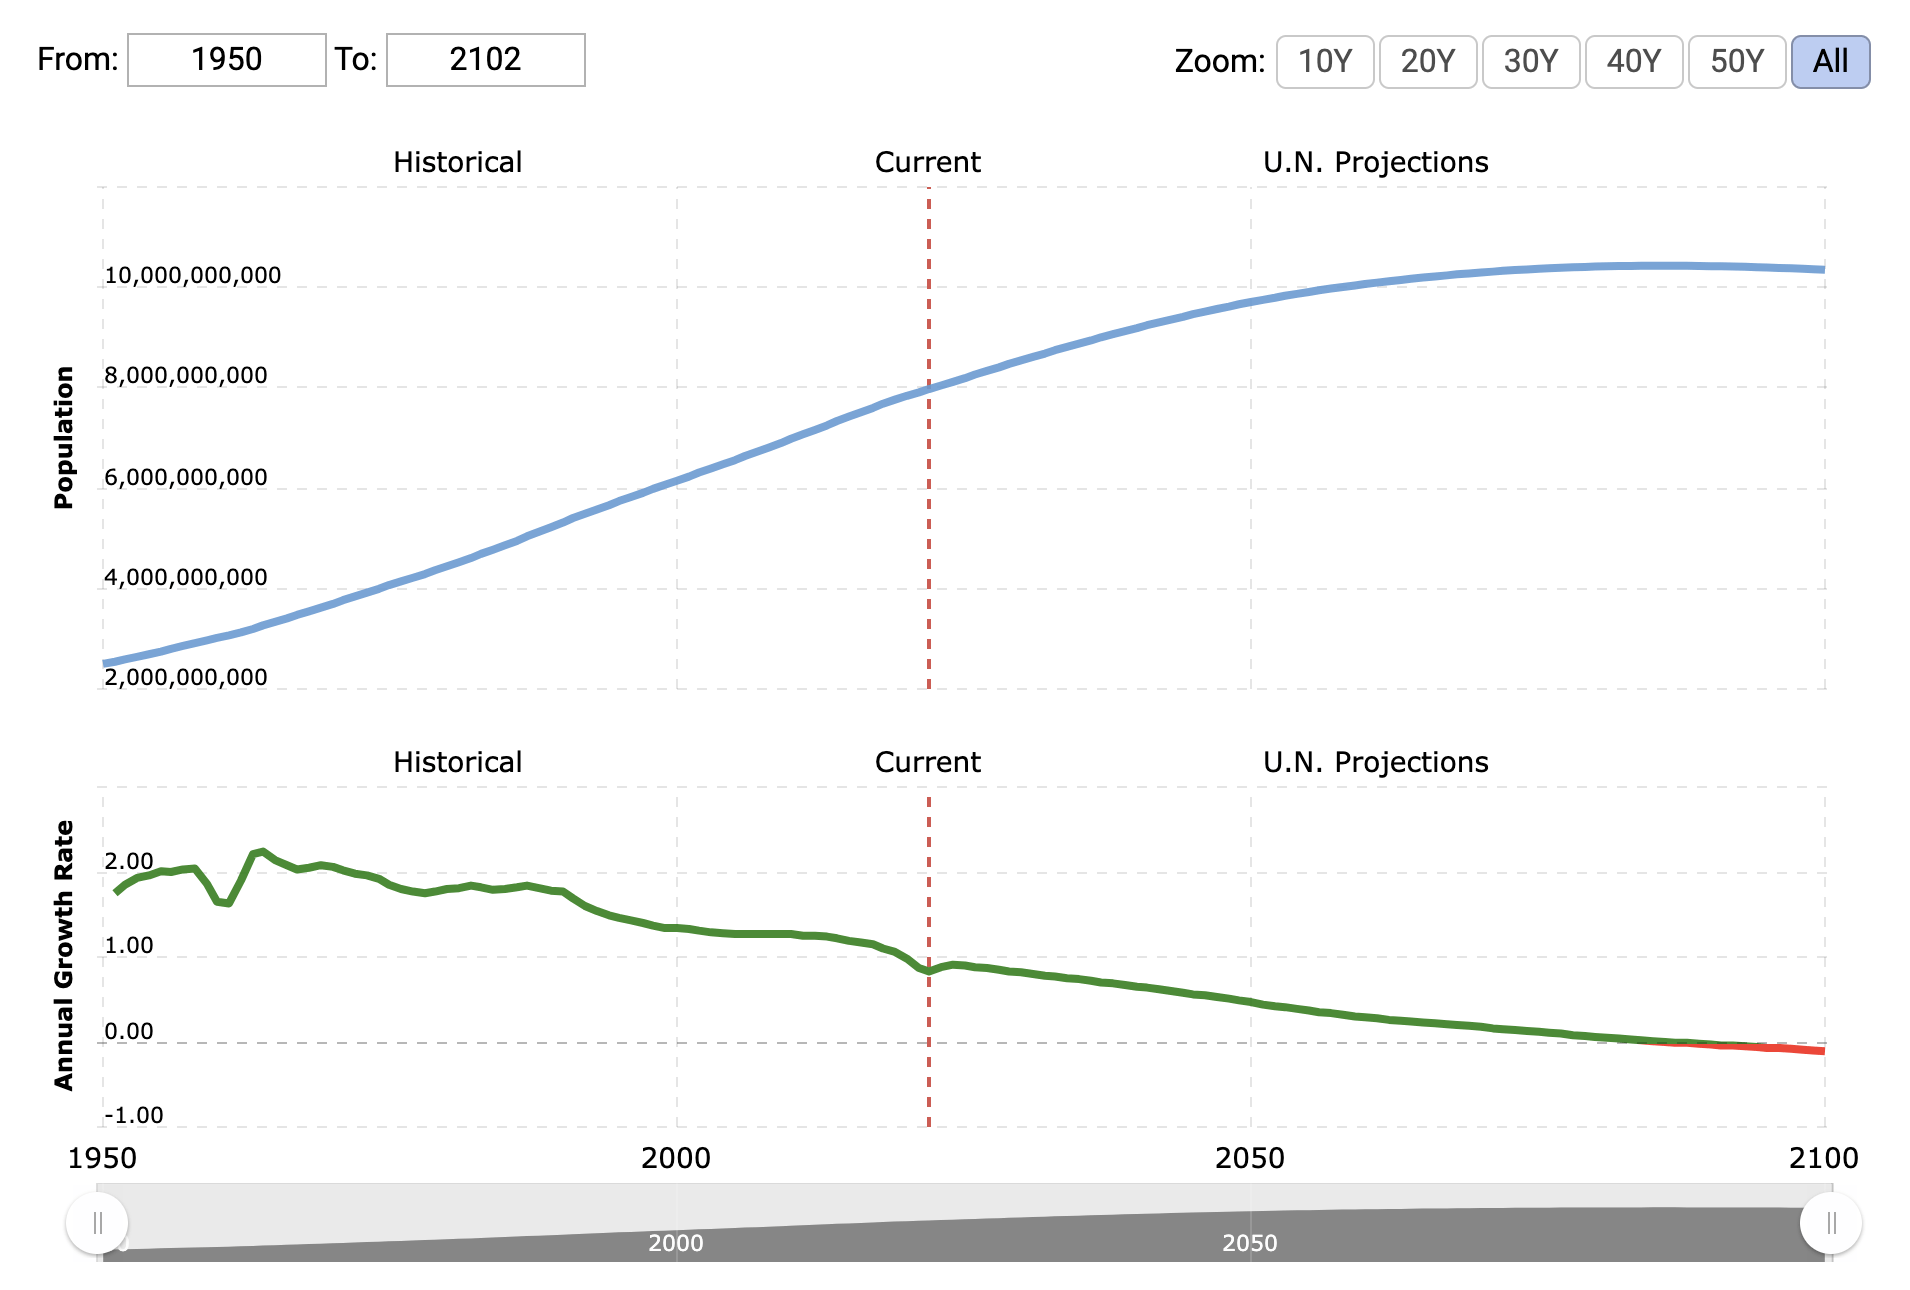
When I was born in 1959, under three billion people inhabited the earth. In 2022, the global population has nearly tripled to over the eight billion level. As the population grows, corn supplies have needed to rise to keep pace with the increasing demand. As Sal Gilberte said, “all the big grains’ balance sheets are tightening.” Corn’s supply and demand fundamentals reflect rising demand, with supplies struggling to meet worldwide requirements.
Corn and the war in Ukraine
In February 2022, Russian troops invaded Ukraine, turning the fertile soil into a battlefield. The Black Sea Ports, a critical logistical hub for corn and other agricultural and commodity logistics, have become a war zone. As Ukraine is the world’s third-leading exporter, the war has put additional bullish pressure on corn’s fundamental balance sheet.
Meanwhile, Russian retaliation to sanctions has caused a shortage of fertilizers, a critical farming input. High energy prices because of the war and inflationary pressures have increased worldwide production costs for corn and all commodities in 2022.
The bottom line is that corn is one of the commodities in the crosshairs of the war in Ukraine. While U.S. prices are at the highest level in years, availability concerns in importing countries are rising, pushing prices even higher.
Corn at above the $6.80 per bushel level on October 27 is at the highest price in years. In 2022, corn did not reach a new record high above the 2012 peak, but the prospects for 2023 remain bullish as the first major war in Europe continues to rage in late October. Corn prices will be sensitive to the weather conditions in the critical growing regions in the Southern Hemisphere over the coming months, but the 2023 crop year will begin in the Spring. If the conflict in Ukraine continues, we will likely see even higher prices next year. Therefore, any price weakness over the coming weeks and months could be a buying opportunity for corn.
CORN is the alternative to futures
The most direct route for investment or a risk trading position in corn is via the futures and futures options on the CME’s CBOT division. The Teucrium Corn ETF product CORN provides an alternative for those looking for corn exposure without venturing into the futures arena. CORN’s fund summary states:
Fund Summary for the CORN ETF Product (Barchart)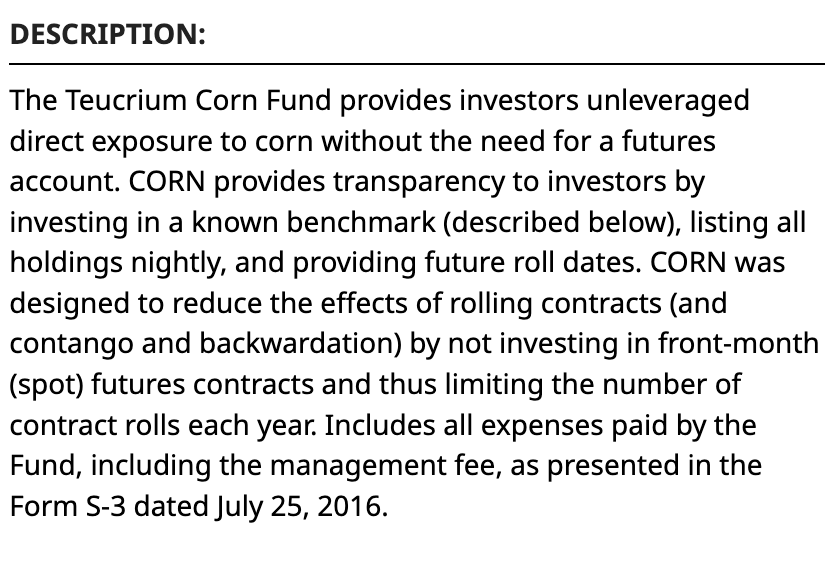
CORN holds three actively traded CBOOT corn futures contracts, reducing roll risk when the active month contract expires. Since CORN owns a blend of three contracts and most volatility occurs in the nearby contract, CORN tends to underperform the nearby corn futures on the upside and outperform during price corrections. At $27.18 per share, CORN had $215.832 million in assets under management and trades an average of over 201,000 shares daily. CORN charges a 1.14% management fee. Nearby corn futures rose from $3.0025 in April 2020 to $8.27 in April 2022, a 175.4% rise. The price corrected by 17.5% to $6.82 on October 27, 2022.
Chart of the CORN ETF Product (Barchart)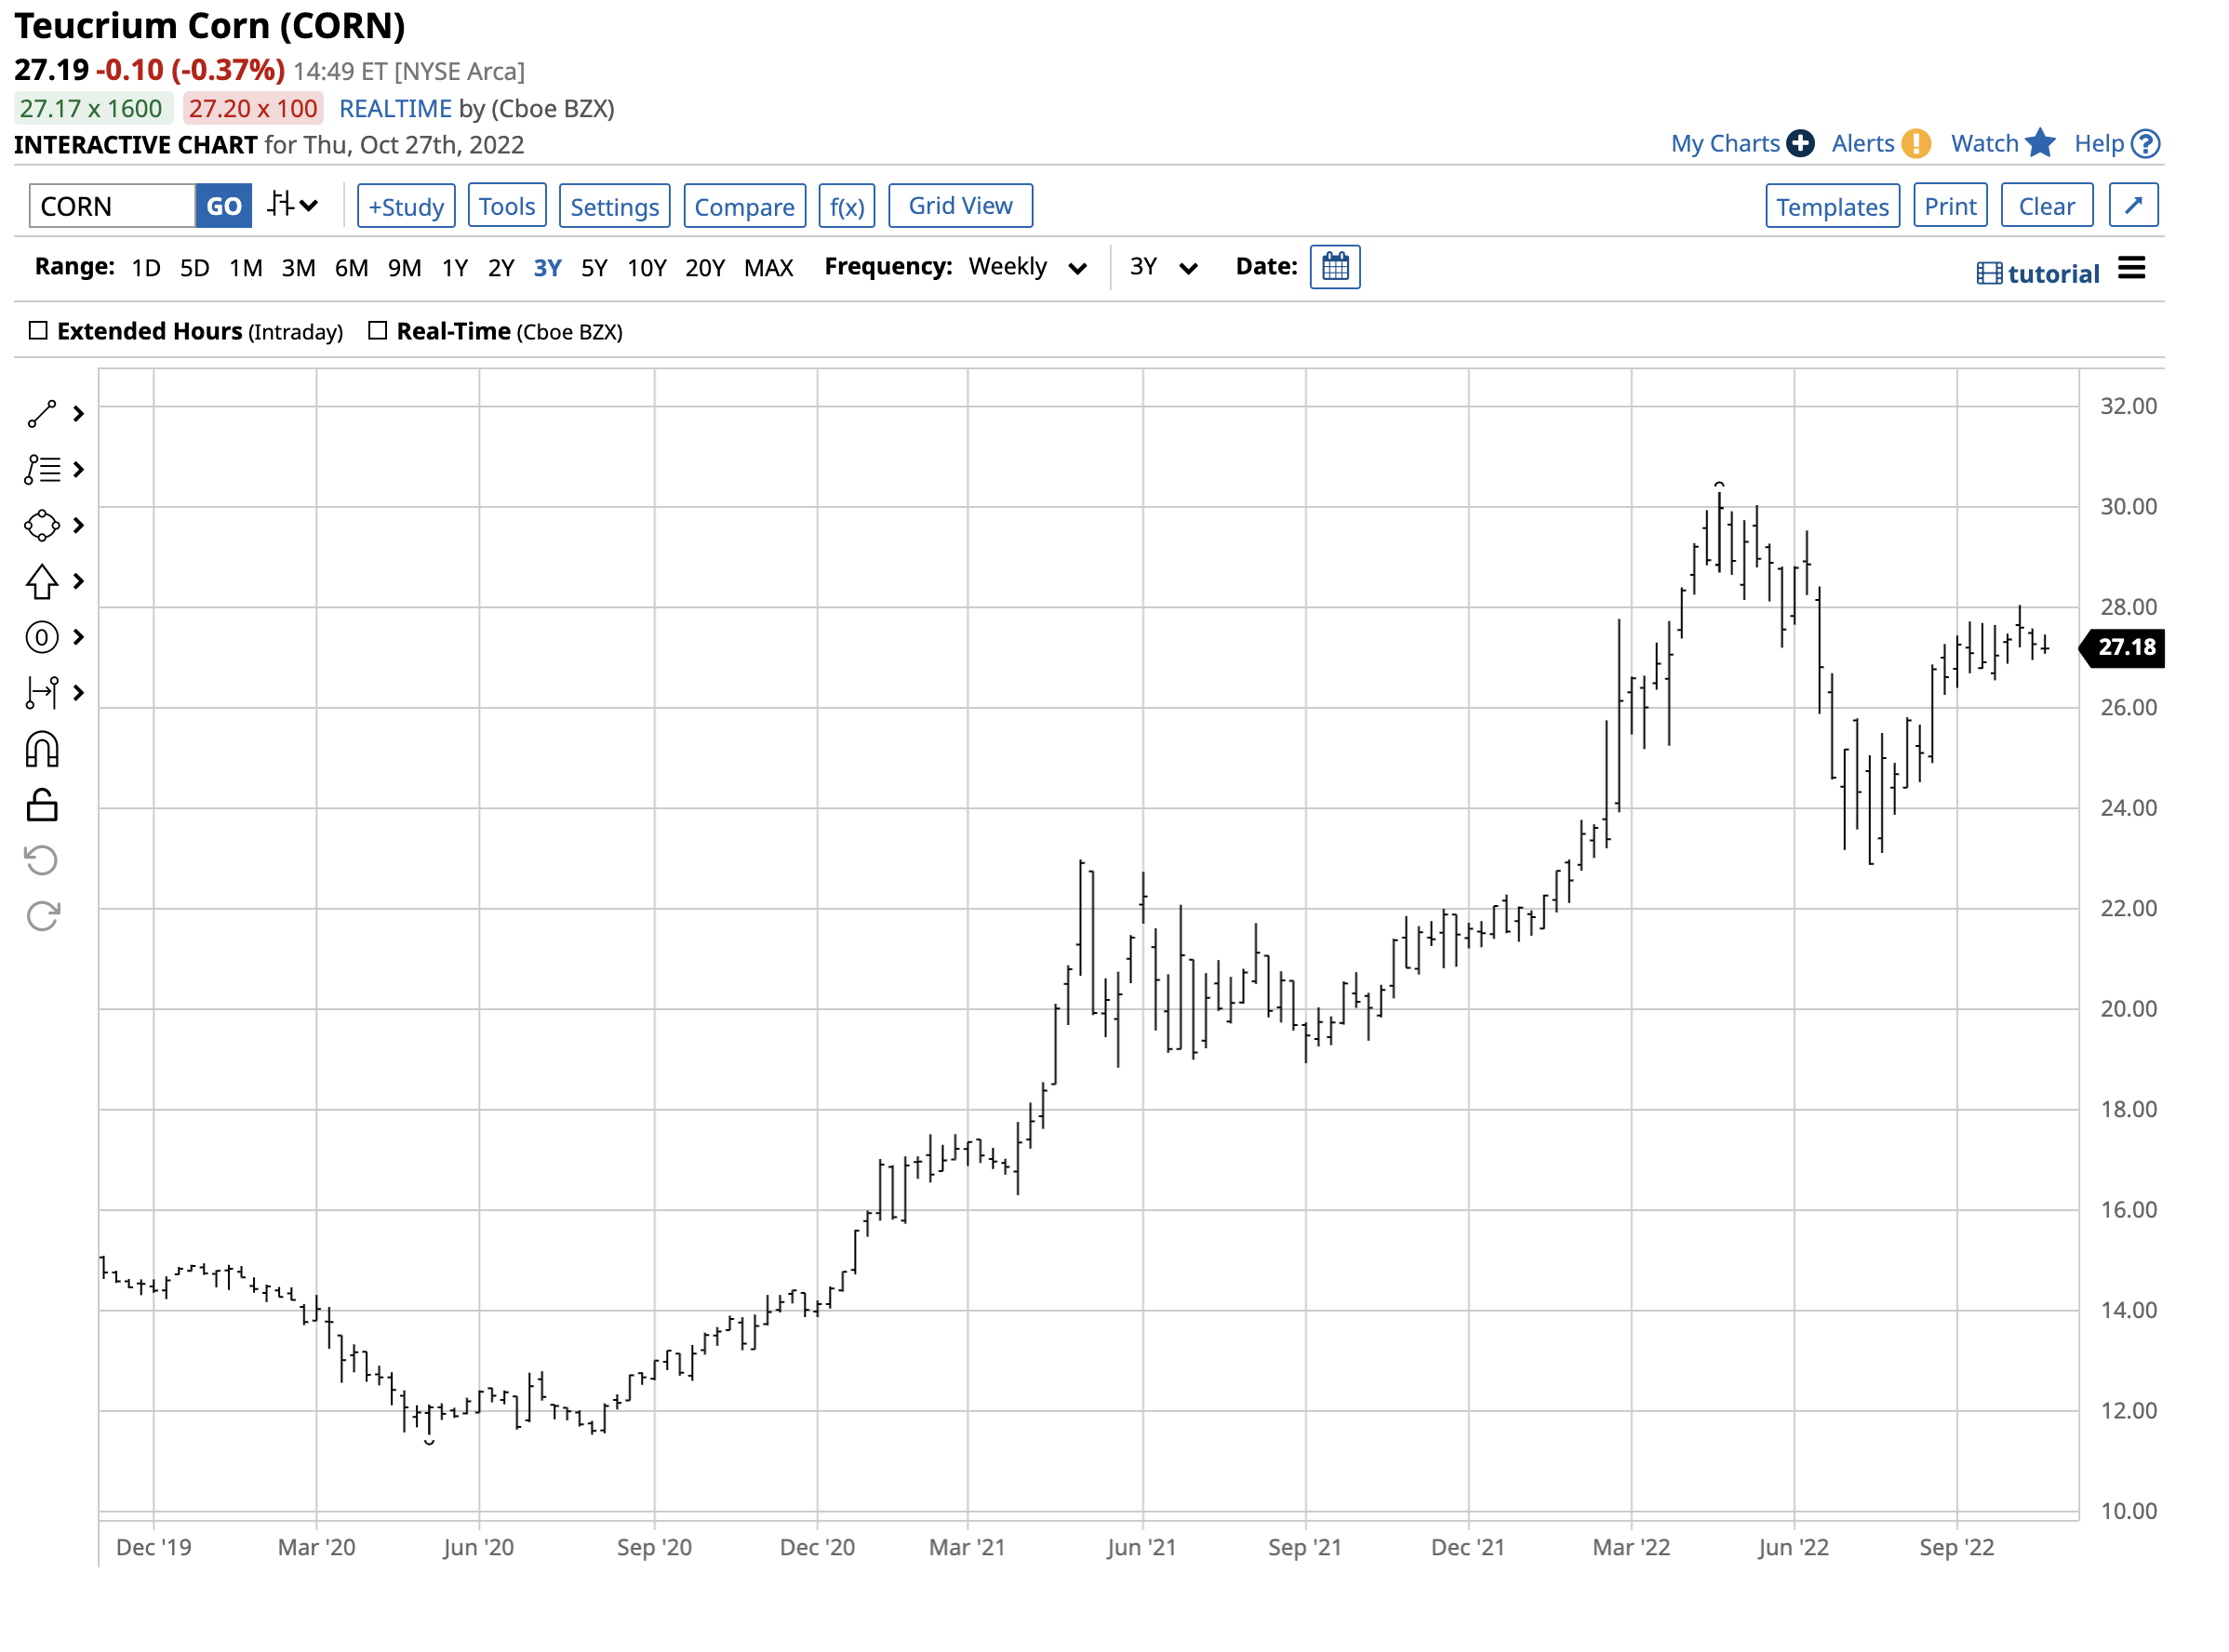
Over the same period, CORN rose from $11.52 to $30.30 per share, or 163%, before correcting 10.3% to $27.18 per share on October 27. The unleveraged CORN ETF product underperformed on the upside but outperformed during the most recent correction.
I remain bullish for corn’s prospects for the coming months and into the 2023 crop year. I am a buyer of corn futures and the CORN ETF at the current price level, leaving plenty of room to add to long positions if the price drops. It is impossible to pick bottoms in any market, and corn is no exception. However, the tightening balance sheet, inflationary pressures, and ongoing war in Ukraine are bullish for the coarse grain in October 2022.
Be the first to comment