

onurdongel/iStock via Getty Images
You pay a great deal too dear for what’s given freely.”― William Shakespeare, The Winter’s Tale
Today, we take an in-depth look at a retailing concern that looks cheap on a variety of metrics after a steep fall in the stock. The shares have also picked up some recent insider buying as well. A full analysis follows below.
TCS – Stock Chart (Seeking Alpha)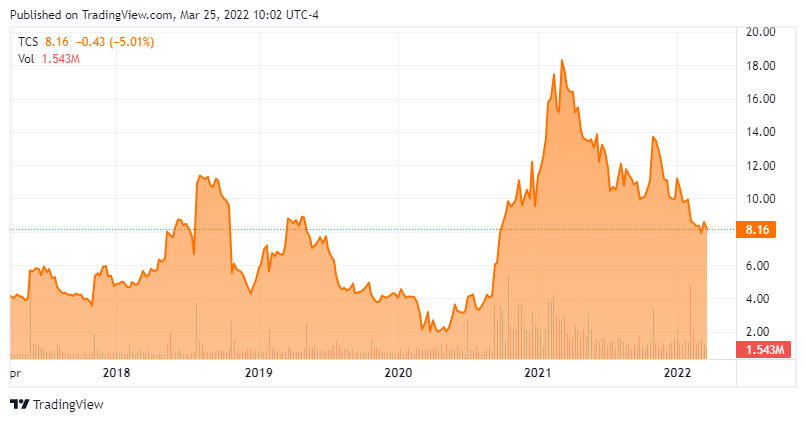
Company Overview:
The Container Store (NYSE:TCS) (hereafter “TCS”, “the retailer”, or “the company”) is a Dallas based specialty retailer focused on providing customers with storage and organizational solutions in ~30 countries. Domestically, the company operates 94 stores in 33 states and the District of Columbia and is the only major concern dedicated solely to the category. TCS was founded in 1978 and went public in 2013, raising net proceeds of $205.8 million at $18 per share. Its stock currently trades just above $8.00 a share, equating to a market cap of $405 million.
The retailer operates on a fiscal year ending the Saturday closest to March 31st and refers to the year ending April 2, 2022, as FY21.
Reporting Segments
It has two operating segments: The Container Store and Elfa.
The Container Store houses the 94 domestic retail storefronts (with an average size of ~25,000 sq. ft.) and attendant call center, its web and mobile sites, as well as its custom closet installation business. The retail locations are supplied from two distribution centers in Texas and Maryland. This division is responsible for the preponderance of the company’s top line, accounting for $736.7 million during the nine months ending January 1, 2022 (YTDFY21), or 93% of total.
Elfa is the retailer’s wholly owned Swedish subsidiary, which it purchased in 1999. It manufactures component-based shelving and drawer systems, as well as made-to-measure sliding doors out of facilities in Sweden and Poland. The Container Store segment is the exclusive distributor of Elfa in the U.S. and this arrangement provides the former with its most popular and highest margin products. Elfa also sells its merchandise to retailers in ~30 countries with most of its ex-U.S. revenue derived from the Nordic region. It generated revenue of $51.8 million in YTDFY21, or 7% of total.
Unique Niche
Besides the fact that it is the only company devoted exclusively to storage and organization solutions, there are two delineating characteristics that set TCS apart from its competition. The first is its custom closet business, which includes design, customization, products, and installation. Custom closets account for approximately half of the company’s top line. The second is the sheer range and depth of category offerings that the retailer provides, amounting to north of 11,000 SKUs sourced from over 650 vendors.
Marketplace
Although the only one committed entirely to the category, TCS participates in a $20 billion plus global storage and organization vertical (which includes custom closets), meaning it has only achieved 5% penetration and less than 10% of the ~$6 billion custom closets market. Competitors include offerings from Bed Bath & Beyond (BBBY), The Home Depot (HD), Lowe’s Companies (LOW), Target (TGT), and many regional non-public companies.
Trading History
Shares of TCS opened with a bang in 2013, trading $17 above its IPO price on its inaugural public transaction, subsequently piercing $47 a share near the end of that same year. Even though the company increased its store count by ~50%, reduced its debt over 40% to $196.6 million (lowering its leverage from 3.9 to 1.1), and became profitable on a GAAP basis in the intervening years, its stock has been more or less a bust, spending the preponderance of 2016-2019 trading in the single digits, before nadiring below $2 during the pandemic-induced selloff of March 2020. The slow collapse of its share price was a function of the fact that investors were expecting the capital from its IPO to initiate a rapid store expansion to further penetrate its large untapped market opportunity and that did not materialize. At its peak in 2013, shares of TCS were trading at price-to-sales ratio of ~3.0, but when the company only grew its top line at a 3.4% CAGR during the following six years by only increasing store count at an 8.4% CAGR – with only four new locations since March 2018 – investors betting on growth walked away. At its nadir in March 2020, its stock was trading at ~0.1 price-to-sales.
Attitudes changed when the retailer was rightly perceived as a beneficiary of the stay-at-home dynamic and Covid-19 relief payments during the pandemic. It also benefitted from the launch of Netflix (NFLX) series Get Organized with The Home Edit in September 2020. As such, its stock rebounded ~900% over the next year, peaking just below $20 a share in March 2021. With that said, sales were only up 8% in FY20 (ending April 3, 2021) versus FY19, partly due to temporary store closures in 1QFY20.
Opinions reversed again, with the market seeing the pandemic undercurrents as simply a pull-forward of demand, and the stock drifted back to the low double digits.
During 1HFY21, these concerns seemed unfounded, as the company earned $0.89 a share versus $0.11 a share (both non-GAAP) in a somewhat pandemic-impacted 1HFY20, while growing its Adj. EBITDA 68% to $81.3 million on a 30% jump in revenue to $521.3 million.
3QFY21 Earnings & Outlook
However, the bearish viewpoint gained validity when TCS released 3QFY21 earnings on February 8, 2022. It wasn’t the report itself but rather the outlook for 4QFY21 that emboldened the naysayers. The retailer announced non-GAAP EPS of $0.28 and Adj. EBITDA of $31.4 million on consolidated net sales of $267.3 million, with the bottom line beating the Street consensus by $0.07 a share and the top line better by $5.3 million. That said, all three metrics were markedly lower versus their 3QFY20 comparators, when the company reported $0.42 a share (non-GAAP) and Adj. EBITDA of $42.4 million on revenue of $275.5 million, representing year-over-year declines of 33%, 26%, and 3%, respectively.
3rd Quarter Results (February Company Presentation)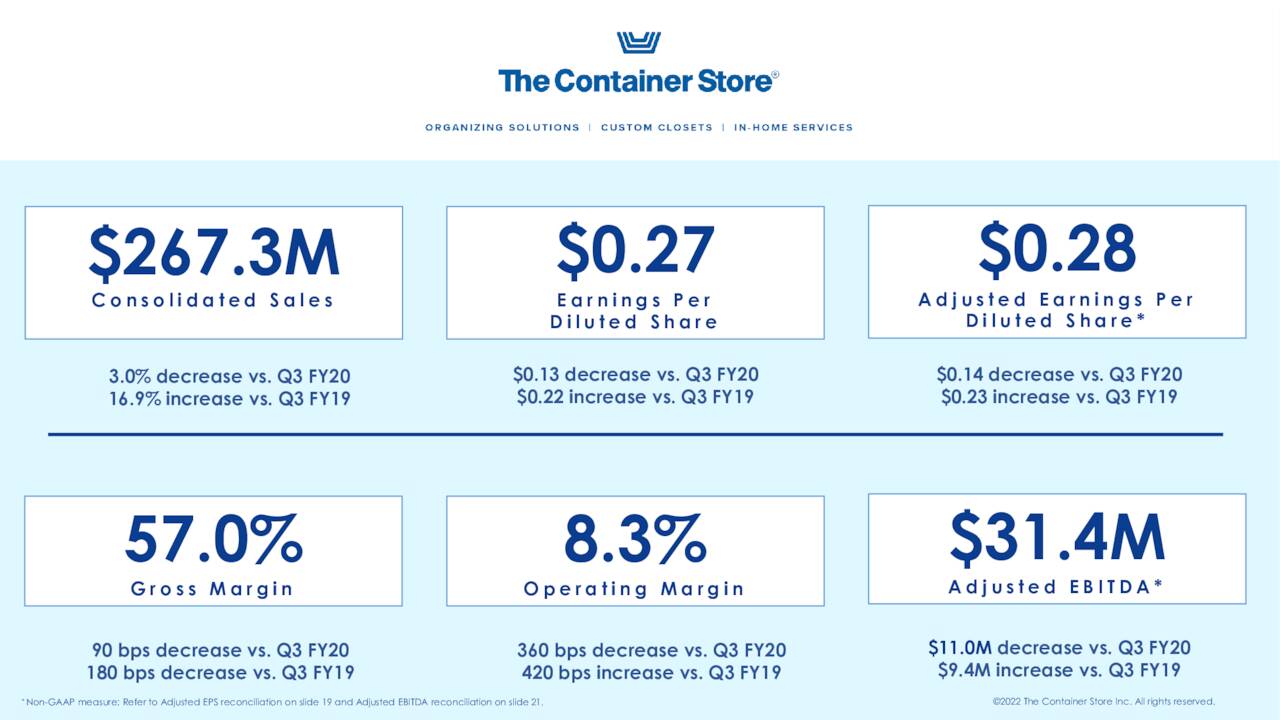
Management’s 4QFY21 outlook of $0.24 a share (non-GAAP) represented a 66% decline versus the prior year period and was $0.06 below Street consensus. Its revenue estimate of ~$280 million represented an 11% decline versus 4QFY20 (6% when giving effect to the prior year’s 14-week quarter).
Fourth Quarter Guidance (February Company Presentation)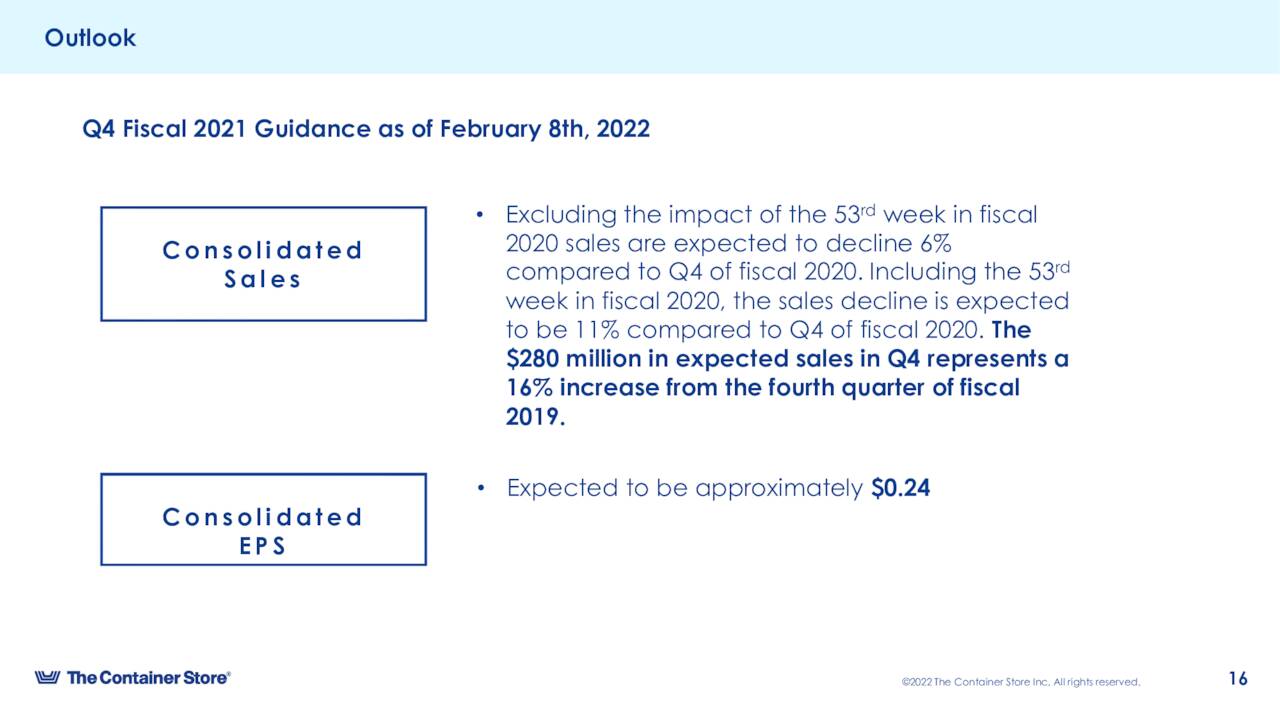
Pandemic related headwinds such as increased freight and commodity costs in its Elfa segment were blamed and management thought the better approach to interpreting the company’s results was versus those posted in FY19. That line of thinking appears more logical for a company whose financial performance was negatively impacted by the pandemic and is trying to demonstrate that its growth trajectory is resuming, not one that has benefitted and is trying to rationalize that despite its [NOW] two quarters of decline, it is still better than it was two years ago.
Closet Works Acquisition (February Company Presentation)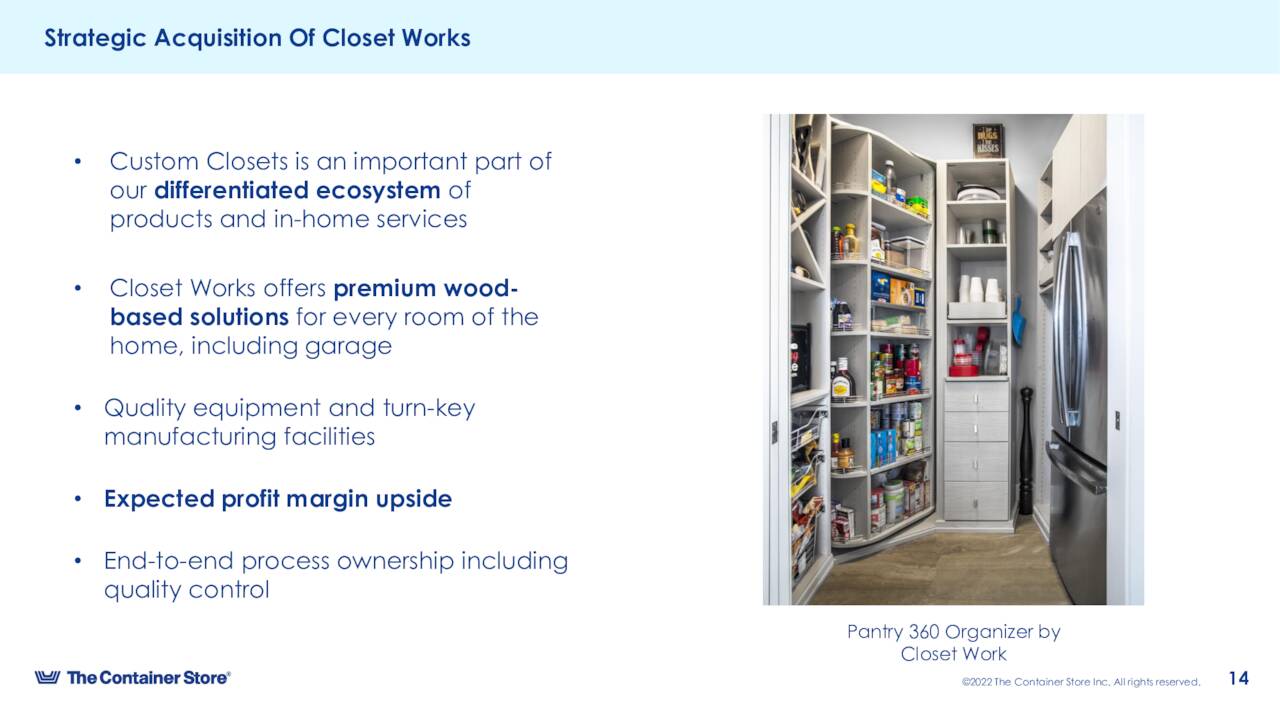
On a positive note, TCS said robust demand in its custom closets business compelled it to acquire Closet Works, a manufacturer of premium custom wood-based spaces, including walk-in closets, wine storage, etc., for a consideration of $19.4 million net of cash acquired in FY3QFY21.
Management also stated its intention to become a $2 billion company in the future with more than 200 brick-and-mortar locations, but a detailed roadmap was not provided.
Instead, the market chose to focus on the company’s 4QFY21 forecast, knocking its stock down 23% to $8.13 a share in the subsequent trading session, the shares have rebounded a tad since then.
Balance Sheet & Analyst Commentary
If TCS decides to move forward with a meaningful expansion plan, it is in a solid capital position to do so with a leverage ratio of 1.1. As of January 1, 2022, the retailer held cash of $19 million against debt of $198.7 million with $76 million of additional liquidity available from two lines of credit. It generated cash from operating activities of $17.9 million in YTD21. These metrics bely its strong cash position as it built inventory by $66 million (51%) during the period.
The retailer is underfollowed and unloved by Street analysts. Goldman Sachs upgraded it from sell to hold in November 2020, raising its price target from $3 to $10. JP Morgan maintained its Sell rating and $12 price target in Mid-February. Although quiet on commentary, analysts currently expect TCS’s FY23 bottom line to decrease 15% to $1.23 a share (versus FY21E of $1.45) on a flat top line of $1.07 billion.
By contrast, CEO Satish Malhotra is staunchly in the bull camp based on his February 10, 2022, post-earnings purchase of 24,355 shares at $8.17, raising his position in the company to over 185,000.
Verdict
Until the retailer wades through and eventually turns the corner on negative comparisons, it will have a difficult time convincing investors that it is nothing more than a flat-to-low single digit organic grower at its top line. And inflationary headwinds will certainly hinder the retailer’s ability to sell itself as a bottom line grower.
As such, its stock trades at a price-to-FY21E (and FY22E) of under 0.4, an EV-to-EBIDTA of 3.2, and a price-to-FY22E earnings of 6.5. These are values that should put a floor under shares of TCS, but they don’t have much upside until management can change Street perceptions about its growth prospects. As such, the recommendation is to remain on the sidelines.
Forgotten wisdom is the knowledge of failure.”― Anthony T. Hincks
Bret Jensen is the Founder of and authors articles for the Biotech Forum, Busted IPO Forum, and Insiders Forum
Be the first to comment