

Edwin Tan
After a stronger-than-expected June retail sales report and ahead of key back-to-school shopping season data, investors are eager to know how the consumer is faring amid this inflationary yet exceptionally low unemployment environment. There are only a handful of companies that report monthly same-store sales interim data anymore, but among them is The Buckle (NYSE:BKE).
The Buckle, Inc. operates as a retailer of casual apparel, footwear, and accessories for young men and women in the United States. It markets a selection of brand-name casual apparel, including denim, other casual bottoms, tops, sportswear, outerwear, accessories, and footwear, as well as private label merchandise, according to Fidelity Investments. BKE pays a very high 4.8% dividend yield and the stock features an elevated short interest ratio of 13.8%, according to The Wall Street Journal.
With a high payout rate and the ongoing possibility of a short squeeze, if positive news comes out of The Buckle, there’s reason to like this stock after its major decline. The valuation picture is also compelling. I researched and found that BKE’s forward price to earnings multiple is near its all-time lows, under 6-times next year’s earnings. Of course, we do not know for sure how the coming four quarterly reports will verify.
BKE Forward P/E Ratio: Hovering At All-Time Lows
Koyfin Charts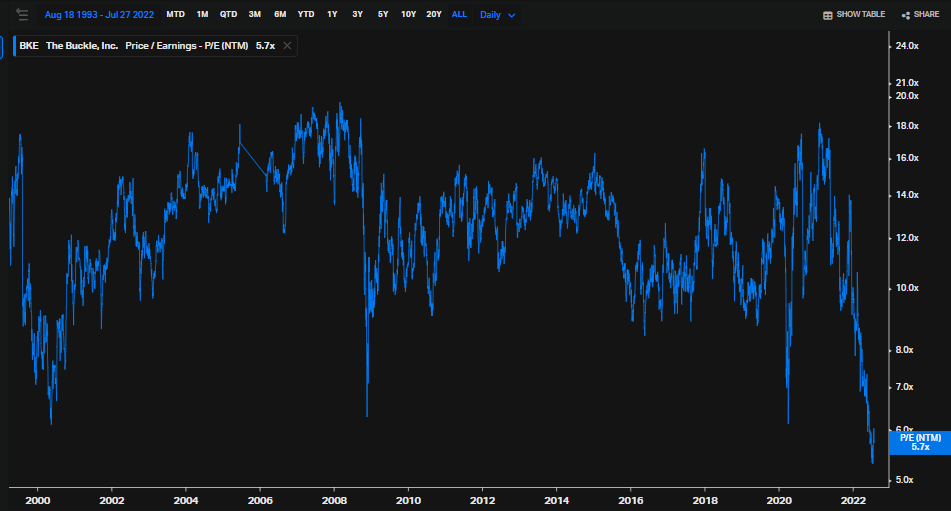
Along with July same-store sales expected to hit the wires on August 4, the company’s Q2 earnings date is confirmed for Friday, August 19, BMO, according to Wall Street Horizon. We will have good clues on demand for apparel after that retail-heavy week of earnings. Analysts expect $0.90 of EPS in BKE’s upcoming report.
The Buckle Corporate Event Calendar: July SSS and Quarterly Earnings On Tap
Wall Street Horizon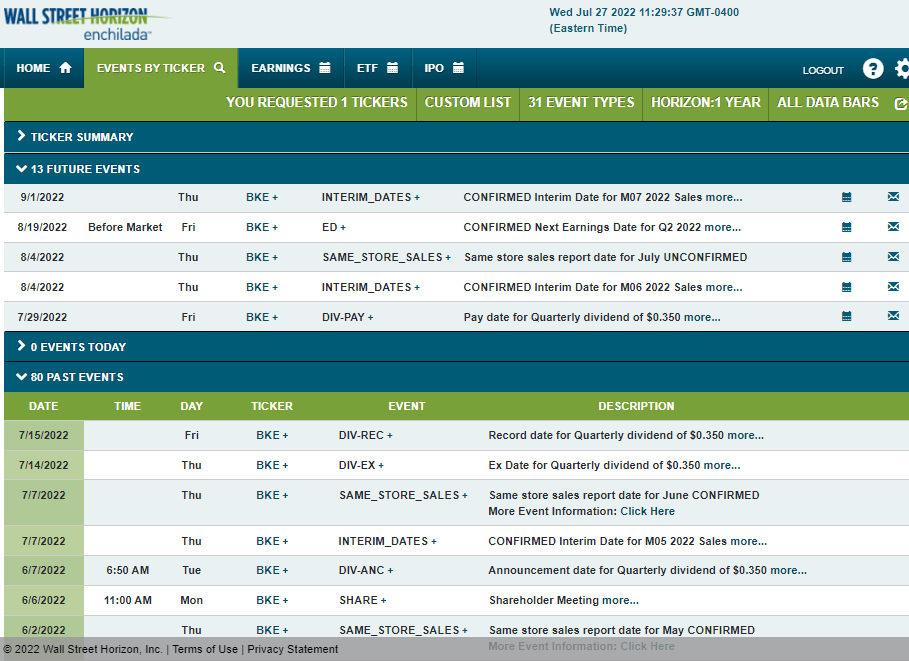
Digging in further at the earnings picture, BKE has a strong history of beating analyst estimates. Data from Fidelity Investments show the last nine EPS figures have come in ahead of analyst expectations. ORATS, an options research and technology firm, reports that the upcoming August earnings report has an implied stock move of plus or minus 7.9% based on the nearest-expiring at-the-money straddle.
An Impressive EPS Beat History
Fidelity Investments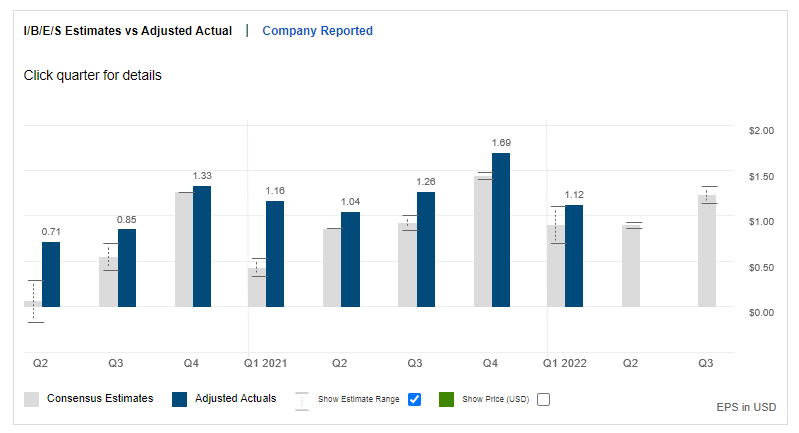
The Technical Take
With a cheap valuation, high yield, and strong earnings beat rate trend, the chart also looks favorable from a risk/reward perspective.
In the chart below, the $26 level has held on three recent tests since May, and long term, that area has been significant. It was resistance from 2016 through 2019 before climbing above it in late 2020. After a more than 50% drawdown off the $57 high last year, it is back to the ‘scene of the crime.’ A long position here makes sense with a stop under $25.
On the upside, look for a first target near $34. Next resistance is around $38 followed by an old unfilled gap at $48.
BKE Pulls Back To Key Long-Term Support
Stockcharts.com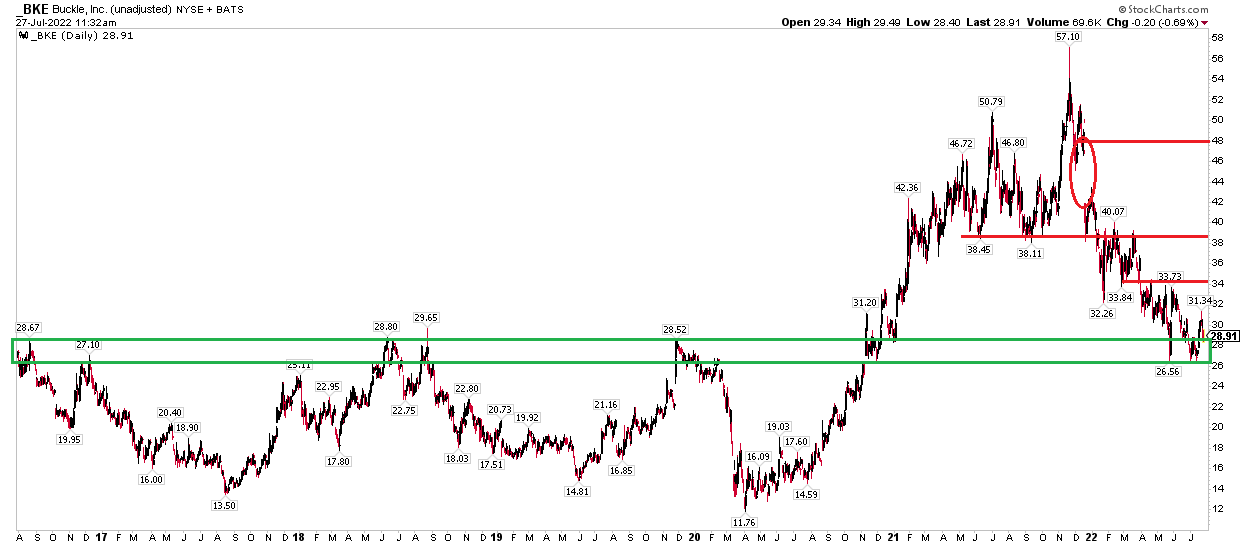
The Bottom Line
Long-term investors should consider ‘putting on’ some shares of the apparel company The Buckle. The stock is downright cheap here, and it boasts a high yield. Technical traders can use the $26-$29 support area to get long with a stop below $25, targeting at least $34. We’ll get two key reports in the next few weeks as to how BKE’s earnings are evolving.
Be the first to comment