

ismagilov
In today’s issue of the 1-Minute Market Report, I examine the market rally since the October low and highlight the areas of the market that are leading the way higher.
Today has significance for two reasons. It marks the end of November, and it was a rare 3% up day. These 3% days only come along only 0.3% of the time, and we should take note of them because they usually, but not always, signify that better days lie ahead. On average, these big up days are followed by a 10% rally over the next 6 months. Over 12 months, the market produces an average gain of 20%.
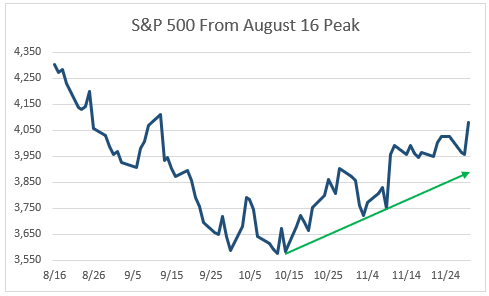
The bounce
This chart highlights the 14.1% bounce from the October 12 low through today’s close. This is the strongest rally we’ve seen since the 17% move from June 16 to August 16.
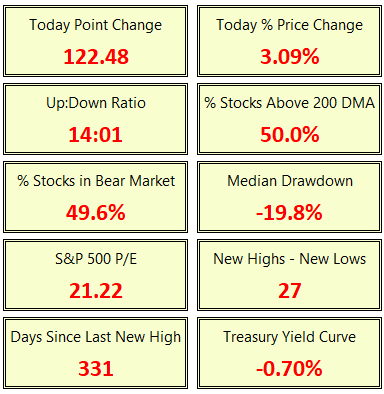
The market stats
Here is a look at the stats for today, November 30. For every stock that was down, there were 14 that were up. For the first time since May, less than half of all stocks are in a bear market, with the median drawdown at -19.8%.
There are now more stocks making new highs than new lows. And half of all stocks are above their 200-day moving average.
On the negative side, the market P/E has risen to 21.22 and the Treasury yield curve has been inverted for a couple of months. A recession is likely sometime in 2023.
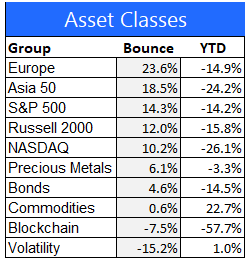
Major asset class performance
Here is a look at the performance of the major asset classes, measured as the change since the October low and year-to-date. European stocks have gained the most since the October low, followed by the Asia 50 (large caps) and the large-cap S&P 500 index.
Commodities, blockchain, and volatility are struggling to get off the ground. Bonds and gold both show signs of upward momentum.
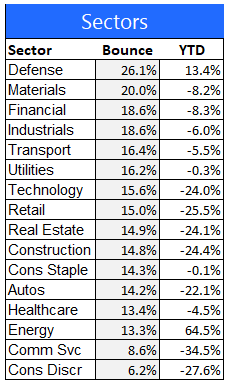
Equity sector performance
For this report, I use the expanded sectors as published by Zacks. They use 16 sectors rather than the standard 11.
The defense contractors like Lockheed (LMT), Boeing (BA), and Raytheon (RTX) are leading the way higher, followed by materials, financials, and industrials.
Retailers, consumer stocks, and communication services are lagging behind.
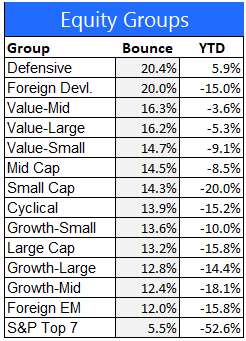
Equity group performance
For the groups, I separate the stocks in the S&P 1500 Composite Index by shared characteristics like growth, value, size, cyclical, defensive, and domestic vs. foreign.
Defensive names in healthcare, staples, and utilities are leading the way higher, along with Europe and value names.
The top 7 stocks by market cap (big tech names, like Apple (AAPL), Microsoft (MSFT), Alphabet (GOOG, GOOGL) enjoyed a strong up move today, but are still by far the worst performing equity group year-to-date.
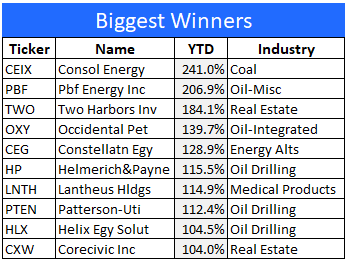
The 10 best performing stocks year-to-date
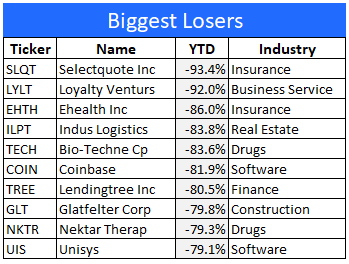
The 10 worst performing stocks year-to-date
Final thoughts
Today’s market rally was a big deal. Investor confidence was boosted by the comments from Chairman Powell regarding the possibility that the next rate hike won’t be as big as the last few.
At this point it looks like the worst of this spike in inflation is behind us. That takes some pressure off of the Fed, and allows them to slow the pace of rate hikes going forward. When investors begin to anticipate that the next move in rates will be lower, I think it will be safe to say that the bottom of this bear market is in.
Editor’s Note: The summary bullets for this article were chosen by Seeking Alpha editors.
Be the first to comment