

Sundry Photography
In Q2 2022, Texas Instruments Incorporated (NASDAQ:TXN) massively beat analyst consensus revenues by 12% to grow by 13.8% YoY and was also higher than our 2022 full-year revenue forecast growth rate of 6% from our previous analysis. The company’s stock price had been resilient only down 10% YTD compared to the semicon industry which is down by 29% YTD. Thus, in this analysis, we first examined the company’s revenue growth breakdown by end markets to determine its revenue growth driver in 2022. In relation, as the company’s management cited weakness in its personal electronics segment, we compared its revenue breakdown by end markets against the semiconductor industry.
Moreover, amid the industry supply constraints, we analyzed the company using efficiency analysis including inventory turnover and cash conversion cycle to examine the company’s supply chain management and determine its strengths against competitors.
Lastly, we examined the company’s planned capacity expansions and supply growth based on management’s guidance. Following the US CHIPS Act 2022, we determined the potential benefit to Texas Instruments and the impact on its FCFs.
Resilient Analog Semicon Company Buoyed By Automotive Exposure
|
Companies |
Q1 2021 |
Q2 2021 |
H1 2021 |
Q1 2022 |
Q2 2022 |
H1 2022 |
YoY Growth % (Q1) |
YoY Growth % (Q2) |
YoY Growth % (H1) |
Stock Price Change (YTD) |
|
Texas Instruments |
4,289 |
4,580 |
8,869 |
4,905 |
5,212 |
10,117 |
14.4% |
13.8% |
14.1% |
-10.05% |
|
ADI (ADI) |
1,558 |
1,661 |
3,220 |
2,684 |
2,972 |
5,656 |
72.2% |
78.9% |
75.7% |
-7.51% |
|
Infineon (OTCQX:IFNNY) |
3,165 |
3,228 |
6,394 |
3,649 |
3,791 |
7,439 |
15.3% |
17.4% |
16.4% |
-38.35% |
|
STMicro (STM) |
3,016 |
2,992 |
6,008 |
3,546 |
3,837 |
7,383 |
17.6% |
28.2% |
22.9% |
-19.16% |
|
Skyworks (SWKS) |
1,172 |
1,116 |
2,288 |
1,336 |
1,233 |
2,568 |
14.0% |
10.4% |
12.2% |
-34.99% |
|
NXP (NXPI) |
2,567 |
2,596 |
5,163 |
3,136 |
3,312 |
6,448 |
22.2% |
27.6% |
24.9% |
-25.39% |
|
Onsemi (ON) |
1,482 |
1,670 |
3,152 |
1,945 |
2,085 |
4,030 |
31.3% |
24.9% |
27.9% |
-1.95% |
|
Microchip (MCHP) |
1,467 |
1,569 |
3,037 |
1,844 |
1,964 |
3,808 |
25.7% |
25.1% |
25.4% |
-22.62% |
Source: Texas Instruments, Company Data, Khaveen Investments
Texas Instruments, Company Data, Khaveen Investments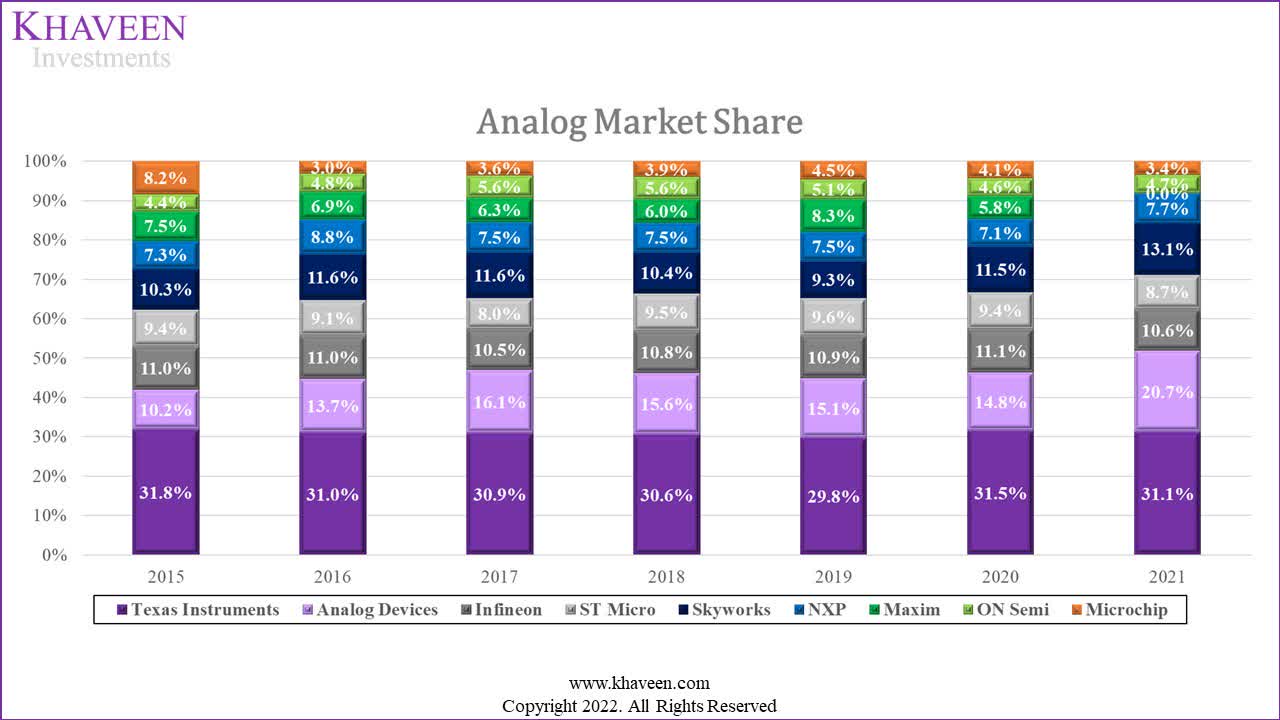
In H1 2022, Texas Instruments had revenue growth of 14.1% YoY. In comparison, this was above its 5-year and 10-year average revenue growth of 7.2% and 3.38%. However, its revenue growth among the top 8 analog companies was the second lowest only behind Skyworks while Analog Devices had the highest revenue growth during the period due to its acquisition of Maxim Integrated. While Texas Instruments had a slowdown in growth in Q2 compared to ADI, Infineon, STMicro, NXP and Microchip which had higher growth than in Q1, the company remained at the top as the largest analog chipmaker. Overall, despite having lower growth, it still beat analyst consensus revenues by 12% in Q2 2022 and had higher revenue growth than Skyworks.
Furthermore, we compared the top analog companies’ stock price change YTD in the table above. Among the companies, all of the analog companies except for Infineon and Skyworks had outperformed the semicon industry which is down by 29% YTD. Texas Instruments was among the top analog companies that had outperformed the semiconductor market YTD despite its second lowest revenue growth. Skyworks was the second worst performer only behind Infineon and with the lowest revenue growth in H1 at 12.2%. The company has a relatively large exposure to the smartphone market (forecasted to decline by -3.5% in 2022), which accounted for 61% of its revenue as discussed in our previous, compared to 33% for the Discrete, Analog and Other (‘DAO’) market segments according to SIA. Besides Skyworks, the European chipmakers generally underperformed compared to their US counterparts which we believe could be due to negative sentiment with the Russia-Ukraine conflict. Though, Microchip had the second worst performance among US analog companies despite its third highest revenue growth in H1 as the company had an EV/EBITDA of 27.96x in 2021 compared to its 5-year average EV/EBITDA of 17.82x which is the highest for US analog companies except for ADI at 20.63x.
Based on the company’s management in its latest earnings briefing, it cited weakness in its personal electronics segment outlook for the remainder of 2022. We compiled its revenue growth breakdown by end markets to determine the company’s revenue growth drivers.
Texas Instruments, Khaveen Investments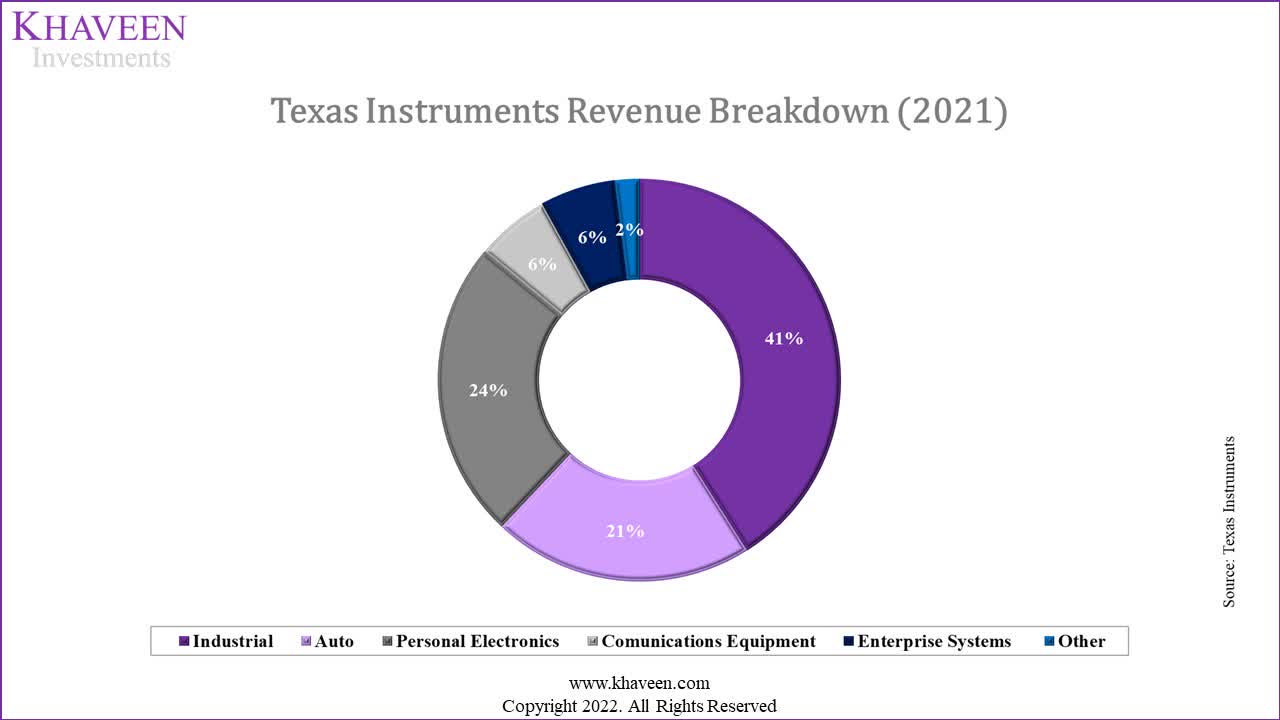
|
End Markets Growth YoY |
Q1 2022 |
Q2 2022 |
|
Industrial |
20% |
≈ 8% |
|
Automotive |
20% |
>20% |
|
Personal electronics |
≈ -5% |
≈ 2% |
|
Communications equipment |
10% |
≈ 25% |
|
Enterprise systems |
35% |
≈ 15% |
Source: Texas Instruments, Khaveen Investments
As seen in the table, the company’s revenue breakdown by end markets growth from its latest earnings briefing shows that the company’s industrial segment (41% of revenues) growth had slowed to high single digits in Q2 2022 compared to 20% in the prior quarter. Meanwhile, the company’s automotive segment, which is its second largest segment accounting for 21% of revenues, had accelerated to more than 20% in Q2 2022 compared to 20% in Q1. In terms of its personal electronics segment, it grew by low single digits in Q2 but management provided guidance indicating weakness in the segment for 2022. Finally, its two smallest segments Communications Systems and Enterprise Systems had positive growth but only represented 12% of revenues combined. Thus, the company’s revenue growth slowdown in Q2 is attributable to the slowdown in the industrial segment but its automotive segment still supporting its growth.
|
End Markets Breakdown |
TI |
Semicon Industry |
Market CAGR |
|
Industrial |
41% |
12.0% |
4.9% |
|
Auto |
21% |
12.4% |
7.9% |
|
Personal Electronics (PC, smartphones and consumer electronics) |
24% |
74.5% |
4.7% |
Source: Texas Instruments, SIA, Khaveen Investments
Furthermore, we compared the company’s revenue breakdown by end markets with the semicon industry. The semicon industry’s largest segment is personal electronics which consists of PC, smartphone and consumer electronics markets. As discussed in our previous analysis, the PC market is forecasted to decline by 8.2% in 2022 while the smartphone market by -3.5%. In comparison, Texas Instruments has a lower exposure to the personal electronics segment which was 24% of revenue. Furthermore, we compiled the average 3-year growth for each end market including industrial, automotive, and personal electronics (PC, communications and consumer) based on SIA. As seen, the automotive segment has the highest growth rate at an average of 7.9% followed by industrial (4.9%) and personal electronics (4.7%). Thus, we continue to believe the automotive segment to be Texas Instrument’s key growth driver as we determined in our previous analysis.
All in all, Texas Instrument’s stock price had only declined by 10% YTD compared to 29% YTD for the semicon industry and also outperformed several analog peers namely Skyworks, with high smartphone market exposure at 61% of revenues and the market was forecasted to decline by -3.5% in 2022, as well as its European peers such as Infineon, NXP, STMicro with negative sentiment from the Russia-Ukraine conflict. Going forward, we continue to expect the company’s growth outlook to be buoyed by the automotive segment with an average growth of 7.9%, which the company has a higher exposure to (21%) compared to the semicon industry (12.4%).
Solid Supply Chain Management
Amid the supply chain constraints within the semiconductor industry, Texas Instruments, as reported by DigiTimes, stated that the shortage of its analog chips may not ease by H2 2022. However, in the company’s earnings briefing, analyst Toshiya Hari from Goldman Sachs (GS) noted that the company’s peers are more supply constrained than the company and are facing inflationary pressures from foundry partners. Also, Texas Instruments depends on in-house production as 80% of its manufacturing is in-house. Thus, we analyzed the company’s efficiency based on its inventory turnover and cash conversion cycle.
|
Efficiency Analysis |
2017 |
2018 |
2019 |
2020 |
2021 |
TTM |
10-year Average |
|
Inventory Turnover |
2.40x |
2.20x |
2.00x |
2.25x |
2.62x |
2.46x |
2.72x |
|
Days Sales Outstanding (days) |
31 |
29 |
29 |
31 |
31 |
36 |
31 |
|
Days Payables Outstanding (days) |
35 |
37 |
37 |
33 |
38 |
49 |
35 |
|
Days Inventory Outstanding (days) |
152 |
166 |
182 |
162 |
139 |
148 |
145 |
|
Cash conversion Cycle (days) |
148 |
157 |
174 |
160 |
132 |
135 |
141 |
Source: Texas Instruments, Khaveen Investments
Based on the table, the company’s inventory turnover ratio measures its COGS over average inventory and indicates strong sales with higher ratios but could also signal its inventory is not enough to support its sales. The company’s inventory turnover ratio increased in 2020 and 2021 amid the supply shortages but had decreased based on TTM to 2.46x which is lower than its 10-year average. Moreover, the company’s days sales, payables and inventory had all increased based on TTM and its cash conversion cycle had increased to 135 days. The cash conversion cycle indicates the efficiency of the company in converting its investments in inventory into cash. All in all, despite the increase in the cash conversion cycle, the company’s low inventory turnover indicates its solid supply chain management despite the supply constraints which is in contrast with the DigiTimes report.
That said, the company’s inventory was comprised of work in process (56% of total inventory) and raw materials (13%) while finished goods represented 31% of inventory from its annual report. Thus, we believe that while its inventory turnover had improved in TTM, it may still be work in process goods instead of finished goods. Additionally, the company’s management noted that supply was still “somewhat constrained” but expects to ramp up production with its new fabs in Texas and Utah.
Furthermore, we compared the company against its competitors based on its inventory turnover to examine whether its peers also had an improvement in their inventory levels.
|
Inventory Turnover (Days) |
2017 |
2018 |
2019 |
2020 |
2021 |
TTM |
Average |
|
Texas Instruments |
2.40x |
2.20x |
2.00x |
2.25x |
2.62x |
2.46x |
2.32x |
|
Analog Devices |
2.45x |
2.07x |
1.95x |
1.81x |
1.53x |
1.44x |
1.87x |
|
Infineon |
3.09x |
2.85x |
2.50x |
2.51x |
2.51x |
2.28x |
2.62x |
|
Skyworks |
3.39x |
3.31x |
2.61x |
2.00x |
2.64x |
2.24x |
2.70x |
|
NXP |
2.13x |
2.05x |
1.79x |
2.17x |
3.40x |
3.14x |
2.45x |
|
Onsemi |
2.85x |
2.71x |
2.40x |
2.35x |
2.61x |
2.38x |
2.55x |
|
Microchip |
2.11x |
2.60x |
1.17x |
1.34x |
1.62x |
1.51x |
1.72x |
Source: Company Data, Khaveen Investments
Based on the table, besides Texas Instruments, all of its competitors had witnessed an improvement in their inventory turnover ratios which had declined in TTM compared to 2021. Additionally, only NXP had inventory turnover below its 10-year average while the rest of its competitors’ ratios were below the 10-year average. Also, Texas Instruments had the second highest inventory turnover ratio, only behind NXP at 3.14x while Analog Devices had the lowest at 1.44x based on TTM.
Thus, we believe that the company’s inventory management levels had improved in the past 1 year with the decline of its inventory turnover ratio from 2.62x to 2.46x. This is in contrast with the DigiTimes report that the company could continue throughout the second half of the year. However, the majority of the company’s inventory is comprised of work in process goods at 56% of total inventory and the company highlighted in its earnings briefing that it was still “somewhat constrained”. In comparison with competitors, all of its analog peers’ ratios had declined in TTM.
Government Assistance Supports Capacity Expansion
In 2022, the company’s near-term planned expansions include RFAB2 in the second half of this year and LFAB in early 2023. Previously, the company had also announced new expansions in Sherman with 4 new manufacturing plants. The first 2 are expected to be completed and begin production by 2025 while the construction for the third and fourth plants would begin between 2026 and 2030. According to management, each plant is expected to generate $5 bln to $6 bln of revenue when fully equipped.
According to TechExplore, the company did not receive state incentives from the Texas Enterprise Fund. With the recent US CHIPS Act 2022 passed and signed, management in the earnings briefing highlighted that the investment plans for the next decade did not factor in incentives it might receive from the legislation but noted that it could potentially subsidize its planned expansions. In relation, Samsung announced to build its own $17 bln plant in Austin and was reported to be committing investments worth $192.1 bln over the next 20 years while Intel announced a $20 bln chip plant in Ohio as well as Arizona.
|
CHIPS Act of 2022 |
$ bln |
|
Incentive Program |
39 |
|
Commerce R&D and workforce development programs |
11 |
|
Total CHIPS for America Fund |
50 |
Source: US Senate
Based on the table above, the US CHIPS Act 2022 comprises the $50 bln CHIPS for America Fund which is divided into the $39 bln Incentive Program and $11 bln Commerce R&D and workforce development programs. The Incentive Program funding is “to develop domestic manufacturing capability”. Moreover, the $11 bln Commerce R&D and workforce development programs include funding for the National Semiconductor Technology Center, advanced packaging, and other related R&D programs.
|
Company |
Planned Investments ($ bln) |
Share |
|
GlobalFoundries (GFS) |
1 |
0.4% |
|
Intel (INTC) |
42.5 |
17.5% |
|
Micron (MU) |
40 |
16.4% |
|
Samsung (OTCPK:SSNLF) |
96.05 |
39.4% |
|
SK Hynix |
22 |
9.0% |
|
TSMC (TSM) |
12 |
4.9% |
|
Texas Instruments |
30 |
12.3% |
|
Total |
243.55 |
100% |
Source: Company Data, Khaveen Investments
Based on the company’s latest earnings briefing, the company plans to invest $3.5 bln in capex annually through 2025 and stated that it will commit 10% of revenue for capex from 2026 to 2030. In comparison with its historical capex, the company only had an average capex of $816 mln per year in the past 10 years and $1,157 in the past 5 years. We estimated the share of subsidies for Texas Instruments by first calculating its share of announced planned investments by chipmakers and foundries in the US at 12.3% based on its $30 bln investments. With this share, we applied this to the allocated subsidy amount of $19 bln in 2022 and $5 bln from 2023 to 2026 according to the US CHIPS Act. After subtracting this from the company’s capex guidance, we obtained the net capex for Texas Instruments.
Texas Instruments, Khaveen Investments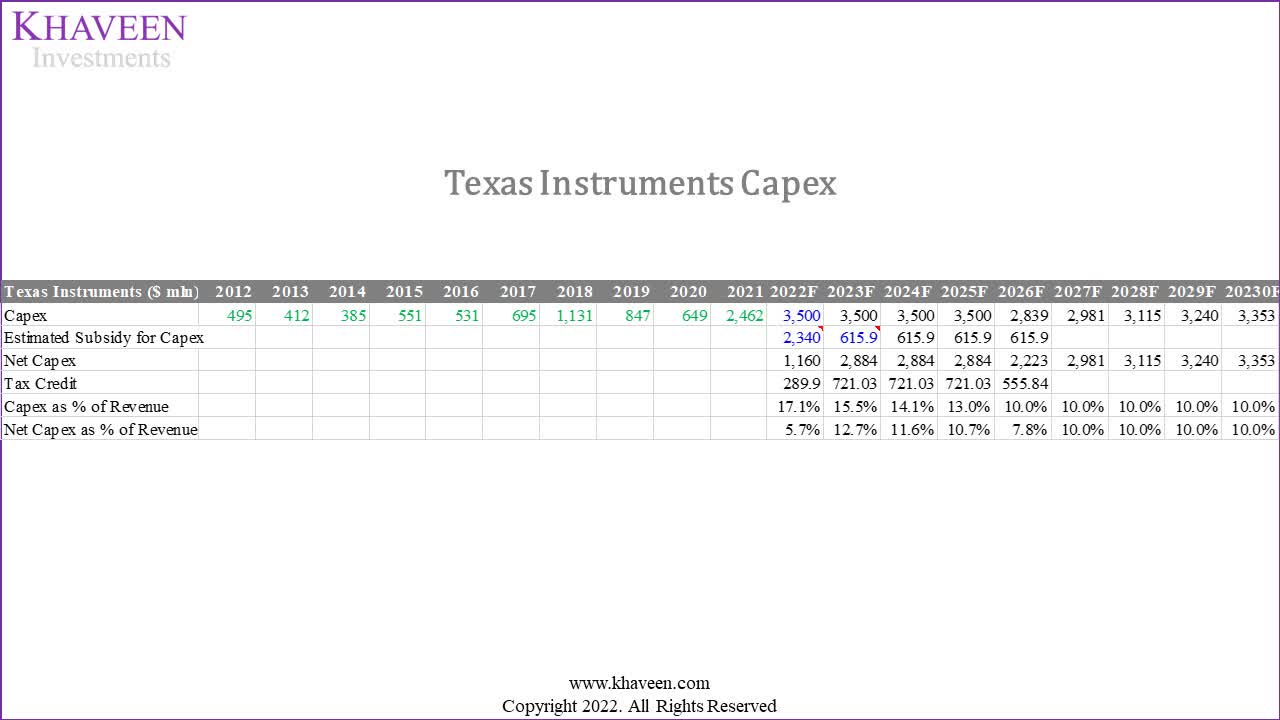
As seen in the table, we estimated its subsidy from its share to be $2.34 bln in 2022 on its guided capex of $3.5 bln resulting in a net capex of $1.16 bln. Beyond 2022, we estimated its share of subsidies to be $615.9 mln and net capex of $2.88 bln until 2025. Overall, we estimate the subsidies to reduce its capex as a % of revenue from 17.1% to 5.7% in 2022 and a 5-year forward average of 9.7% of revenue.
Furthermore, we believe Texas Instruments would benefit from the investment tax credit as part of the CHIPS Act. This involves a 25% investment tax credit to support the construction of manufacturing facilities in the US.
|
Texas Instruments ($ mln) |
2022F |
2023F |
2024F |
2025F |
2026F |
2027F |
2028F |
2029F |
20230F |
|
EBT |
11,123 |
10,682 |
11,274 |
11,937 |
12,671 |
13,527 |
14,245 |
14,925 |
15,559 |
|
Effective Tax (Before Tax Credits) |
1,393 |
1,338 |
1,412 |
1,495 |
1,587 |
1,694 |
1,784 |
1,869 |
1,949 |
|
Effective Tax Rate (Before Tax Credits) |
12.5% |
12.5% |
12.5% |
12.5% |
12.5% |
12.5% |
12.5% |
12.5% |
12.5% |
|
Effective Tax (After Tax Credits) |
1,103 |
617 |
691 |
774 |
1,031 |
1,694 |
1,784 |
1,869 |
1,949 |
|
Effective Tax Rate (After Tax Credits) |
9.9% |
5.8% |
6.1% |
6.5% |
8.1% |
12.5% |
12.5% |
12.5% |
12.5% |
Source: Texas Instruments, Khaveen Investments
With the 25% tax credit, we estimate the company’s effective tax rate to reduce to 9.9% in 2022 from our assumption for its effective tax rate before tax credits of 12.5% based on its 5-year average. Whereas beyond, we expect the company’s effective tax rate to be reduced with the tax rate with a 5-year average of 7.3%.
Texas Instruments, Khaveen Investments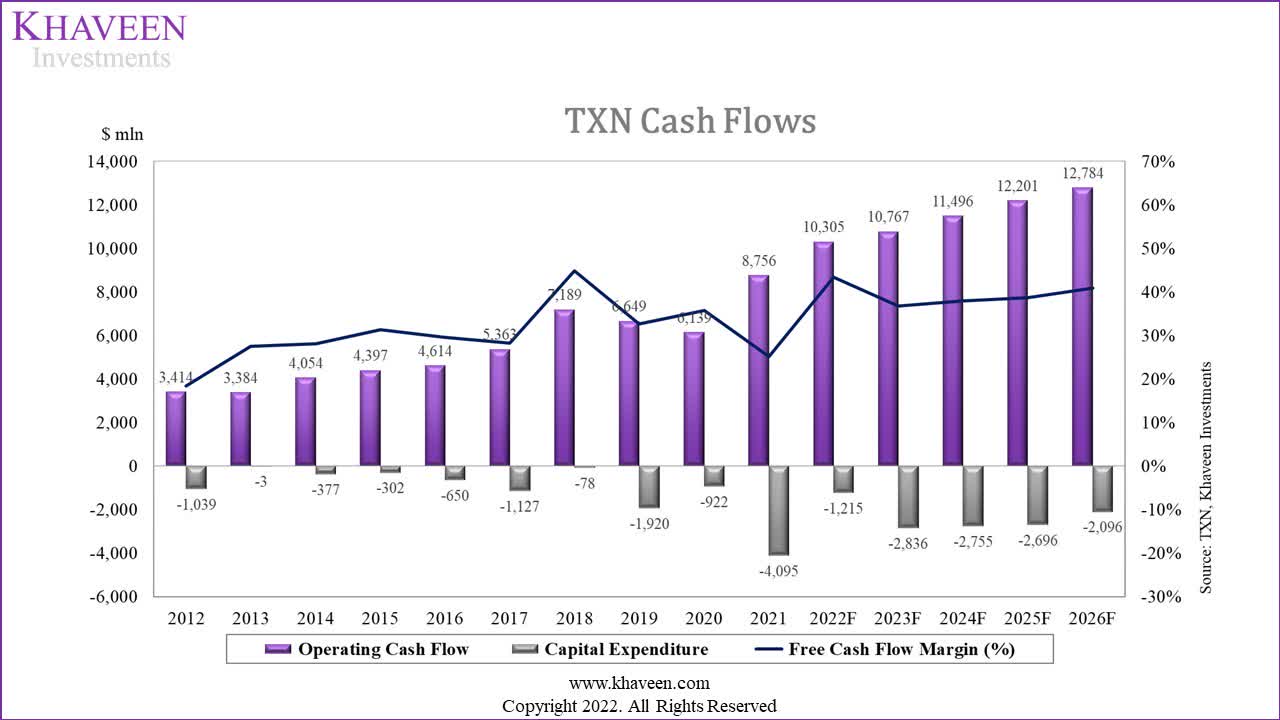
|
Texas Instruments FCF ($ mln) |
2022F |
2023F |
2024F |
2025F |
2026F |
|
Operating Cash Flow (With CHIPS Act) |
10,305 |
10,767 |
11,496 |
12,201 |
12,784 |
|
Capital Expenditure (With CHIPS Act) |
1,215 |
2,836 |
2,755 |
2,696 |
2,096 |
|
Free Cash Flow Margin (%) (With CHIPS Act) |
43.5% |
36.7% |
37.9% |
38.7% |
40.8% |
|
Operating Cash Flow (Without CHIPS Act) |
9,690 |
10,017 |
11,197 |
12,224 |
13,056 |
|
Capital Expenditure (Without CHIPS Act) |
3,500 |
3,500 |
3,500 |
3,500 |
2,839 |
|
Free Cash Flow Margin (%) (Without CHIPS Act) |
31.4% |
29.8% |
32.0% |
33.3% |
36.8% |
Source: Texas Instruments, Khaveen Investments
To conclude, as the company planned to increase its capex with the guidance of $3.5 bln through 2025 to increase capacity, we believe the company could benefit from the CHIPS Act with the subsidies and tax credits. Based on our estimated share of subsidy allocation for the company, we forecasted its net capex as a % of revenue to reduce to 17.1% from 5.7% in 2022 and the tax credits to reduce its tax rate assumption from a 5-year average of 12.5% to 7.3% through 2026. All in all, we expect this to be positive for its FCF margins with a forecasted increase to 43.5% in 2022 compared to 31.4% without the subsidies and tax credits.
Risk: Demand Slowdown
Based on the company’s earnings briefing, the company highlighted weakness in the personal electronics segment outlook, accounting for 24% of its total revenues in 2021. In our previous analysis, we examined the smartphone market headwinds including geopolitics risk between Russia-Ukraine, component shortages, price inflation, and COVID supply disruptions. In our Micron analysis, we highlighted the “supply and logistics disruption in China and macroeconomic headwinds” in the PC market according to the IDC which forecasted to market to decline by -8.2% in 2022 and the smartphone market to decline by 3.5% according to Strategy Analytics. However, the company did not highlight weakness in its other end market segments. Though, in comparison, Analog Devices indicated that order cancellations were increasing and were not specific to any geography or end market.
Economic conditions are beginning to impact demand with orders showing — orders slowing later in the quarter and cancellations increasing slightly. – Vincent Roche, CEO
Thus, we believe this may pose a threat to Texas Instruments with the indicated slowdown and order cancellations highlighted by its competitor and may affect its revenue growth outlook.
Valuation
We updated our revenue projections for the company in the table below by projecting the company’s revenue growth by supply based on its 10-year average asset turnover ratio of 0.81x and our forecast of the company’s assets through 2027. Additionally, we compared this updated forecast to our previous analysis of the company based on its end market breakdown, with prorated Q1 and Q2 for 2022, which is our revenue growth by demand projection. We derived the net revenue forecast based on the lower of our demand and supply projections due to growth constraints. This provides us with a forward 5-year average revenue growth rate of 7.9% which is higher compared to our previous analysis of 5.8%. In 2026 and beyond, we based our forecast on the analog market forecast CAGR of 5.5% but tapered down by 0.5% per year as a conservative estimate.
|
Texas Instruments ($ bln) |
2019 |
2020 |
2021 |
2022F |
2023F |
2024F |
2025F |
2026F |
2027F |
|
Asset Turnover (‘a’) |
0.84x |
0.80x |
0.95x |
0.81x |
0.81x |
0.81x |
0.81x |
0.81x |
0.81x |
|
Assets (‘b’) |
18,018 |
19,351 |
24,676 |
29,055 |
33,851 |
39,026 |
44,491 |
50,195 |
55,976 |
|
Revenue (Supply) (‘c’) |
14,383 |
14,461 |
18,344 |
19,921 |
23,456 |
27,327 |
31,506 |
35,917 |
40,522 |
|
Growth % |
0.5% |
26.9% |
8.6% |
17.7% |
16.5% |
15.3% |
14.0% |
12.8% |
|
|
Revenue (Demand) |
14,383 |
14,461 |
18,344 |
20,925 |
22,248 |
23,658 |
25,160 |
26,762 |
28,469 |
|
Growth |
0.5% |
26.9% |
14.1% |
6.3% |
6.3% |
6.4% |
6.4% |
6.4% |
|
|
Net Revenue |
14,383 |
14,461 |
18,344 |
19,921 |
22,248 |
23,658 |
25,160 |
26,762 |
28,469 |
|
Growth |
0.5% |
26.9% |
8.6% |
11.7% |
6.3% |
6.4% |
6.4% |
6.4% |
*c = a x b
Source: Texas Instruments, Khaveen Investments
We valued the company based on a DCF as we expect it to have positive FCFs. For the terminal value, we used our average chipmakers’ EV/EBITDA of 14.31x.
SeekingAlpha, Khaveen Investments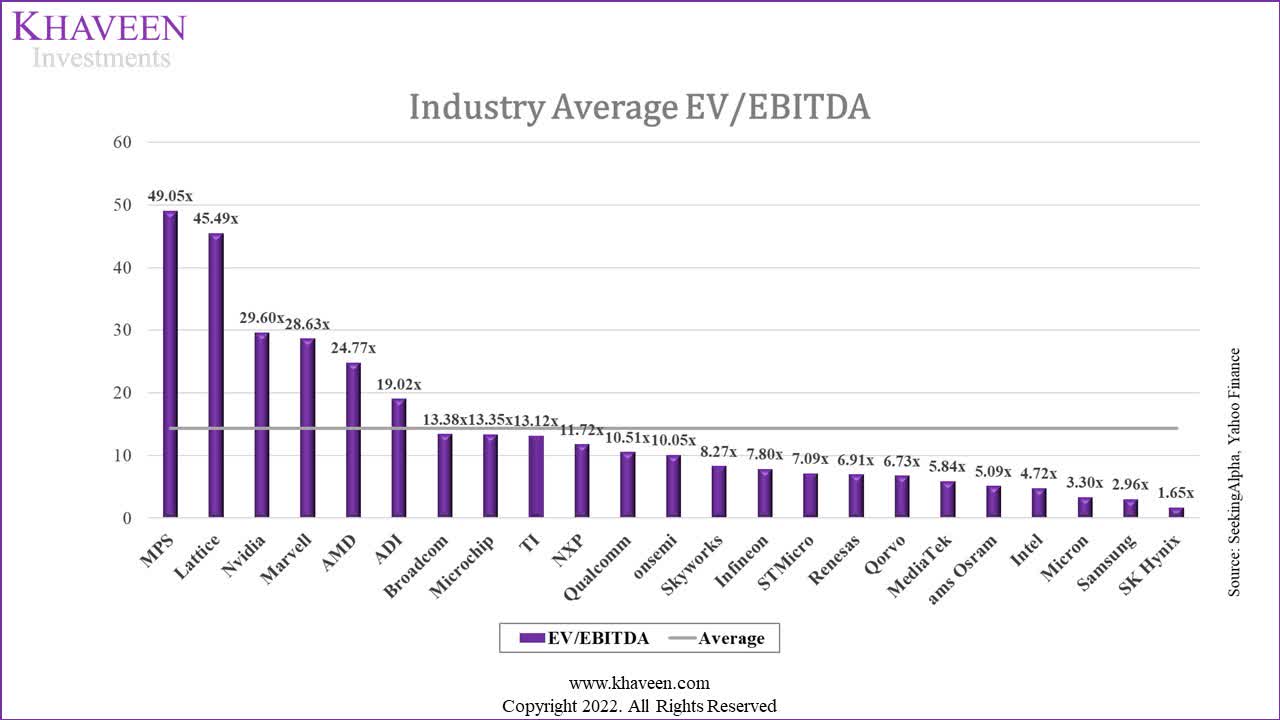
Based on a discount rate of 8.5% (company’s WACC), our model shows its shares are undervalued by 18.53%.
Khaveen Investments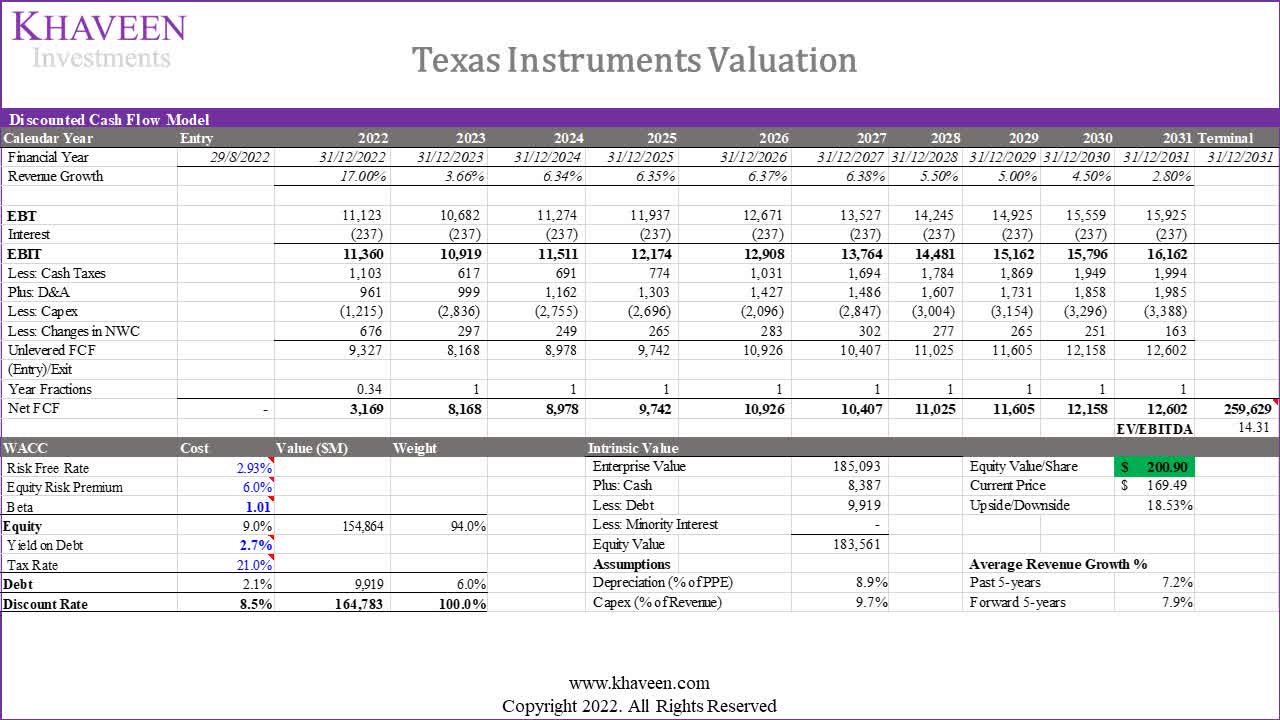
Verdict
To conclude, the company’s stock price has only declined by 10% YTD compared to 29% YTD for the semicon industry. We continue to expect the company’s growth outlook to be buoyed by the automotive segment with an average growth of 7.9%, which the company has a higher exposure to (21%) compared to the semicon industry (12.4%). Furthermore, we believe that the company’s inventory management levels had improved in the past 1 year with the decline of its inventory turnover ratio from 2.62x to 2.46x in line with its competitors but noted that the company highlighted it was still “somewhat constrained”. Finally, we forecasted its net capex as a % of revenue to reduce from 17.1% to 5.7% in 2022 and the tax credits to reduce its tax rate assumption from a 5-year average of 12.5% to 7.3% through 2026. As a result, we expect this to be positive for its FCF margins with a forecasted increase to 48.3% in 2022 compared to 31.4% without the subsidies and tax credits.
In our opinion, we view its expansion to be positive on its FCF margins as a beneficiary of the US CHIPS Act. However, we are also cautious about its revenue growth outlook in our projections which indicated that supply could exceed demand. Thus, we maintain our rating of the company as a Buy with a slightly higher price target of $200.90 with a higher revenue growth rate of 7.9% on a 5-year forward average but with a lower average EV/EBITDA for the terminal value.
Be the first to comment