

peerapong muangjan/iStock via Getty Images
Thesis
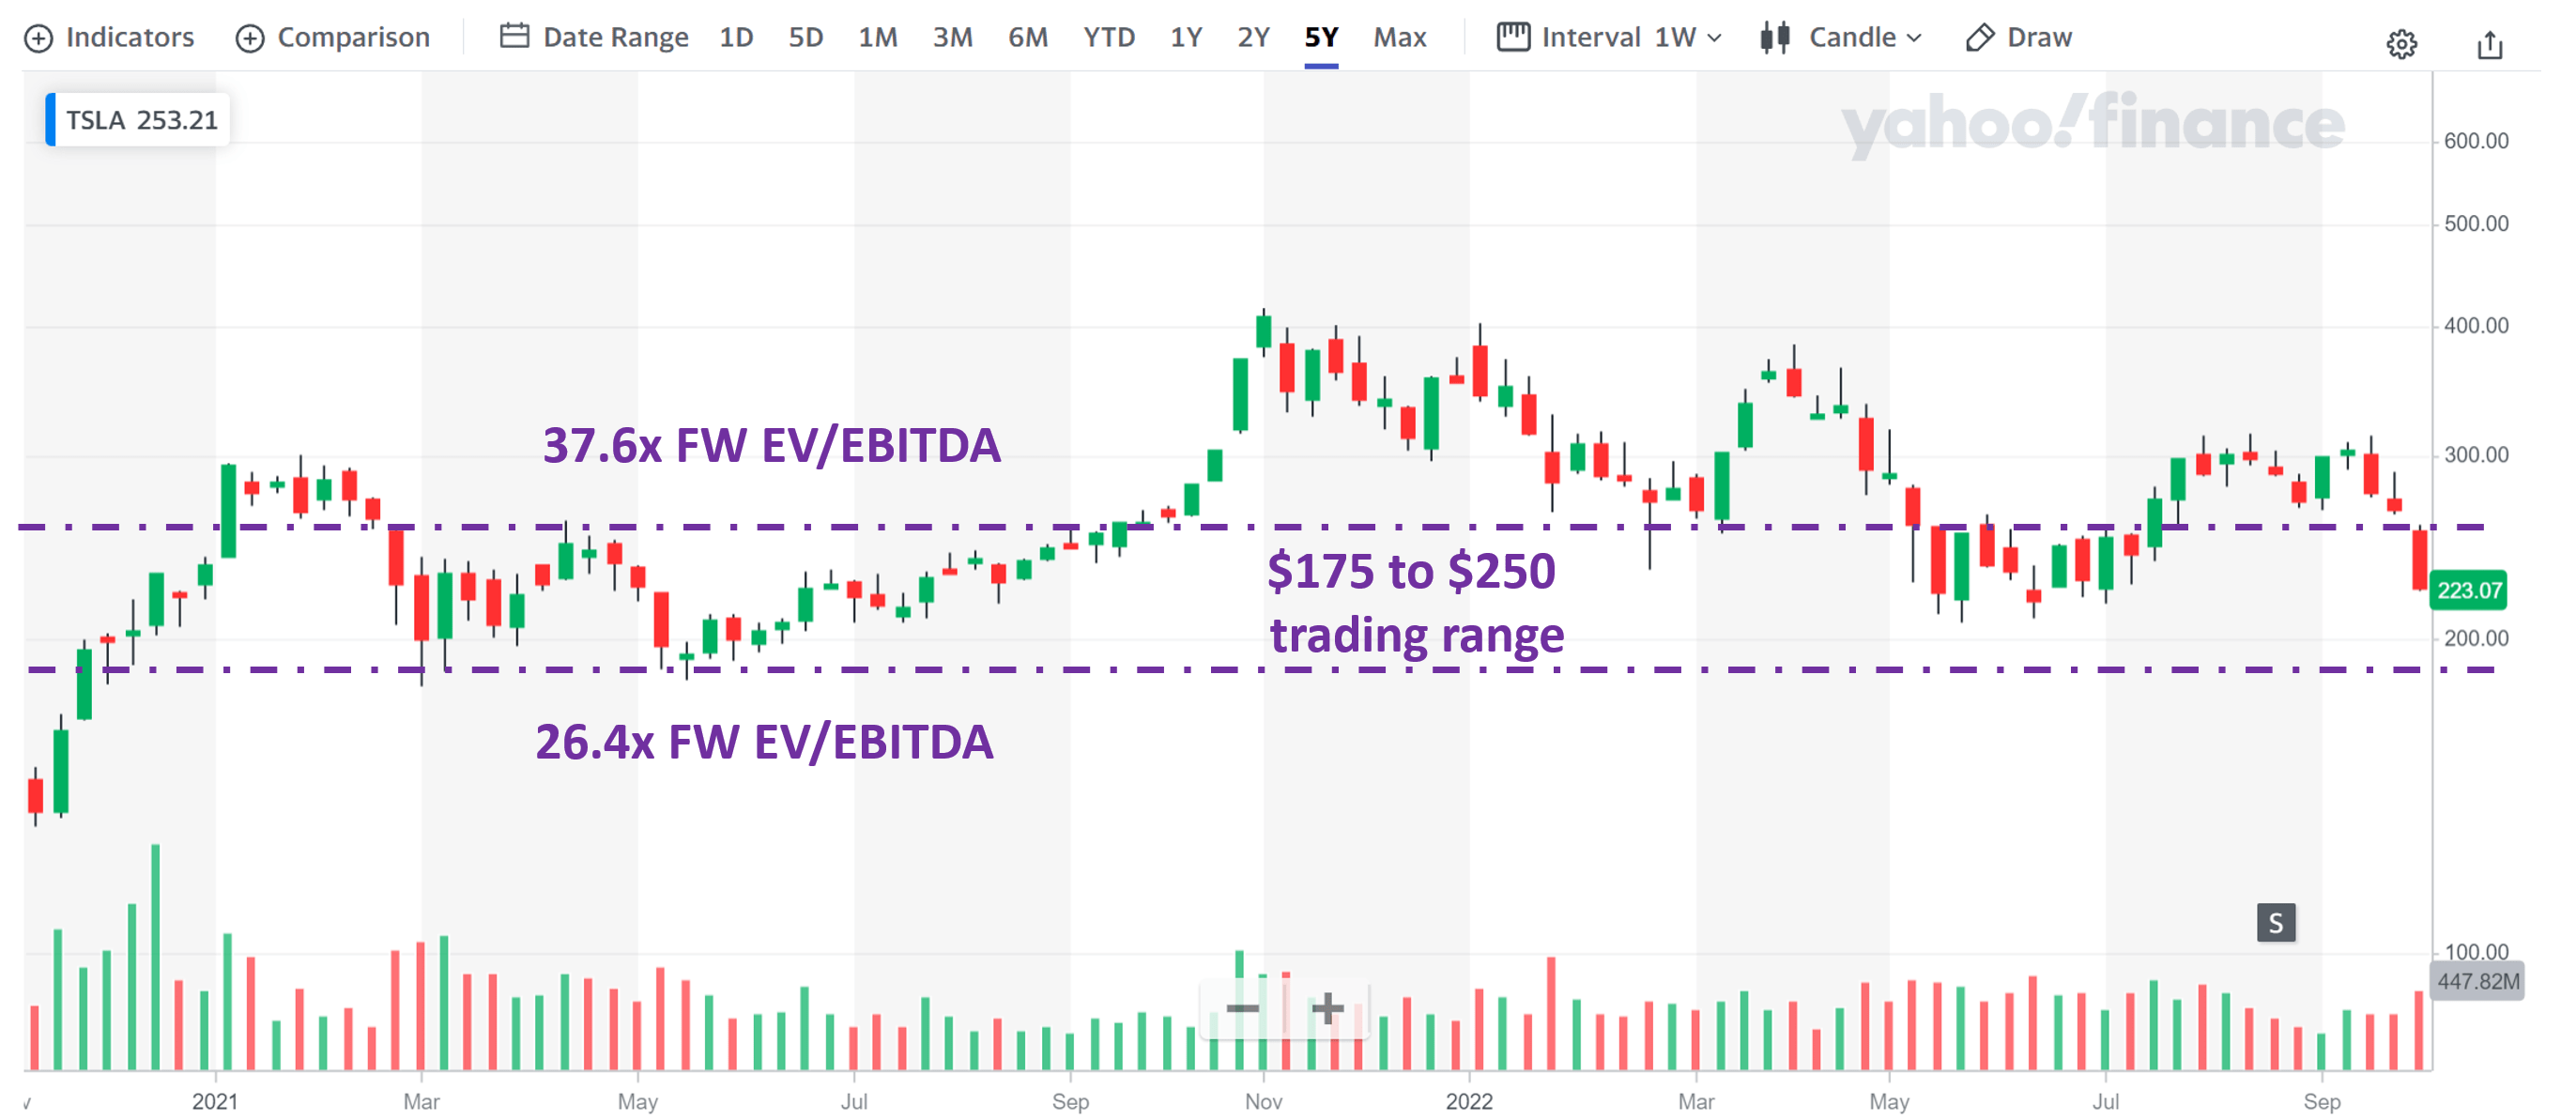
Tesla (NASDAQ:TSLA) experienced its largest one-day selloff recently after the company reported Q3 deliveries that missed consensus expectations. Given the magnitude of such price movements, my view is that the market has already fully baked its incoming Q3 earnings report (scheduled on Oct. 19, 2022) into the current prices. And as such, I foresee the stock to be range bound between $175 and $250 in the near future. I do not see major catalysts to break this range till its Q4 delivery report.
This article will detail my analysis of these trigger points so investors can better prepare. Overall, I see more downside (about 22%) than upside (about 12%) in the near term. Although a $175 price, if reached, would represent an excellent entry point for both swing trading and long-term holding.
For swing traders, fundamental valuation metrics may be misleading for extremely volatile stocks like TSLA. It is a well-known fact, for such stocks, bottom valuation can occur at the bottom of their near-term cycle and vice versa. Hence, swing traders might find the first chart below more helpful. The stock is currently 46.6% off its recent high. And in the past since 2017, the stock has suffered corrections as large as this current only 3 times: in 2019, 2020, and most recently in 2022. As you can see, in each case, the stock staged a rapid rebound shortly afterward. And the $175 price, if reached due to jitter caused by its Q3 earnings report, would represent a 57% decline off its recent peak, closest to the largest retraction of 60% only during the COVID fire sale.
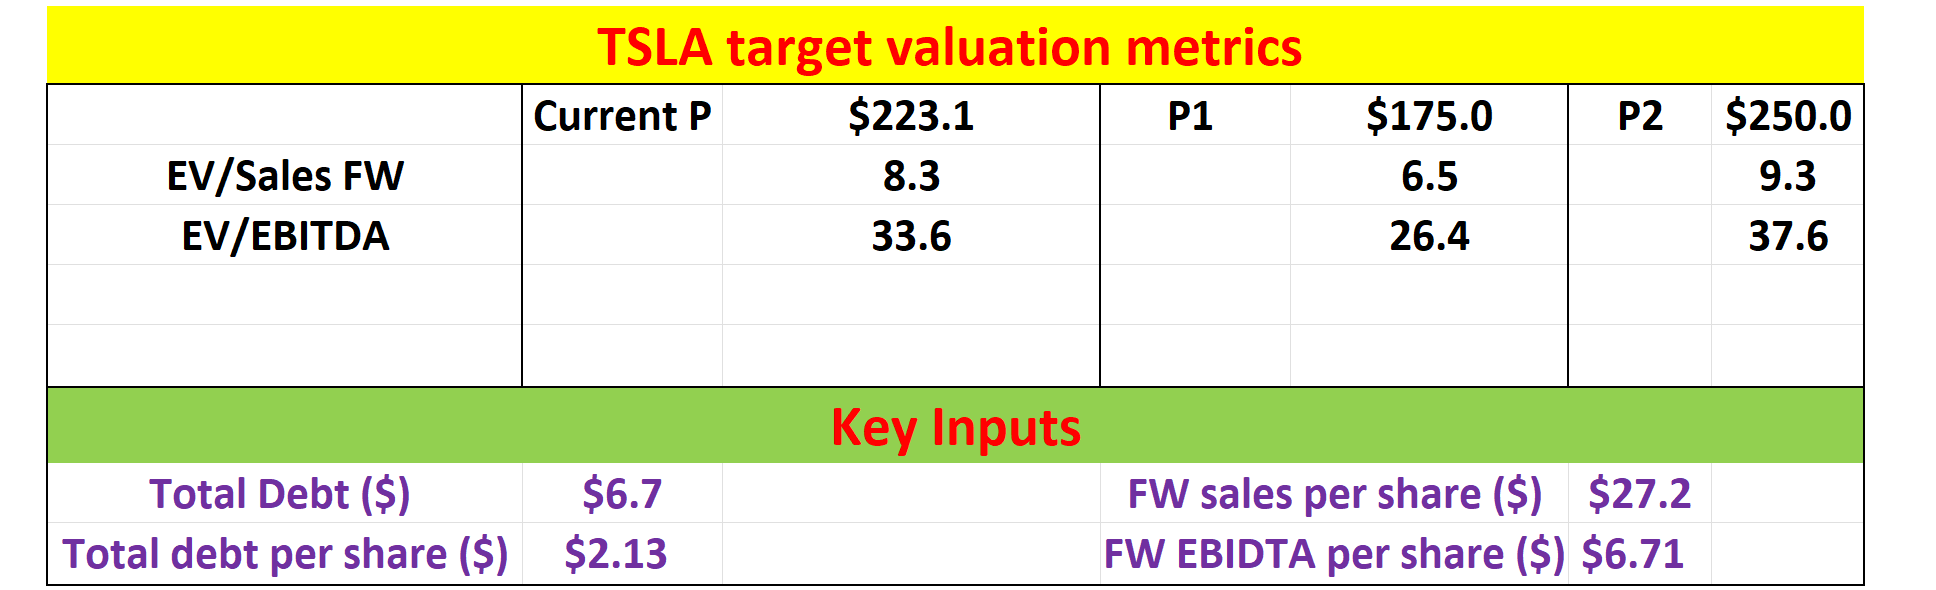
The remainder of this article is more oriented toward long-term holders. A price of $175 would translate into an FW EV/EBITDA of 26.4x, and next, you will see why such an entry valuation creates favorable returns potential in the long term.
Seeking Alpha data Author based on Yahoo data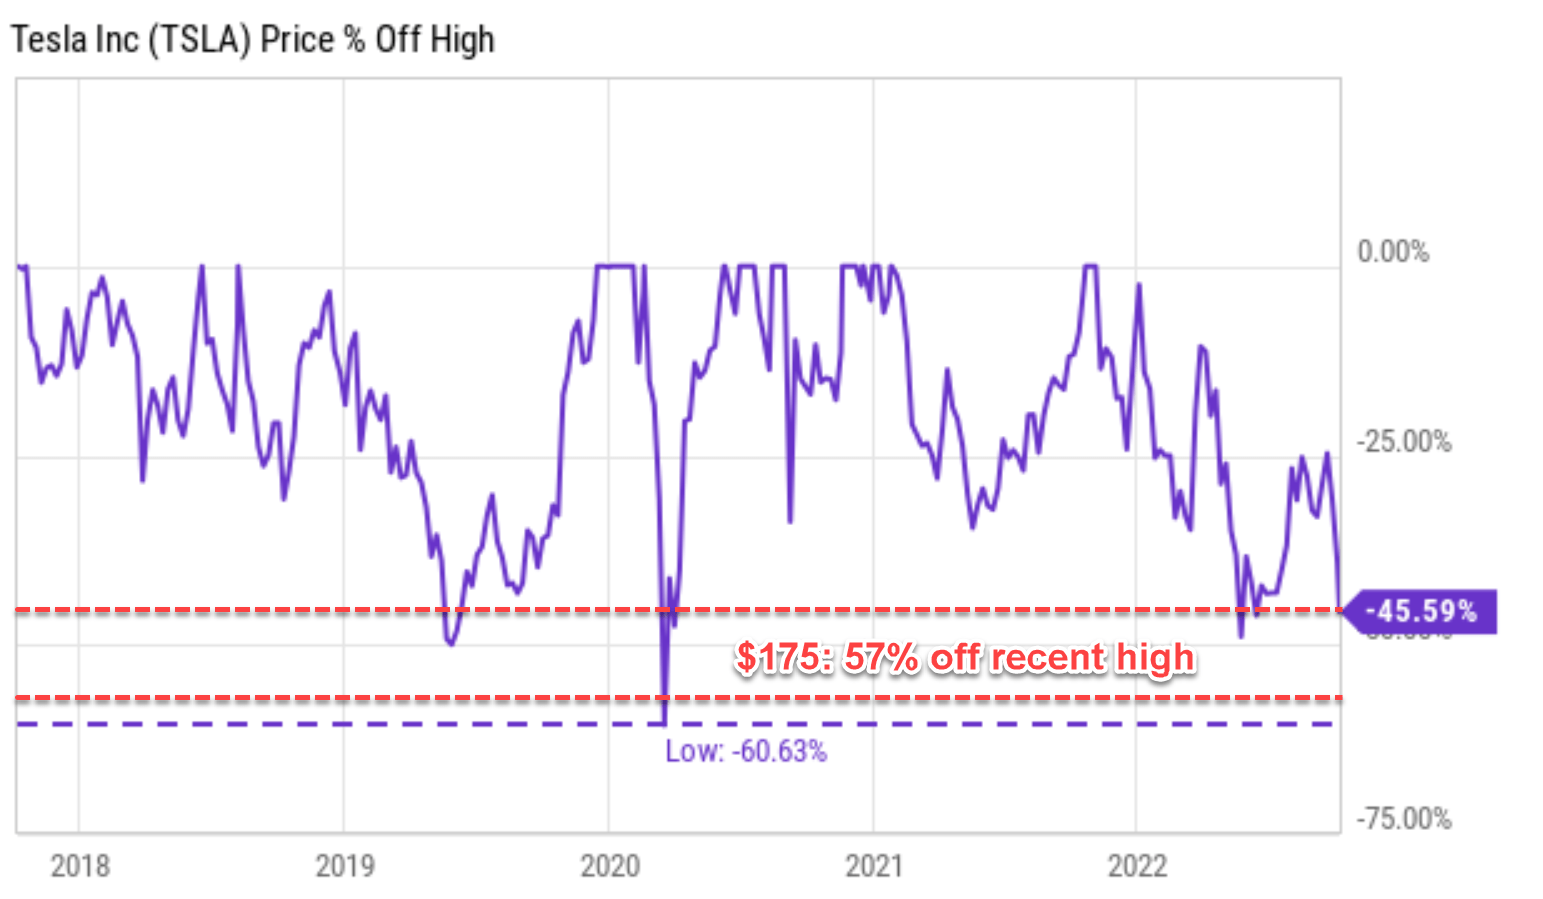
Long-term growth potential intact
I view the Q3 delivery miss only as a short-term speed bump. To wit, Tesla produced 365,923 vehicles in Q3 and delivered 343,830. These numbers still represent remarkable growth (in the range of 40-50% YOY growth and the range of 30-40% QoQ). However, these numbers missed consensus estimates for deliveries by about 4%.
First, TSLA still enjoys capital allocation flexibility and is still investing aggressively toward growth. The following chart provides a summary of TSLA maintenance and growth capital spending (details of these concepts can be found in my earlier article here) in the recent past since Jan 2020. Its total depreciation and amortization (“TDA”) are $3.4B. Its CAPEX expenditures are at $7.15B, exceeding its total TDA by $3.75B. In relative terms, its CAPEX expenditures are more than 2x of its TDA.
Seeking Alpha data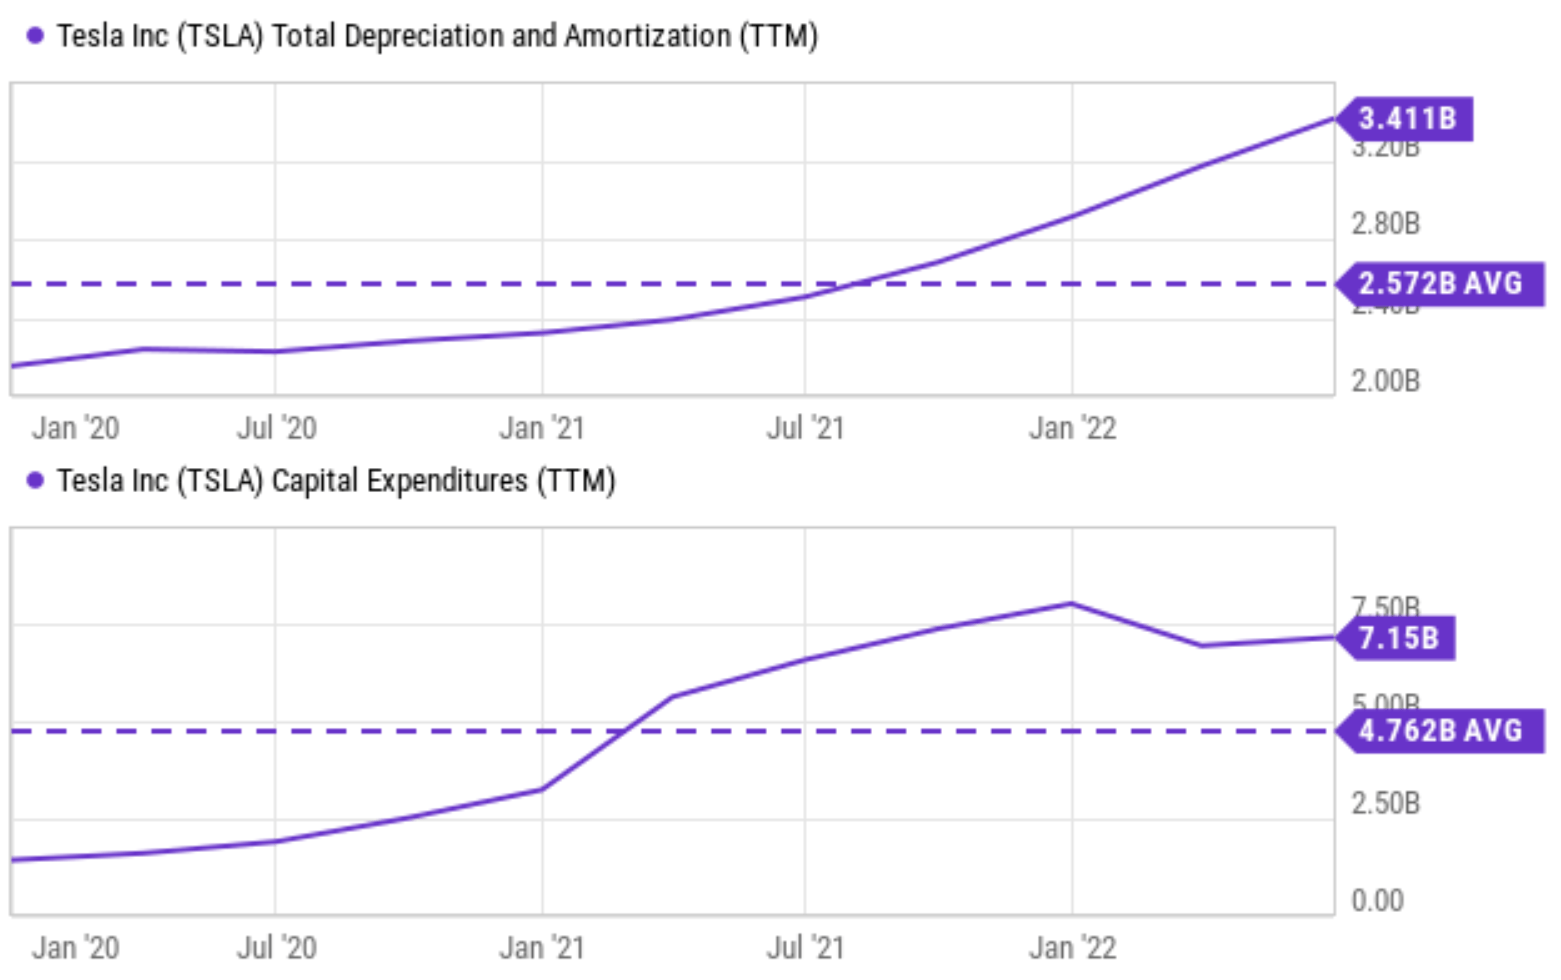
And hence, a large part of its CAPEX spending is toward growth CAPEX. If we approximate its maintenance CAPEX by the TDA, then it has been on average $2.57B since 2020 as seen from the top panel above. And its total CAPEX has been on average $4.76B. The difference of $2.19B can then be used to approximate the amount of growth CAPEX it has been reinvesting. In other words, the growth CAPEX is on average about 46% of the total CAPEX spending in recent years. As a result, its owners’ earnings (“OE”) are much higher than its accounting EPS because the growth CAPEX should be added back to its owners’ earnings, as shown in the chart below.
The chart below shows TSLA’s true economic earnings compared to its accounting EPS using Greenwald’s method as detailed in my earlier article or his book entitled Value Investing. As seen, TSLA’s OE has systematically exceeded its accounting EPS and also its FCF (free cash flow) since 2018. As of 2021, its OE is about $9 per share compared to an accounting EPS of only ~$2 per share.
Author based on Seeking Alpha data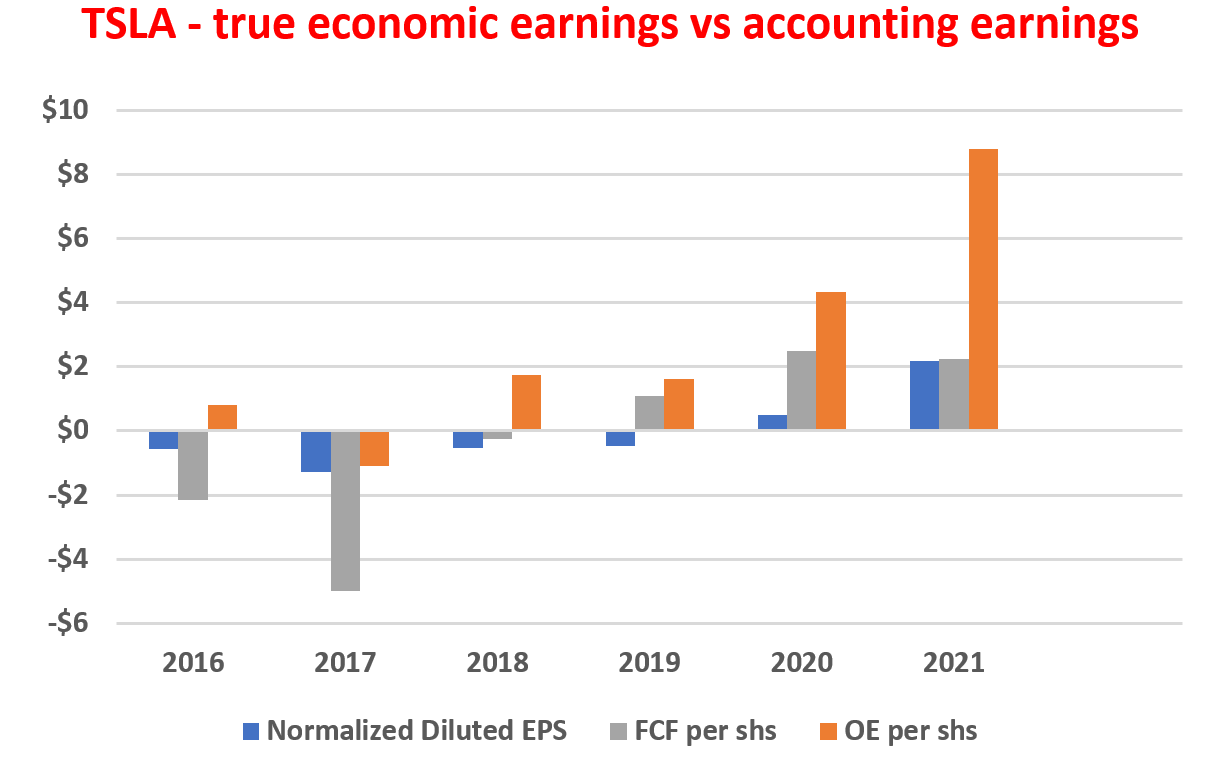
Non-linear growth drivers down the road
Looking further out, there are longer-term growth drivers that are highly nonlinear. Currently, TSLA is still a “car” company that derives the bulk of its income from manufacturing and selling cars (84.7% of its total revenue as seen in the chart below).
However, its other segments, the non-manufacturing segments, are growing rapidly. As a notable example, its automotive services now represent 7.06% of its total revenue. With its FSD potential, such services can break all the limitations of hardware manufacturing. It could become totally scalable just like a software platform, and as a result, enjoys higher-order nonlinear growth. As detailed in my earlier article, a few key factors to consider:
- FSD can lead to more miles driven. For example, researchers at the Institute of Transportation at the University of California began to show that automated or semi-automated vehicles like those TSLA makes, when there are enough of them in operation, can lead to increased vehicle miles traveled (“VMT”).
- The FSD technology becomes more valuable when more people use it. In the 2022 Annual Meeting of Stockholders (Thursday, August 4, 2022), Musk believes that Tesla’s cumulative production of vehicles will reach 100 million. Meanwhile, its autonomous driving technology is maturing and scaling up rapidly. As of Q2-2022, over 100,000 Tesla drivers in North America had access to Full Self-Driving Beta. And the accumulated miles driven by Full Self-Driving had been expanding exponentially and reached 35 million miles so far.
The factors create new strategies for TSLA to monetize in areas like service sales (service income will be proportional to VMT), insurance income (which would be also proportional to VMT but in a different paradigm with large-scale FSD deployment), and also autonomous driving functions and software.
BofA data and TSLA presentation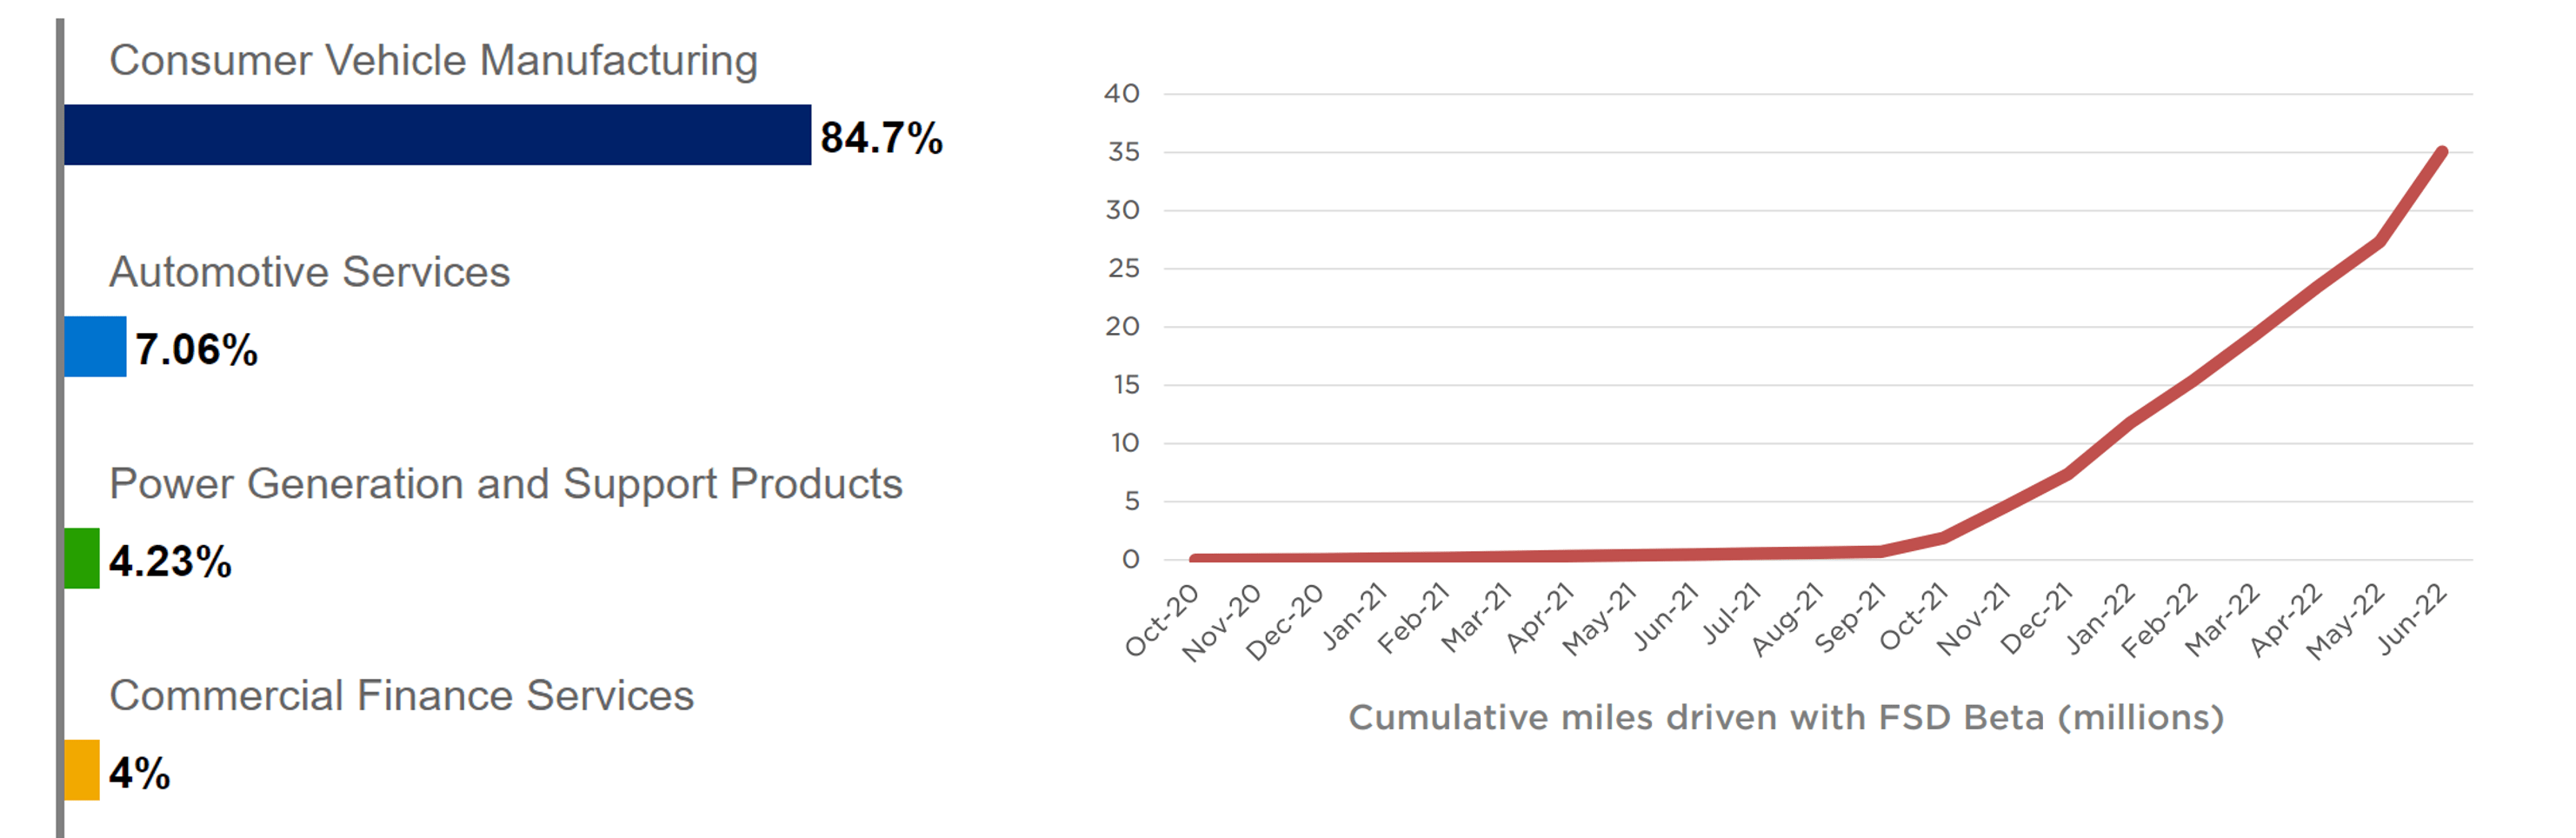
The near-term headwinds
Although in the near term, there is no shortage of headwinds to keep the stock price range bound as mentioned above. And the Q3 delivery miss is a symptom of these ongoing headwinds. These headwinds include limited production and shutdowns at its factory in Shanghai for a large part of 1H 2022 and potential disruptions for the rest of the year also. The company still faces challenges associated with ongoing supply-chain disruptions and labor shortages. At the same, other traditional automakers are investing aggressively in their EV development too and competing fiercely for market share. Also, EV adoption is currently driven primarily by government regulations and subsidies, and these regulations and subsidies could change with short notice.
These uncertainties are encapsulated in the large variance in the consensus estimates. A total of 31 analysts provided earnings revisions for the last 3 months. And the revisions are close to a perfect split between Up Revisions and Down Revisions. A total of 18 analysts submitted an up revision and 13 a down revision. The revised estimates vary widely too. Even for 2022, the lower end of the consensus EPS is $3.75 and the high end is $6.53, a variance of 74%. And the variance widens further to 112% for 2023.
Author based on Seeking Alpha data
The $175-250 trading range again
At its current price level, its valuation is still elevated despite the recent correction. To wit, it is currently valued at around 10.2x EV/sales ratio and 47.8x EV/EBITDA. On an FW basis, the multiples are a bit lower but it is at around 8.3x EV/sales ratio and 33.6x EV/EBITDA. It is expensive both in relative terms and absolute terms in my mind. As a reference point, the overall market is valued at about 3.5x EV/sales and 16x EV/EBITDA. On an absolute scale, leading institutions like BofA Global Research model its near-term valuation around 13x EV/Sales and 55x EV/EBITDA. I think these multiples are way too optimistic given the near-term headwinds and the historical volatility.
My target valuations are provided in the second chart below. As seen, I am essentially assuming ½ of the valuation provided by BofA in the near term. The lower bound of my price range corresponds to 6.5x FW EV/sales ratio and 26.4x EV/EBITDA. The estimates were made using financial data provided by SA as summarized in the lower part of the table.
Seeking Alpha data Author based on Seeking Alpha data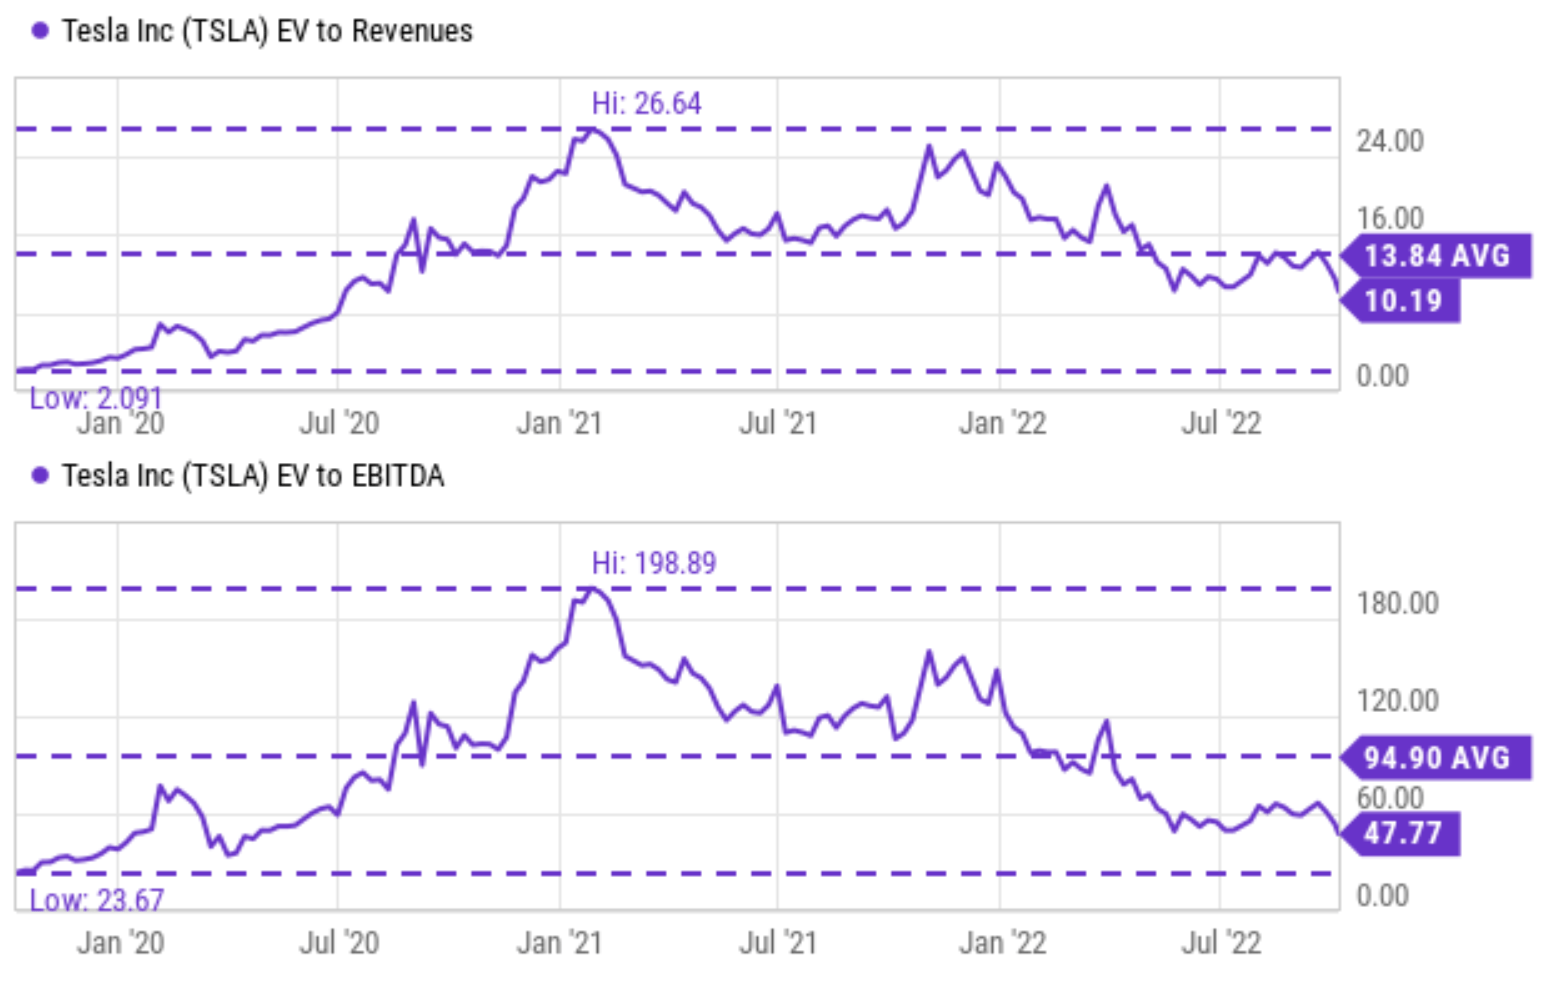
Risks and final thoughts
To reiterate, I see Tesla stock price oscillating in a relatively narrow range of $175-$250 trading range till the Q4 delivery report. With the recent large price movements, the market has baked in the Q3 earnings report already. Overall, I see more downside in the near term than upside due to the near-term headwinds. Its Q3 delivery miss is a symptom of these headwinds, including the lingering effects from its Shanghai factor shutdown, ongoing supply-chain disruptions, labor shortages, et al.
While there might be some interesting opportunities for both swing traders and long-term investors, the $175 price, if reached, would represent an excellent entry point for both swing trading and long-term holding. A price of $175 would represent a 57% decline off its recent peak, closest to the largest retraction of 60% only during the COVID firesale. For long-term-oriented investors, a price of $175 would translate into a 26.4x EV/EBITDA, leaving a large margin of safety. It is about ½ of the multiples used by leading institutes such as BofA (55x) and close to its multi-year bottom of 23.6x observed in early 2020. Such a margin of safety shortens the timeframe for its nonlinear growth potential such as production ramp-up and FSD to catch up with its current valuations.
Be the first to comment