

marchmeena29
Investment thesis
I consider Wix.com Ltd. (NASDAQ:WIX) as fundamentally undervalued and underscored the opportunities for long-term investors in my previous article. Now, I want now to focus on the short-term risks and opportunities, as Wix.com stock is technically in a stronger position since it bottomed in June 2022, and has since formed a quite resilient uptrend.
In this article, I will also analyze the company’s industry and how the stock has and is performing, compared to its most relevant references. While in my article published on April 13, I suggested the stock was not offering a safe entry point for more short-term investors, I now give my opinion in this sense, based on relevant technical aspects, which leads me to confirm my previously given buy rating. I also underscore the possible risks the stock is now facing, as the broader market and the company’s industry are still in a significant downtrend.
A quick look at the big picture
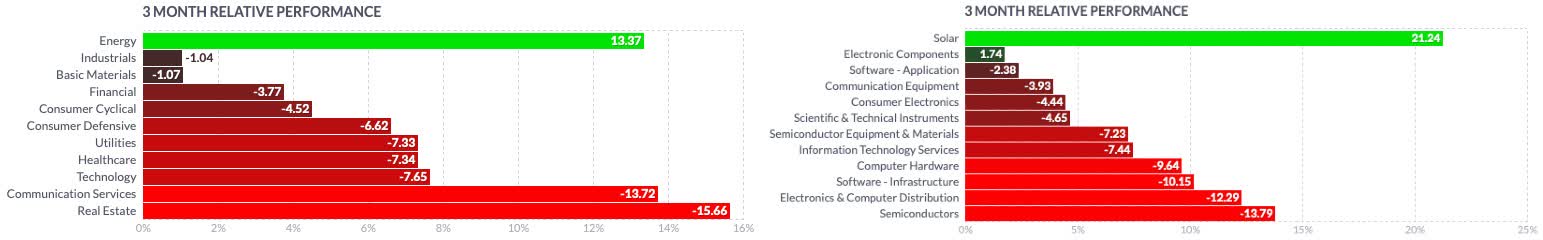
The technology sector in the U.S. has lost steam after its sharp rebound during July and August and has since given back all of its gains, being one of the major losers in the past year and over the last 3 months. While companies in the information technology services industry are not among the biggest losers in the technology sector, they seem to struggle to build up relative strength. Companies in the semiconductor industry, electronics firms, computer distributors, and infrastructure software manufacturers are instead leading the recent decline, while the solar industry reports significant relative strength. The actual energy crisis in parts of the world and the increasing demand for renewable energy are driving forces for those companies.
finviz finviz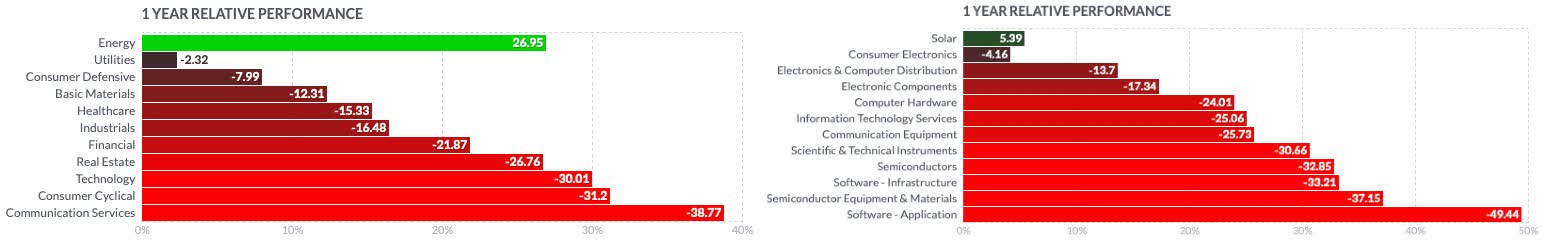
Looking at more specific groups of the industry, the NASDAQ US Benchmark Software & Computer Services Index (NQUSB101010) marked its All-Time-High (ATH) on November 19, 2021, and has since severely corrected, losing 37% until bottoming on June 16, 2022. It since attempted to break out in August, but failed and got rejected at its EMA100 on its weekly chart, and dropped even further, marking a new low in the last market session, while reporting increased relative weakness when compared to the broader Vanguard Information Technology ETF (VGT).
Author, using TradingView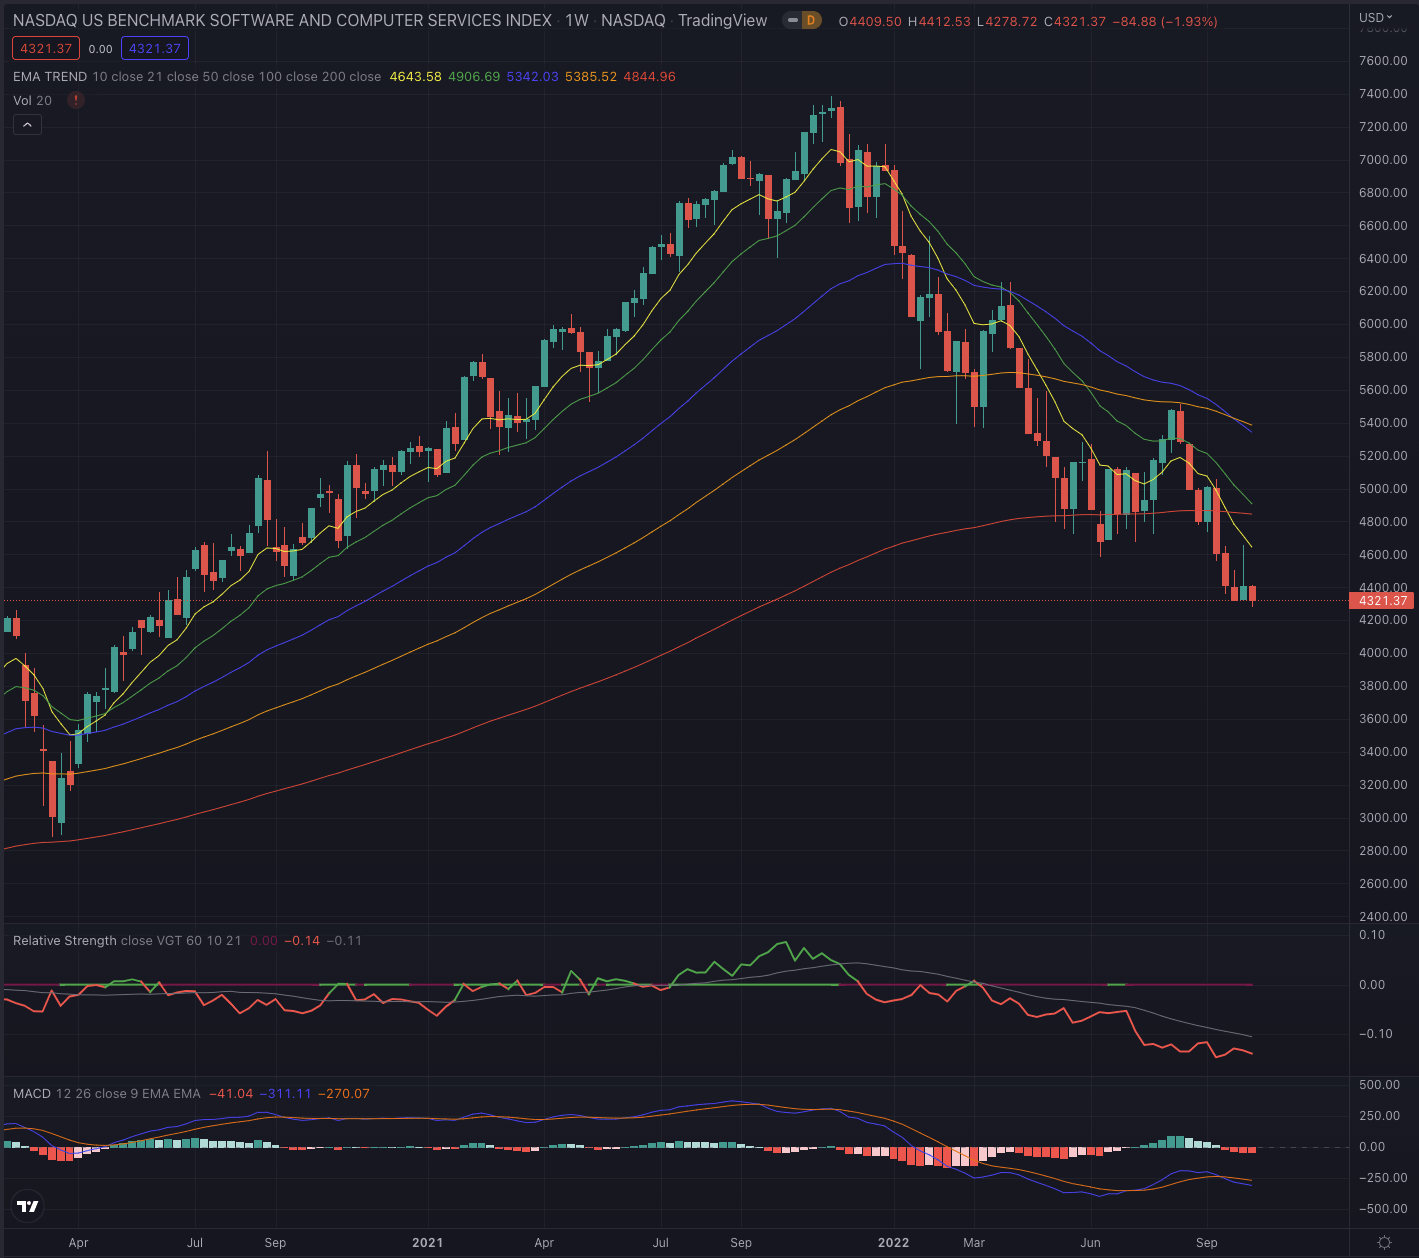
Among Wix.com’s biggest customer bases are companies in the consumer discretionary industry. The Amplify Online Retail ETF (IBUY) peaked on February 16, 2021, and since has suffered from a long decline, marked by significant relative weakness since August 2021 when compared to the broader small-cap market tracked by the iShares Russell 2000 ETF (IWM). It has now reached the pandemic-lows levels.
Author, using TradingView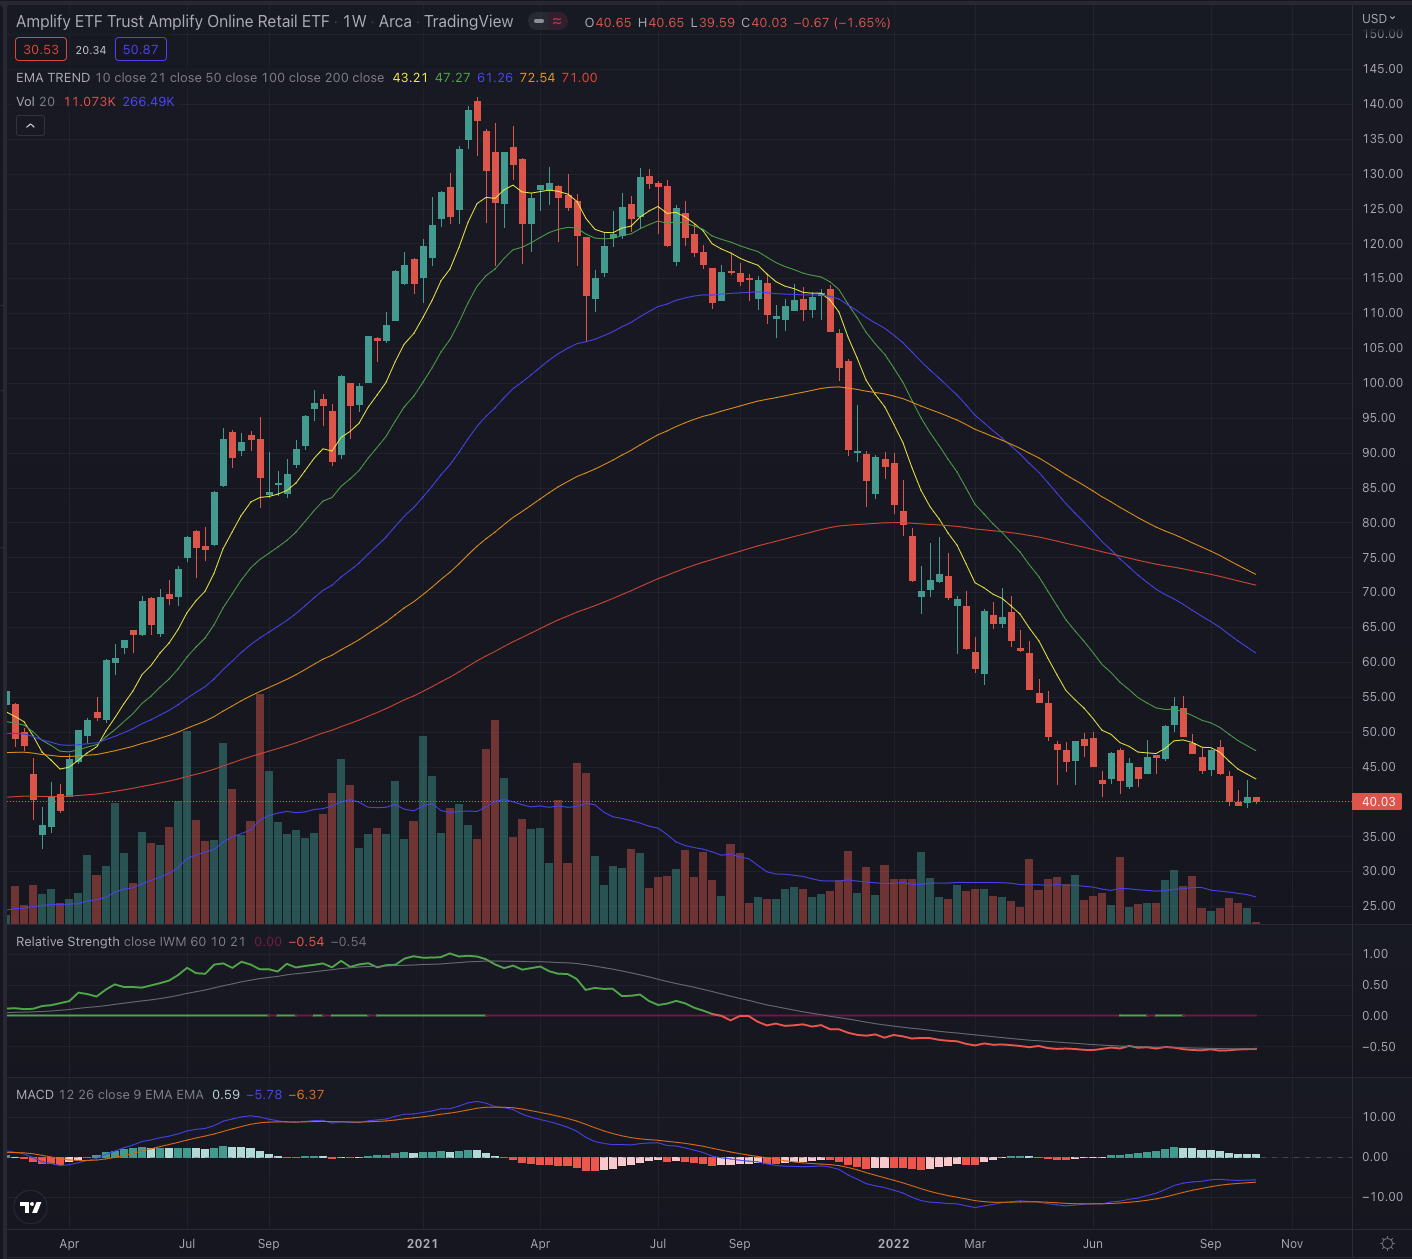
Analyzing the historical performance even further, Wix’s stock performed significantly better than its main references for most of the time from 2018 through 2021, as it began to decline significantly, resulting in only 8.41% performance in the past 5 years, while all its references outperformed the stock. Only the Amplify Online Retail ETF reported a similar performance. The Vanguard Information Technology ETF is leading this comparison with over 97% performance, while even the broader S&P 500 (SP500) and the iShares U.S. Consumer Discretionary ETF (IYC) have achieved a performance above 40% during the analyzed time.
Author, using SeekingAlpha.com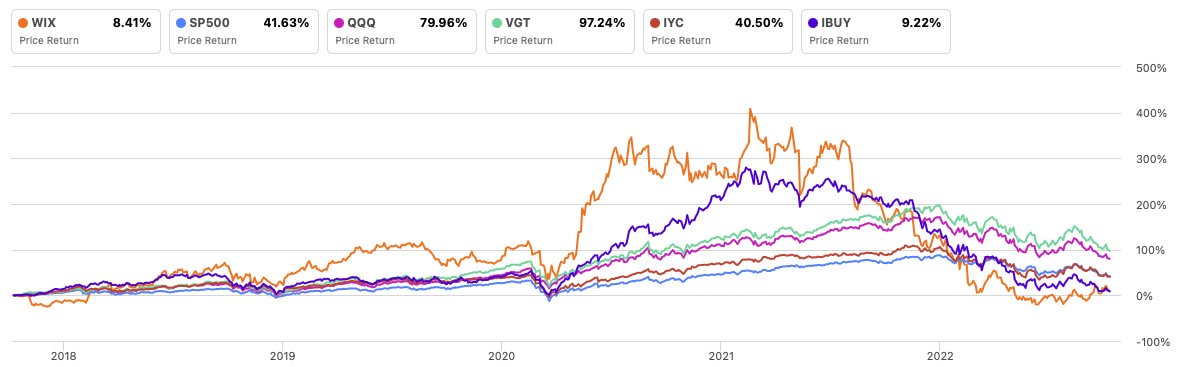
Where are we now?
In my last article, Wix.com Has More Potential Than The Market Believes, published on April 13, 2022, I expressed my positive opinion on the company. Fundamentally it looked undervalued, and it offered an opportunity for long-term investors. On the other hand, I noted that technically the stock was still in a downtrend and I warned of a prolonged correction as the stock still didn’t bottom, and therefore I did not see a safe entry point for short-term traders.
The stock has since lost almost 44% of its value, until bottoming on June 13, where it immediately reversed by returning 63% until September 20. On its weekly chart, the EMA10, which was acting as trailing resistances, has turned to be the stock’s trailing support, as the stock is now hovering around its EMA21.
Author, using TradingView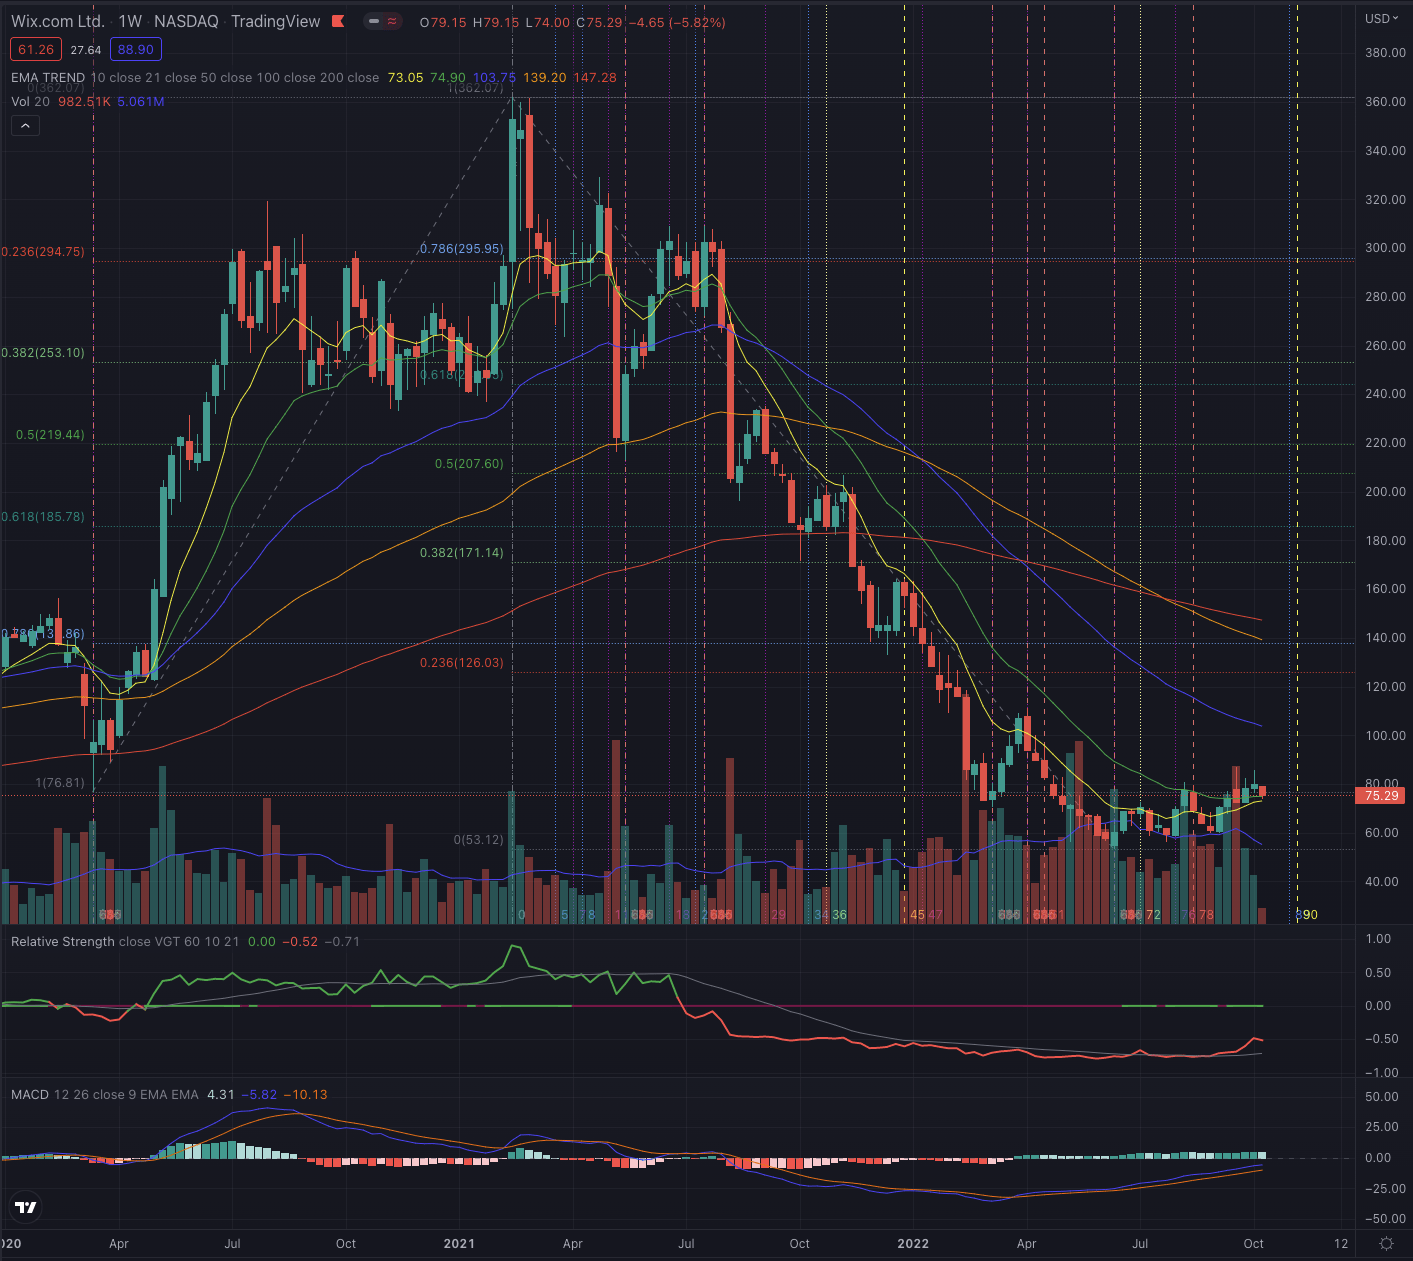
The stock has since lost almost 44% of its value, until bottoming on June 13, where it immediately reversed by returning 63% until September 20. On its weekly chart the EMA10, which was acting as trailing resistances, has turned to be the stock’s trailing support, as the stock is now hovering around its EMA21.
Author, using TradingView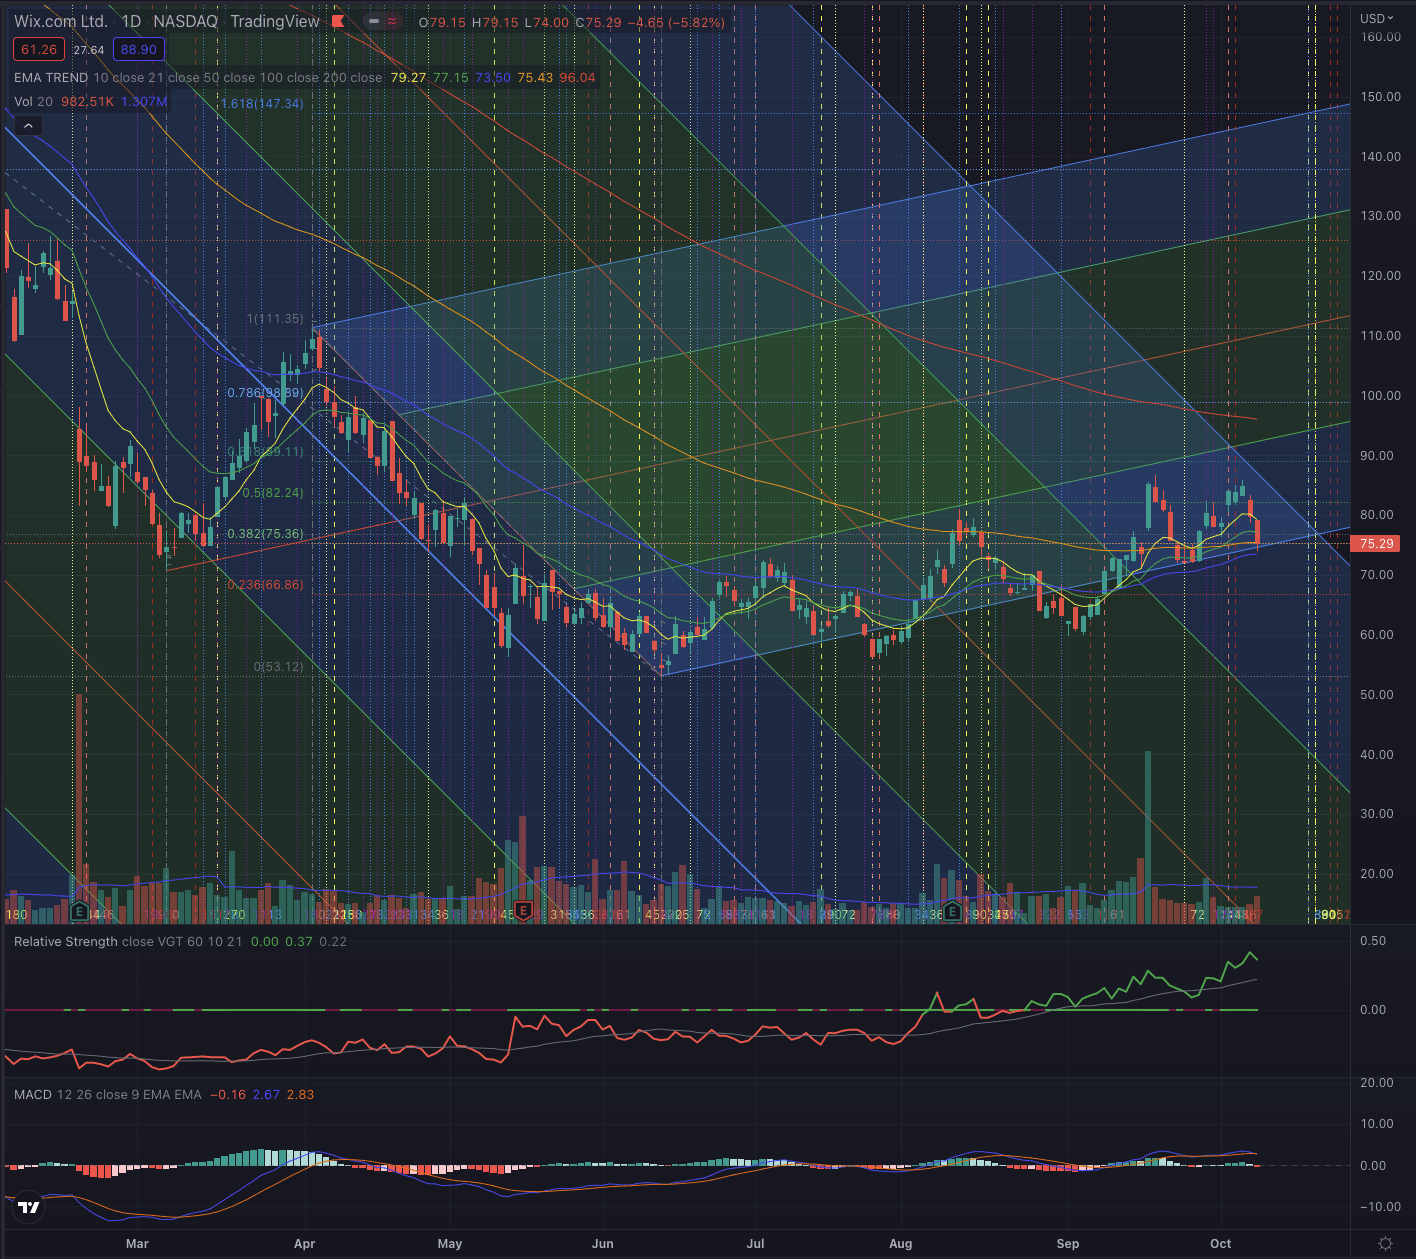
On Wix’s daily chart, we can observe how the stock is following the trendline I identified in June and has broken over its EMA100 with a massive volume increase. Technically the stock is now in a quite positive situation. Despite the volume having again declined, the stock has still positive momentum and reports a significant and increasing relative strength. The stock overcame major overhead resistances and is seemingly supported by its EMA50, its EMA100, and the upwards trending channel.
What is coming next?
I expect the stock to continue performing positively in the short term, as it bottomed in June and seems quite resilient in its newly formed uptrend. The stock’s overhead resistance is situated at its EMA200, and most likely around $85-$89, at $99, and further around $111.
Author, using TradingView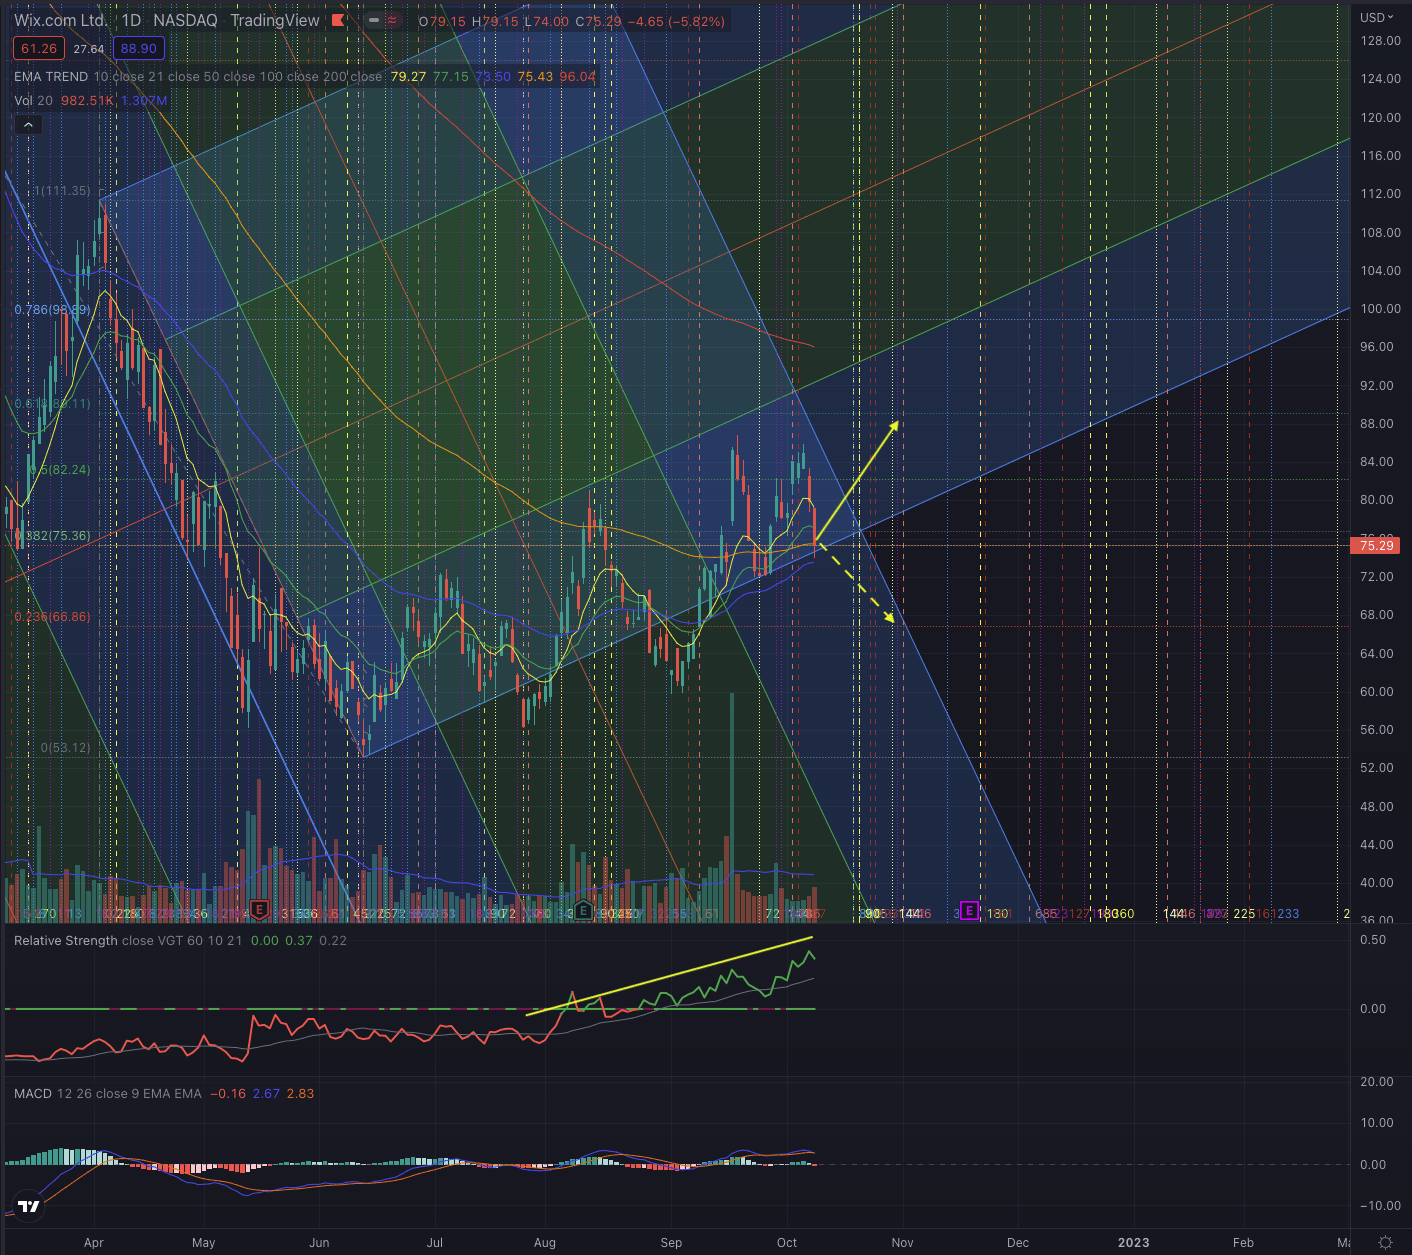
The stock is approaching a possible critical point where I estimate it could be repeatedly testing its major supports. Investors should closely observe the price action and how the stock behaves at these crucial support levels, and how an eventual attempt to overcome its resistance is confirmed or rejected, by particularly observing the trading volume in both directions. My favorite scenario would see the stock forming a short-term rally until overcoming the recent heights, projecting the stock toward $89. If the stock instead fails to reverse and breaks under its strong support, the next likely target is seen at around $87. As a breakdown toward those levels could bear the risk of seeing even further losses, I would define my contingency plan and position my stops accordingly.
The bottom line
Technical analysis is not an absolute instrument, but a way to increase investors’ success probabilities and a tool allowing them to be oriented in whatever security. One would not drive towards an unknown destination without consulting a map or using a GPS. I believe the same should be true when making investment decisions. I consider techniques based on the Elliott Wave Theory, as well as likely outcomes based on Fibonacci’s principles, by confirming the likelihood of an outcome contingent on time-based probabilities. The purpose of my technical analysis is to confirm or reject an entry point in the stock, by observing its sector and industry, and most of all its price action. I then analyze the situation of that stock and calculate likely outcomes based on the mentioned theories.
Wix.com has many elements that indicate the stock has technically reversed and after a long and severe losing streak could now be forming its next uptrend. While its major references are still negatively oriented, the stock has shown its ability to outperform them and is now again building significant relative strength. My valuation model based on the company’s fundamentals analyzed in April 2022, was hinting at the company’s likely undervaluation, and the technicals are now also turning in the stocks’ favor, as it broke out of major resistance levels and has been quite resilient after every pullback.
I, therefore, confirm my previously rating given on fundamental aspects, and mostly oriented toward long-term investors, also in a more short-term perspective, as the stock could offer significant returns also for swing and momentum traders. I would keep my stop-loss orders tight, to avoid being caught in a more significant pullback under Wix.com’s most important support levels.
Be the first to comment