

JHVEPhoto
Target (NYSE:TGT) reported Q3 results for FY 2023 before the market opened on Nov. 16, substantially missing expectations on earnings, and slightly beating on revenue. The earnings release reduced guidance for Q4 and provided a generally downbeat outlook. Brian Cornell, Target’s CEO, attributed the weak Q3 results to changes in customer behavior as a result of inflation, rising interest rates, and general economic uncertainty.
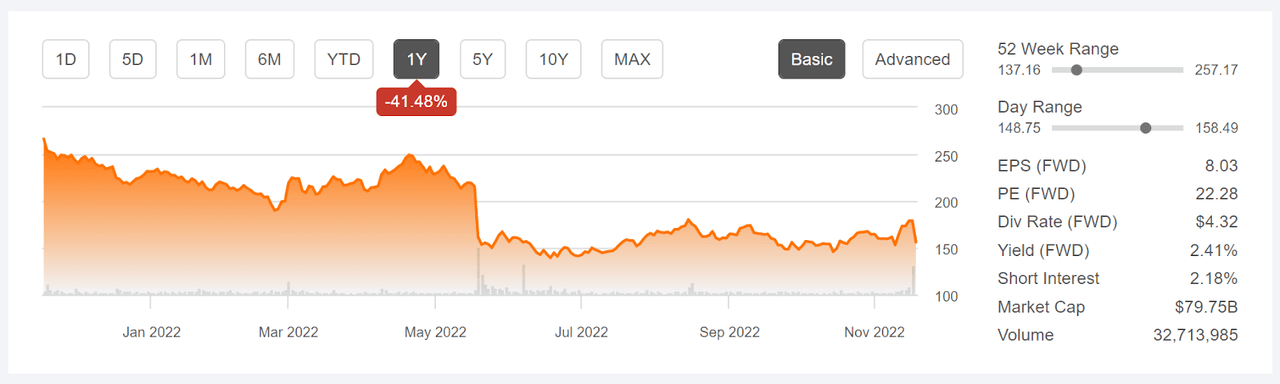
Following the earnings report, shares fell about 13% during regular market hours on the 16th. Prior to today’s drop, TGT had returned -21% for the year-to-date, as compared to -1.6% for the discount store industry (as tracked by Morningstar) and -15.1% for the S&P 500 (SPY). Including today’s drop, TGT has fallen 41.5% over the past 12 months (not including dividends).
Seeking Alpha
12-Month price history and basic statistics for TGT (Source: Seeking Alpha)
Target has been struggling with managing inventory levels and the product mix in stores in 2022. At mid year, the company needed to sell off inventory at steep discounts to make room for other product categories. Part of the mismatch between inventory and demand was attributed to changing consumer preferences coming out of COVID.
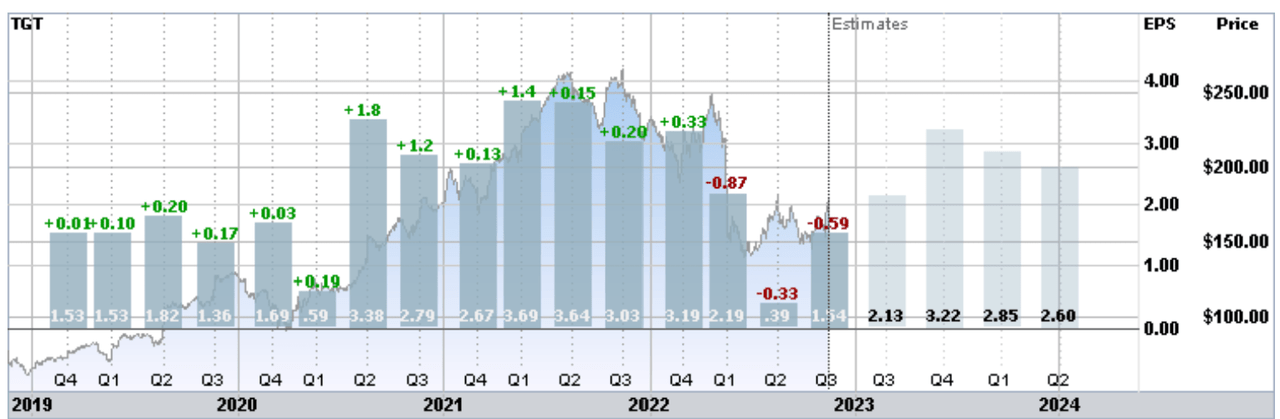
TGT’s earnings increased substantially in mid-2020 and stayed elevated through Q4 of FY 2022 (reported on March 1, 2022). Earnings have been substantially lower in the subsequent three quarters, missing expectations in each. The consensus view is that the earnings drop is a short-term phenomenon, as evidenced by the consensus estimates for an earnings recovery in the coming year. The consensus outlook for EPS growth over the next three to five years is 10.56% per year.
ETrade
Trailing (four years) and estimated future quarterly EPS for TGT. Green (red) values are amounts by which EPS beat (missed) the consensus expected value.
I last wrote about TGT on May 24, 2022, at which time I assigned a buy rating. TGT reported poor results for Q1 on May 18, and the shares immediately dropped 25%. My analysis was intended to determine whether the market response was an overreaction. The key concerns were largely about whether the company would be able to deal with its inventory / demand mismatches. In formulating my opinion, I looked at fundamentals, along with two forms of consensus outlooks.
The first of these was the well-known Wall Street analyst consensus outlook. The second was the market-implied outlook, a probabilistic price forecast that represents the consensus view implied by the prices of call and put options. The Wall Street consensus outlook was a buy, with a consensus 12-month price target that implied 30% to 40% in price appreciation over the next year. The market-implied outlook to mid-January of 2023 was neutral, albeit with a fairly high expected volatility (40% annualized).
With the substantially-improved valuation after the post-earnings drop, the bullish Wall Street consensus outlook, and the neutral market-implied outlook, I concluded that the shares had gotten oversold and I assigned a buy rating. From the market closing price on May 24, and including the big drop on Nov, 16, TGT has returned a total of +5.0% (including dividends), as compared to +1.2% for the S&P 500 (SPY).
For readers who are unfamiliar with the market-implied outlook, a brief explanation is needed. The price of an option on a stock is largely determined by the market’s consensus estimate of the probability that the stock price will rise above (call option) or fall below (put option) a specific level (the option strike price) between now and when the option expires. By analyzing the prices of call and put options at a range of strike prices, all with the same expiration date, it’s possible to calculate a probabilistic price forecast that reconciles the options prices. This is the market-implied outlook. For a deeper explanation and background, I recommend this monograph published by the CFA Institute.
With about 5 ½ months since my last analysis and the big sell-off following the Q3 performance report, I have calculated updated market-implied outlooks and compared these with the current Wall Street consensus outlook, as in my previous analysis.
Wall Street Consensus Outlook for TGT
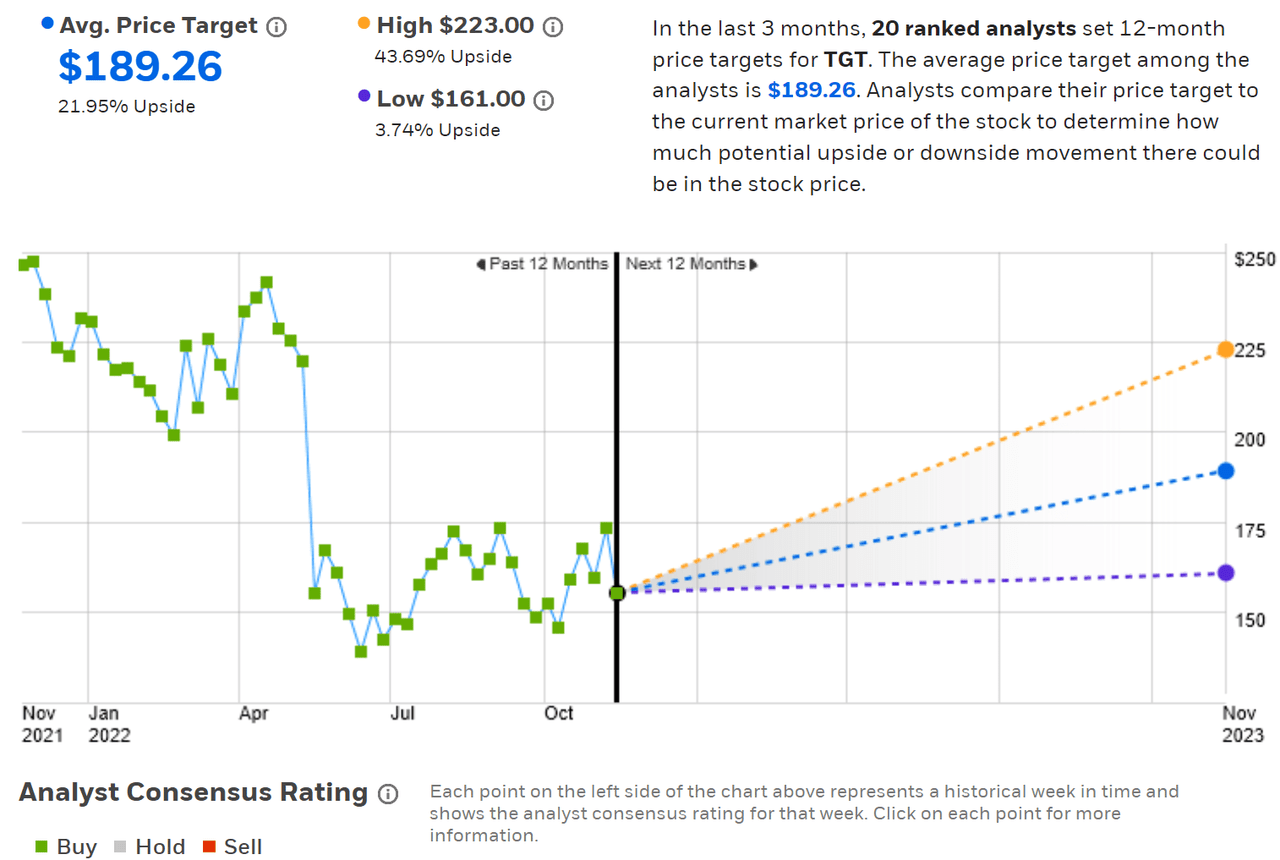
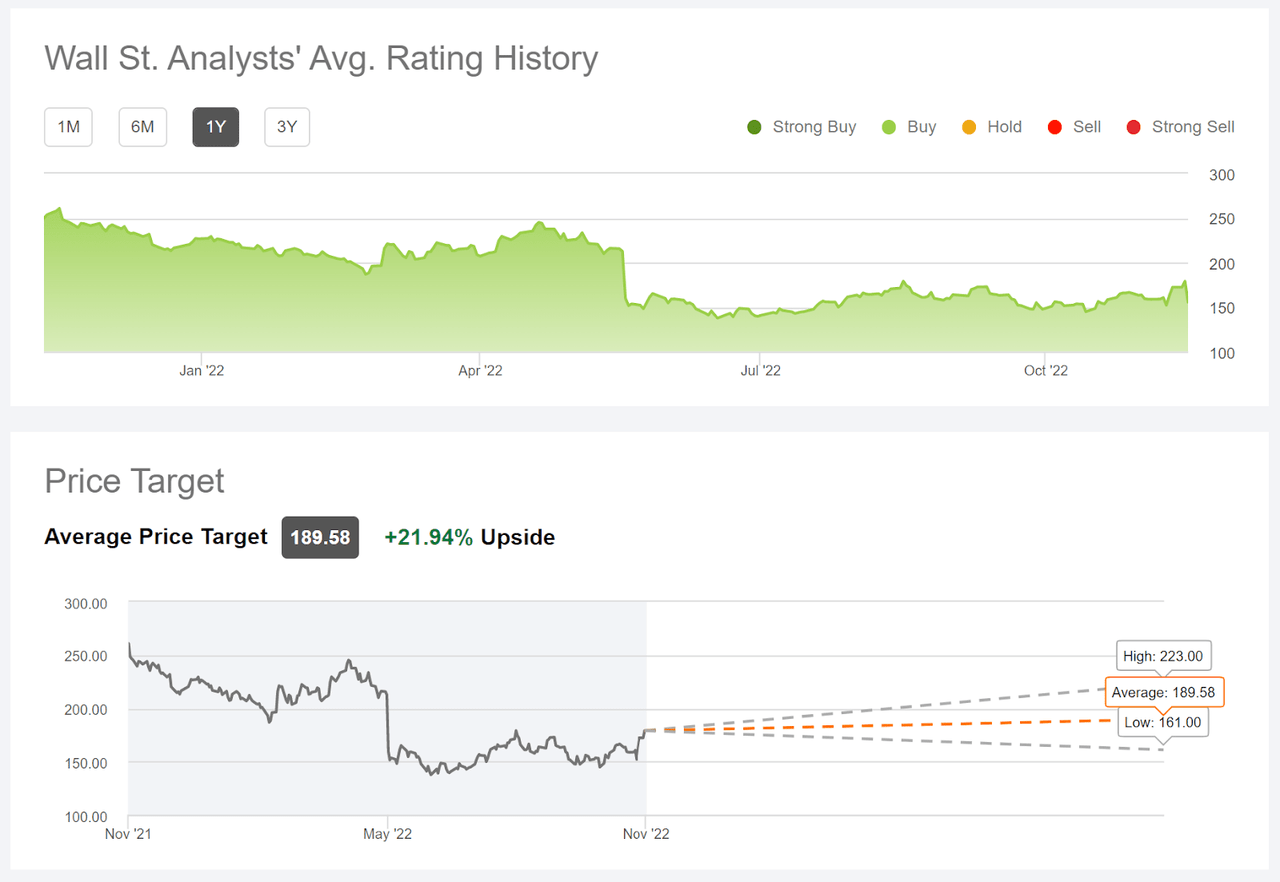
ETrade calculates the Wall Street consensus outlook for TGT by aggregating the views of 20 ranked analysts who have published ratings and price targets over the past three months. The consensus rating is a buy and the consensus 12-month price target is 21.95% above the current share price (which includes the 13% drop on Nov. 16.
ETrade
Wall Street analyst consensus rating and 12-month price target for TGT (Source: ETrade)
Seeking Alpha’s version of the Wall Street consensus outlook uses the views of 32 analysts who have published ratings and price targets for TGT over the past 90 days. The consensus rating is bullish, as it has been for all of the past year, and the consensus 12-month price target implies a 21.9% gain (not including dividends).
Seeking Alpha
Wall Street analyst consensus rating and 12-month price target for TGT (Source: Seeking Alpha)
It’s notable that Wall Street consensus rating has been a buy over all of the past year, even as the share price has fallen by more than 41%. The prevailing analyst view suggests that the recent declines are a short-term anomaly rather than indicating a long-term change in TGT’s value proposition. The consensus price target indicates a total return of 24.3% (adding the dividend), a substantial recovery over the next year.
Market-Implied Outlook for TGT
I have calculated the market-implied outlook for the 2.1-month period from now until January 20, 2023, for the 6.9-month period from now until June 16, 2023, and for the 14-month period from now until Jan. 19, 2024, using the prices of call and put options that expire on each of these dates. I selected these specific expiration dates to provide a view through the end of 2022, to the middle of 2023, and through the end of 2023.
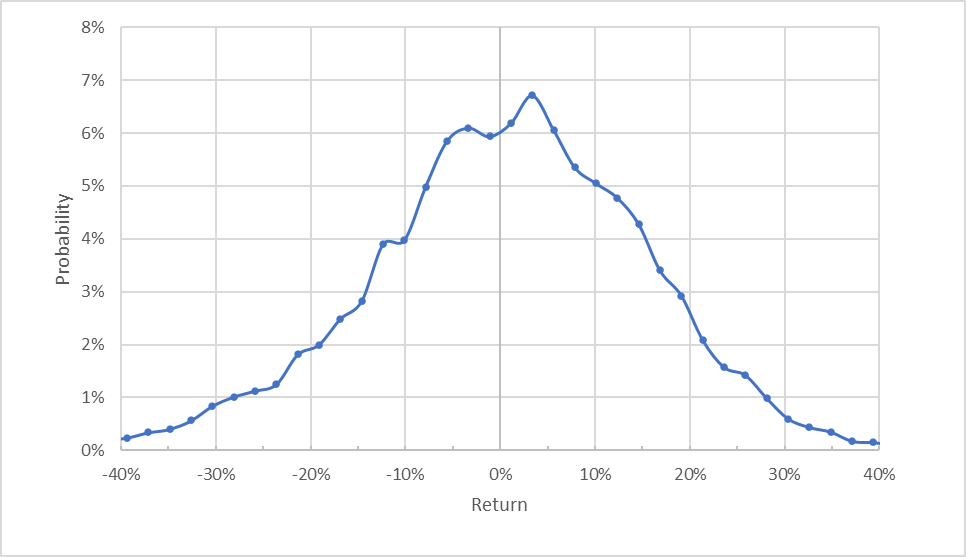
The standard presentation of the market-implied outlook is a probability distribution of price return, with probability on the vertical axis and return on the horizontal.
Geoff Considine
Market-implied price return probabilities for TGT for the 2.1-month period from now until January 20, 2023 (Source: Author’s calculations using options quotes from ETrade)
The outlook for the next 2.1 months exhibits a tilt favoring positive returns, a bullish inclination. The maximum probability corresponds to a price return of +3.4% over this period. The expected volatility calculated from this outlook is 37.5% (annualized), which is quite high, but is consistent with the 40% estimated volatility that I calculated back in May.
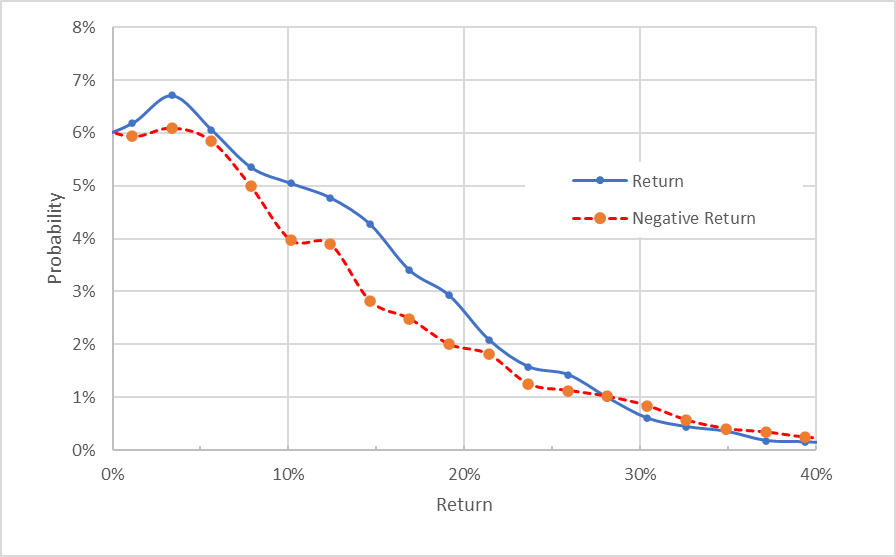
To make it easier to compare the relative probabilities of positive and negative returns, I rotate the negative return side of the distribution about the vertical axis (see chart below).
Geoff Considine
Market-implied price return probabilities for TGT for the 2.1-month period from now until January 20, 2023. The negative return side of the distribution has been rotated about the vertical axis (Source: Author’s calculations using options quotes from ETrade)
This view really emphasizes that the probabilities of positive returns are consistently higher than those for negative returns of the same magnitude, across a wide range of the most probable outcomes (the solid blue line is above the dashed red line over the left ⅔ of the chart above).
Theory indicates that the market-implied outlook is expected to have a negative bias because investors, in aggregate, are risk averse and thus tend to pay more than fair value for downside protection. There’s no way to measure the magnitude of this bias, or whether it is even present, however. The expectation of a negative bias reinforces the bullish interpretation of this outlook.
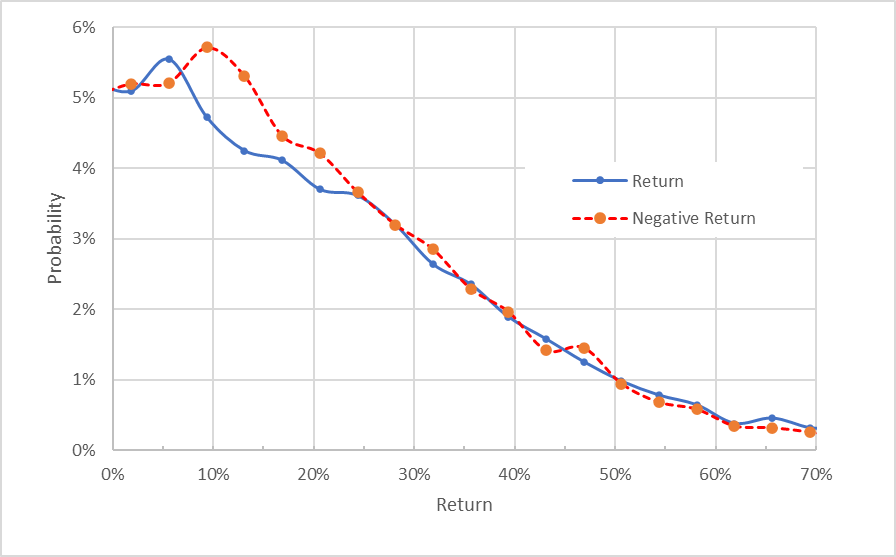
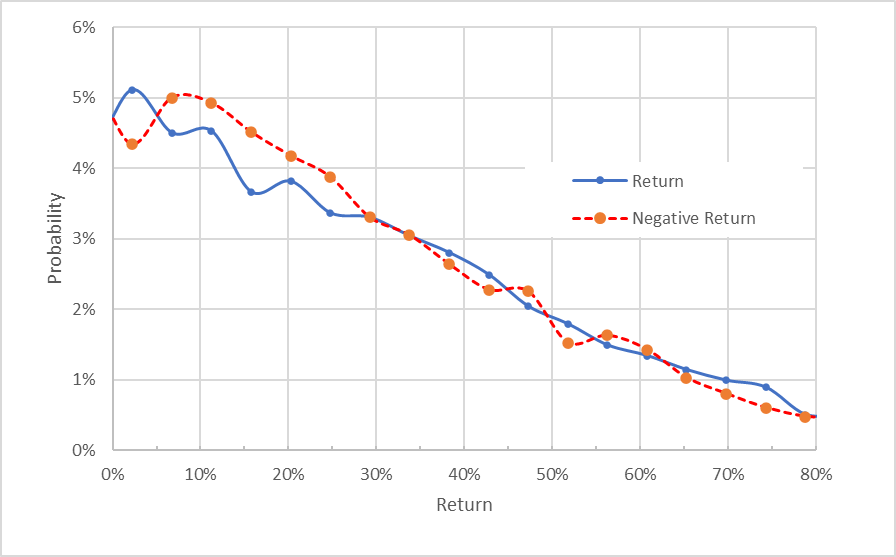
The market-implied outlooks for the 7-month period from now until June 16, 2023, is quite different from the shorter-term view. The probabilities of negative returns are elevated from price moves in range of +/-24% (the dashed red line is above the solid blue line over almost all of this range), while the probabilities of larger-magnitude price moves are very similar (the solid blue line and the dashed red line are right on top of one another for returns greater in magnitude than +/-24% (above 24% on the horizontal axis of the chart below). Given the expectation of a negative bias due to investor risk aversion, I interpret this outlook as neutral. The expected volatility calculated from this outlook is 39.6% (annualized).
Geoff Considine
Market-implied price return probabilities for TGT for the 7-month period from now until June 16, 2023. The negative return side of the distribution has been rotated about the vertical axis (Source: Author’s calculations using options quotes from ETrade)
The market-implied outlook for the next 14 months, from now until Jan. 19, 2024, is very similar to the seven-month outlook. The expected volatility calculated from this outlook is 39.1% (annualized). I interpret this outlook as neutral.
Geoff Considine
Market-implied price return probabilities for TGT for the 14-month period from now until January 19, 2024. The negative return side of the distribution has been rotated about the vertical axis (Source: Author’s calculations using options quotes from ETrade)
The market-implied outlooks tell a consistent story, with a somewhat bullish view to mid-January 2022, shifting to a neutral stance to the middle of 2023 and into the start of 2024. The expected volatility is quite stable, rising slightly from about 37.5% to 39% over this period. Taken together, I interpret the outlooks as suggesting that the shares have gotten a bit oversold and have a decent probability for a short-term recovery, but that the longer-term view is a hold.
Summary
Target has made significant short-term mistakes in logistics and inventory planning over the past year. Investors have responded by aggressively selling off the shares after poor quarterly results. The longer-term view suggests that the company’s fundamental business model is sound, however. The Wall Street consensus outlook is a buy, with a consensus 12-month price target that corresponds to a 24.3% total return over the next year.
As a rule of thumb for a buy rating, I want to see an expected 12-month total return that is at least ½ the expected volatility. Taking the Wall Street outlook at face value and using the expected volatility from the market-implied outlook (39%), TGT meets this criterion. The market-implied outlook is somewhat bullish to mid-January of 2023 and neutral for 2023 as a whole. I’m maintaining my buy rating on TGT, but I plan to revisit this before the middle of 2023.
Be the first to comment