

Sundry Photography
This week, Target (NYSE:TGT) reported second quarter earnings of $0.39 per share, which is down 89% from last year’s earnings of $3.65 per share. The decrease in earnings is a result of charges related to reducing unwanted inventory. Moving past this one-time charge, the company expects to grow in the low to mid single-digit range. This growth rate does not justify the stock’s current valuation. At 13 times earnings (based on fiscal year-end 2021), the stock is trading at a significant premium relative to its growth rate. There are also other reasons to give an investor pause.
In the last six months, Target’s cash holdings decreased 81% from $5.9 billion to under $1.2 billion. For a company that has operating margins in the single digits, it becomes a challenge to replenish that cash position without borrowing. As a result, Target’s cash position is now less than its current debt, which puts it in a negative cash-to-debt ratio.
Google Finance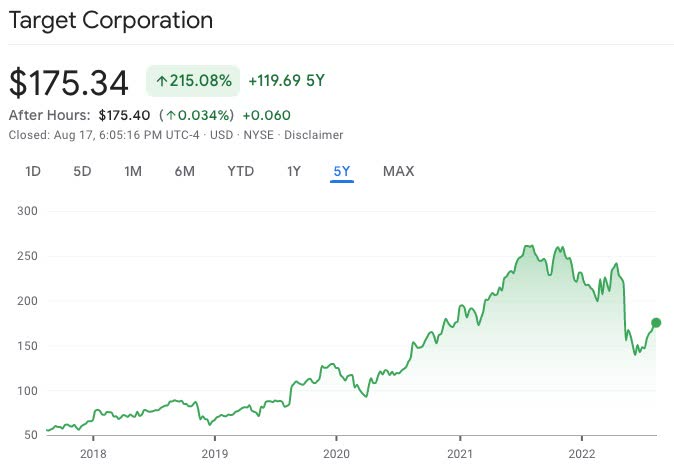
Analysis
Hold Rating: I have a Hold rating for Target’s stock with a five-year target price of $270 per share.
In my analysis, I believe the company can achieve a 6% net margin over the next 5 years with an annual revenue growth rate of 5.5%.
With Target’s stock currently trading at 13 times earnings, it is not trading at a discount relative to its growth prospects. As a result, I would rate the stock a Buy if it were to trade at $145 per share presuming the company’s fundamentals and business prospects remain the same or improves.
With the company still having $9.7 billion remaining capacity authorized under its share repurchase program, I am estimating a decrease in outstanding shares by approximately 56 million shares based on current prices, which should provide a boost to earnings by 13% and returns by 18%.
Below is a table contrasting the company’s current metrics and stock price to the 5-year estimate:
| Target |
Current* (as of 8/17/22) |
5-Year Estimate |
|
Revenue (in millions) |
$106,005 |
$131,322 |
|
Net Margin (%) |
6.55% |
6.0% |
|
Net Income (in millions) |
$6,946 |
$7,879 |
|
# Outstanding Shares |
493,000,000 |
437,000,000 |
|
Net Income per Share |
$14.10 per share |
$18.02 per share |
|
Price/Earnings (P/E) Ratio |
12.7 |
15 |
|
Stock Price |
$175.34 |
$270 |
Source of company metrics: Morningstar, Target
*Current metrics based on fiscal year end 2021
Author’s Note
The purpose of my analysis is to provide a concise and transparent calculation in deriving a price target in the future, which in my hope will show the reader what their potential return is if they were to buy the stock (for buy ratings) at current prices.
As a long term investor, I provide a 5-year price target. In identifying a stock for a Buy rating, I look for stocks that can double in price within 5 years. This would produce close to a 20% annual return which would still exceed the market’s long term average annual return of 8.91%.
When estimating a target price in the future, I try to be as transparent as possible in the methodology and metrics I use in my analysis and research to gain the reader’s confidence in my conclusions. This is a methodology that I have successfully used for over 25 years as an investment adviser and portfolio manager through the bull market of the 1990s, the dot com bubble, the credit crisis of 2008-2009 and more recently through the Great Resignation.
To better understand how to read the table above, read my previous article Meta: Attractive Valuation.
Be the first to comment