

wildpixel
I will start with the following: causalities and even associations of variables are impossible to prove in economics and the market, although this is a regular practice.
There have been three periods of low inflation since 1950:
- November 1958 to December 1965
- January 1992 to December 1999
- October 2012 to March 2021
The above three periods of low inflation (less than 3% year-over-year) had something in common: asset inflation and strong equity market uptrends (SPX).
Monthly Chart: CPI (Black), S&P 500 (Green), and Gold (Orange) (Price action lab Blog – Norgate Data)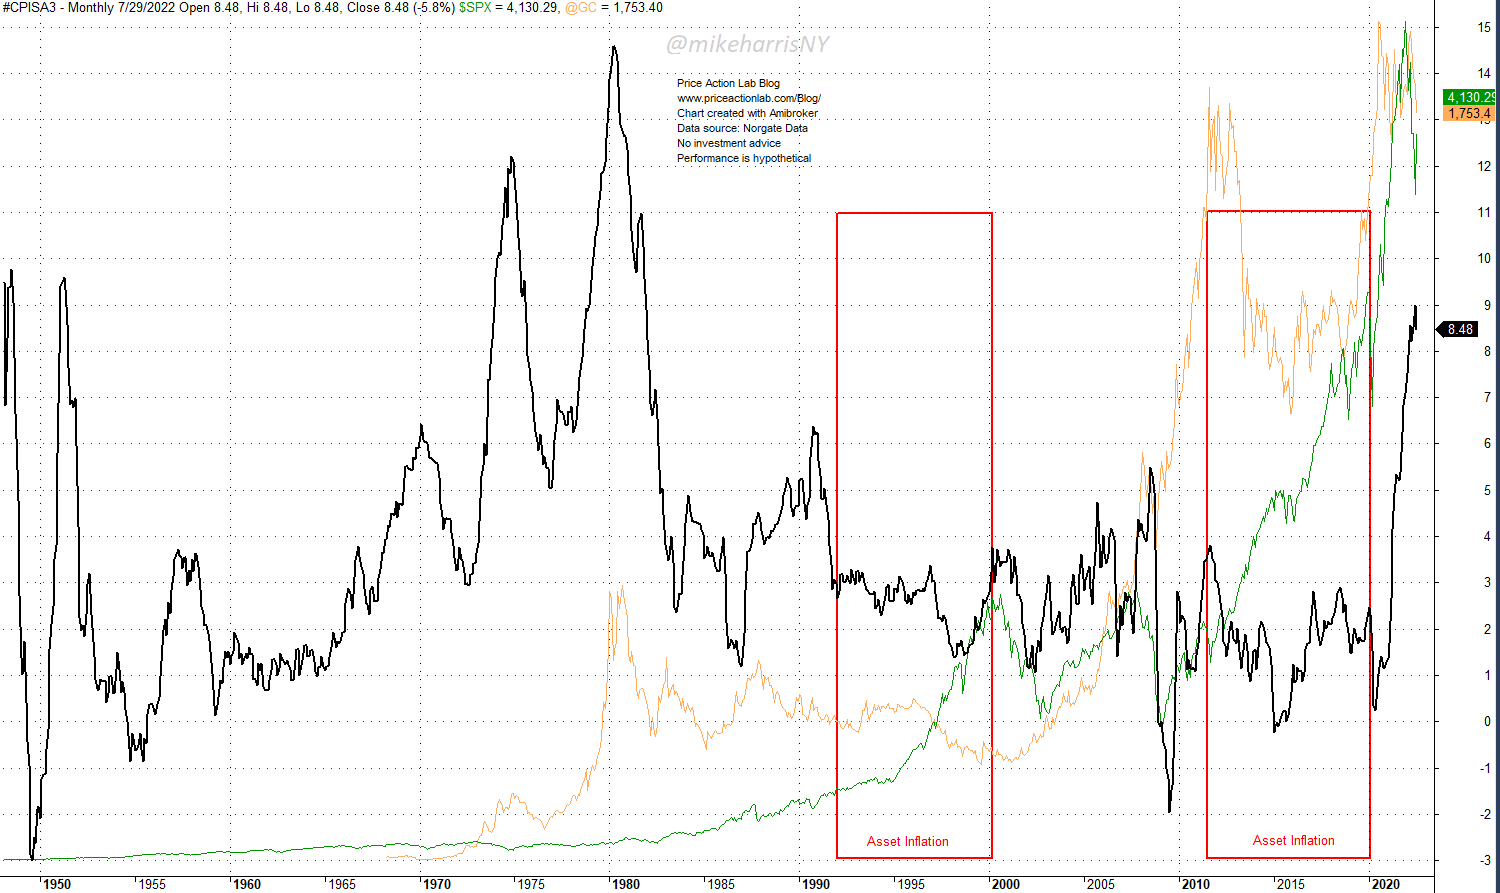
In the above chart, the two most recent asset inflation periods are shown: the 90s uptrend and the 2010s uptrend.
- The 90s uptrend was driven by irrational exuberance, according to the Chairman of the Fed during that time.
- The 2010s uptrend was driven by excessive stimulus in the form of quantitative easing.
But why did inflation stay low during both of these periods?
One theory is that asset inflation suppresses, or absorbs, inflation in the economy.
Another theory is that the statistics were manipulated due to a change in the calculation method of the CPI.
This article does not subscribe to any theory because it is impossible to prove them. This is what we know:
- The “low inflation” period from January 1992 to December 1999 with simultaneous “asset inflation” ended with the dot com bust.
- The low inflation period from October 2012 to March 2021 with simultaneous “asset inflation” ended with a sharp rise in inflation and a large correction in equities.
Let us look at these two cases separately.
(1) After the dot-com bust, inflation initially fell, but then kept rising, reaching 5.5% in July 2008. Then, the Lehman Brothers’ collapse sent the economy into a deflationary spiral. From 5.5%, the CPI fell to -2% by July 2009.
The deflationary spiral was the main driver of quantitative easing. Many economists expected hyperinflation to result from the excessive stimulus in the early days of quantitative easing, but that did not materialize. By September 2011, inflation was at 3.8% and then started to fall again.
(2) In January 2015, inflation fell to a slightly negative level, and quantitative easing was maintained. Inflation rose in 2018 but fell again to close to 0% due to the 2020 pandemic. This was an opportunity for another round of stimulus and helicopter money. Asset inflation was rampant.
Was the asset inflation in both periods described above due to low inflation, or was the low inflation due to asset inflation?
There can be no answer to this question. What we know is that in 2008, inflation was violently terminated by deflation. The specific trigger is not important. We also know that during the violent reduction in inflation in 2008, stocks crashed.
Gold started rising along with inflation in mid-2002. The gold uptrend continued through the deflationary spiral of 2008 and ended in late 2011 after inflation peaked below 4%, and it became evident there would not be any hyperinflation or high inflation.
However, after a crash towards $1,000 per ounce in early 2016, gold started rising again, although inflation was low, and made new all-time highs in August 2020.
Now, gold is not an inflation hedge theoretically, but anything can be considered an inflation hedge if enough market participants decide it is one, and in the case of gold, many market participants have ruled it is an inflation hedge.
Despite a very strong uptrend in the US dollar and falling stock prices, gold prices have remained relatively high. Many market participants are not expecting a quick resolution on the inflation front.
More importantly, small rate hikes and verbal interventions will not tame inflation. Something drastic should happen, as in late 2008, to flip the switch from inflation to deflation.
The energy crisis and the geopolitical uncertainty are constraining monetary policy, and these can serve as the drivers of the next deflationary cycle. In that scenario, stocks will initially crash, but a new round of quantitative easing will drive the new boom cycle until the next bust.
Summary
Taming inflation with rate hikes may not be sufficient. Elevated gold prices, despite a strong US dollar, indicate expectations for higher inflation. A recession may not be enough, and a deflationary spiral may be required to lower inflation. As during the financial crisis, equities will crash initially but then go into an uptrend due to another round of quantitative easing. Caveat emptor: This time is different.
Be the first to comment