

Pgiam/iStock via Getty Images
Investment Thesis
Big money moves markets, but not always permanently. With active and evolving political economics there is almost always change – sometimes more political than economic. How to discern stock by stock impact prospects?
The key to such sorting is comparisons. But they must be of like features, ultimately winding up in their impact on coming market prices for specific investment issues.
We find volume trade orders by institutional investors have high credibility, are current, and provide good comparability when viewed through the active screen of derivative securities markets. When substantial costs are undertaken to protect market-makers in their implementation of Billion-dollar portfolio adjustments, the specific reasoning behind trade orders does not have to be evident.
It turns out that the limits of coming price change expectations provide dynamic measures of specific stock changes in reward~risk balances, which in turn offer active investment guidance to portfolio management. Guidance which is usually ignored by passive-investing buy & holders.
Today’s examples are Tesla Inc. (NASDAQ:TSLA) and Magna International, Inc. (MGA)
Description of the Subject Company
Tesla, Inc. designs, develops, manufactures, leases, and sells electric vehicles, and energy generation and storage systems in the United States, China, and internationally. The company operates in two segments, Automotive, and Energy Generation and Storage. The Automotive segment offers electric vehicles, as well as sells automotive regulatory credits. It provides sedans and sport utility vehicles through direct and used vehicle sales. The Energy Generation and Storage segment engages in the design, manufacture, installation, sale, and leasing of solar energy generation and energy storage products, and related services to residential, commercial, and industrial customers and utilities through its website, stores, and galleries, as well as through a network of channel partners. The company was formerly known as Tesla Motors, Inc. and changed its name to Tesla, Inc. in February 2017. Tesla, Inc. was incorporated in 2003 and is headquartered in Austin, Texas.
Source: Yahoo Finance
Yahoo Finance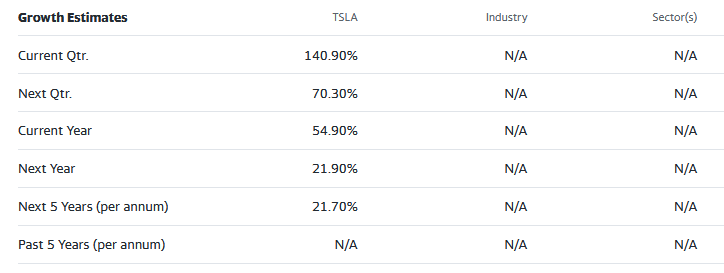
Description of Investment Alternative
Magna International Inc. designs, engineers, and manufactures components, assemblies, systems, subsystems, and modules for original equipment manufacturers of vehicles and light trucks worldwide. The company operates through four segments: Body Exteriors & Structures, Power & Vision, Seating Systems, and Complete Vehicles. The company’s Complete Vehicles segment offers vehicle manufacturing and engineering services. It also designs, engineers, and manufactures tooling products. Magna International Inc. was founded in 1957 and is headquartered in Aurora, Canada.
Source: Yahoo Finance
Yahoo Finance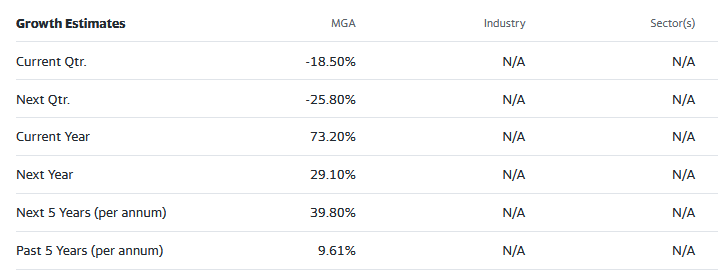
The competitive environment
When international competition enters an industry sometimes existing industry is not sufficiently competent to prevent its loss of half or more of its business. When technological competition enters the same industry they have become frantic to not have similar erosion (of their remainder) occur again.
The investing industry has been keenly aware of the technology developments in motive power for both personal and commercial transport. Many new competitors have arisen and died in the march of technological progress. Figure 1 shows how the Institutional Investing community currently appraises the Reward opportunities and Risk exposures of over a dozen current competitors.
Figure 1 (blockdesk.com – used with permission)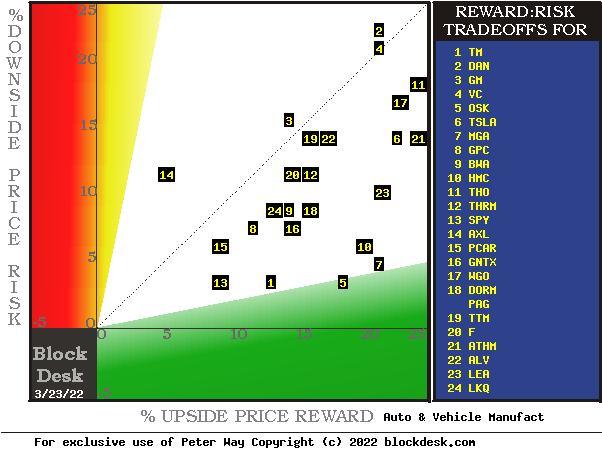
The tradeoffs here are between near-term upside price gains (green horizontal scale) seen worth protecting against by Market-makers with short positions in each of the stocks, and the prior actual price drawdowns experienced during holdings of those stocks (red vertical scale). Both scales are of percent change from zero to 25%.
The intersection of those coordinates by the numbered positions is identified by the stock symbols in the blue field to the right.
The dotted diagonal line marks the points of equal upside price change forecasts derived from Market-Maker [MM] hedging actions and the actual worst-case price drawdowns from positions that could have been taken following prior MM forecasts like today’s.
Our principal interest is in TSLA at location [6] and its principal competitive nemesis, MGA at location [7]. A “market index” norm of reward~risk tradeoffs is offered by SPDR S&P 500 index ETF at [13].
Those forecasts are implied by the self-protective behaviors of MMs who must usually put firm capital at temporary risk to balance buyer and seller interests in helping big-money portfolio managers make volume adjustments to multi-billion-dollar portfolios. The protective actions taken with real-money bets define daily the extent of likely expected price changes for thousands of stocks and ETFs.
Overall it points out that Auto Industry stocks currently have more capital gain prospect for the risks they open than does an ETF of the market-average.
But as can be seen for TSLA [6] and MGA [7] there appears to be a lot of vertical risk space and very little horizontal reward distance.
This map is a good starting point, but it can only cover some of the investment characteristics that often should influence an investor’s choice of where to put his/her capital to work. The table in Figure 2 covers the above considerations and several others.
Comparing Alternative Investments
Figure 2 (blockdesk.com – used with permission)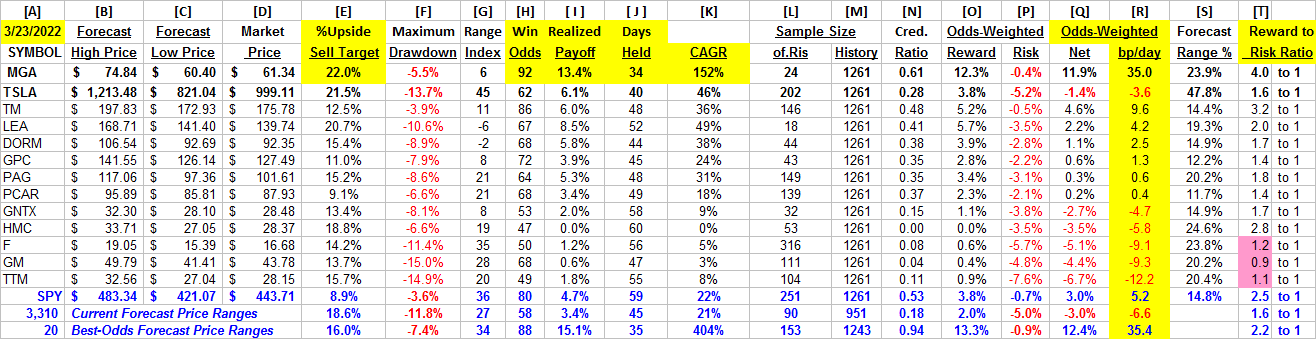
Column headers for Figure 2 define elements for each row stock whose symbol appears at the left in column [A]. The elements are derived or calculated separately for each stock, based on the specifics of its situation and current-day MM price-range forecasts. Data in red numerals are negative, usually undesirable to “long” holding positions. Table cells with pink background “fills” signify conditions typically unacceptable to “buy” recommendations. Yellow fills are of data for the stock of principal interest and of all issues at the ranking column, [R].
Readers familiar with our analysis methods may wish to skip to the next section viewing price range forecast trends for TSLA and MGA.
Figure 2’s purpose is to attempt universally comparable answers, stock by stock, of a) How BIG the price gain payoff may be, b) how LIKELY the payoff will be a profitable experience, c) how soon it may happen, and d) what price drawdown RISK may be encountered during its holding period.
The price-range forecast limits of columns [B] and [C] get defined by MM hedging actions to protect firm capital required to be put at risk of price changes from volume trade orders placed by big-$ “institutional” clients.
[E] measures potential upside risks for MM short positions created to fill such orders, and reward potentials for the buy-side positions so created. Prior forecasts like the present provide a history of relevant price draw-down risks for buyers. The most severe ones actually encountered are in [F], during holding periods in effort to reach [E] gains. Those are where buyers are most likely to accept losses.
[H] tells what proportion of the [L] sample of prior like forecasts have earned gains by either having price reach its [B] target or be above its [D] entry cost at the end of a 3-month max-patience holding period limit. [ I ] gives the net gains-losses of those [L] experiences.
[N] suggests how credible [E] may be compared to [ I ], and it is here where T is in the greatest trouble with Institutional Investors. Its long history of below-average price-gain performance despite positional and political advantage tends to damage credibility.
Further Reward~Risk tradeoffs involve using the [H] odds for gains with the 100 – H loss odds as weights for N-conditioned [E] and for [F], for a combined-return score [Q]. The typical position holding period [J] on [Q] provides a figure of merit [fom] ranking measure [R] useful in portfolio position preferencing. Figure 2 is row-ranked on [R] among candidate securities after MGA at top, with TSLA in next rank.
Along with the candidate-specific stocks these selection considerations are provided as perspective. The averages of some 3300 stocks for which MM price-range forecasts are available today, as are 20 of the best-ranked (by fom) of those forecasts. The forecast for S&P 500 Index ETF (NYSEARCA:SPY) as an equity market proxy is more-than usually involved with uncertainty because of the war between Russia and Ukraine and its potential for serious broadening.
Recent Trends in MM Price-Range Forecasts for TSLA
Figure 3 (blockdesk.com – used with permission)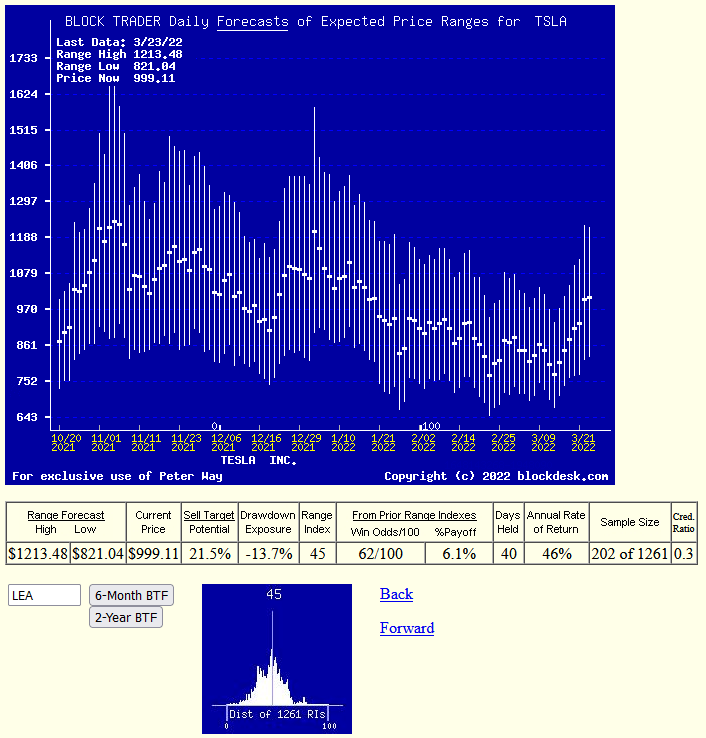
This picture is not a “technical chart” of past prices for TSLA. Instead, it is the past 6 months of daily price range forecasts of market actions yet to come in the next few months. The only past information there is the closing stock price on the day of each forecast. It is the heavy dot in each vertical price range forecast line.
That data splits the price ranges’ opposite forecasts into upside and downside prospects. Their trends over time provide additional insights into coming potentials, and helps keep perspective on what may be ahead.
The small picture at the bottom of Figure 3 is a frequency distribution of the Range Index’s appearance daily during the past 5 years of daily forecasts. The Range Index [RI] tells how much the downside of the forecast range occupies of that percentage of the entire range each day, and its frequency suggests what may seem “normal” for that stock, in the expectations of its evaluators’ eyes.
Here the present level is near its average, most frequent presence, encouraging the acceptance that we are looking at a realistic evaluation for TSLA.
The second horizontal row position for TSLA in Figure 2 emphasizes the stock’s limited payoff capabilities. These coming price expectations by well-informed professionals makes TSLA a bad choice at this price for wealth growth in anticipation. Many other stocks likely will provide multiples of the near-term likely payoff coming from TSLA. In contrast their expectations for MGA are reviewed in Figure 4.
MGA Profitability Prospect
Figure 4 (blockdesk.com – used with permission)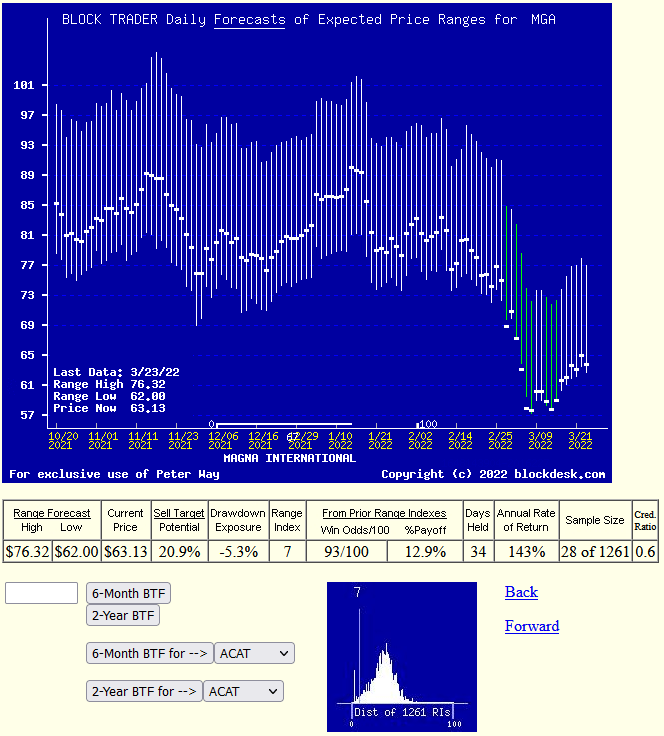
Expectations
The Range Index balance of upside-to-downside price change prospects are not similar for both stocks. For TSLA the upside is about equal to that of likely price draw-down. But the potential for more sizable gain is higher for MGA while both institutional investing expectations of price upsides of 20%+.
Figure 2’s column [T] shows the difference, with the reward-to-risk ratio of MGA at 4 to 1, compared to TSLA’s 1.6 to 1. How their upsides can be the same size is explained by [S], the forecast price range size, with TSLA’s span of 47.8% twice that of MGA’s 23.9%.
The uneven-ness of expectations is resolved further by what has happened historically subsequent to such prior forecasts. MGA’s experiences were profitable in more than 9 out of each ten, while TSLA’s made gains in only 5 out of every 8; 92% winners compared to 62%.
Those are the likely odds following today’s forecasts.
Conclusion
Among these alternative investments explicitly compared, Magna International, Inc. appears to be a more desirable buy preference now to Tesla Inc. for investors seeking near-term capital gain or most forms of wealth building by equity investment. This comparison is for a short-term holding, not one of multi-months or years, but is of significant size which should not be overlooked.
Be the first to comment