

franckreporter
Looking at the Simplify Volatility Premium ETF’s (NYSEARCA:SVOL) historical performance, I believe SVOL’s strategy may be better at generating high distribution yields while maintaining market-like total returns compared to call-selling strategies.
However, SVOL does have a troubling case of declining NAV, which could turn into a distribution cut if the bear market resumes. For now, I am still comfortable holding SVOL for its high distribution yield, although I would not be adding at the moment. I suggest new investors wait for a market pullback (and spike in volatility) before jumping in.
Historical Performance Better Than Call Selling
In one of my earlier articles, I suggested SVOL could outperform covered call selling strategies, since it does not truncate the fund’s return ‘upside’ while still generating high income. With more performance data to analyze, let’s take a look to see if our initial assessment is correct.
For the purpose of this analysis, I will compare the SVOL ETF against the SPDR S&P 500 Trust ETF (SPY) and the popular call-writing ETFs, the Global X S&P 500 Covered Call ETF (XYLD) and the JPMorgan Equity Premium Income ETF (JEPI).
First, comparing the funds’ distributions, we can see SVOL has paid a trailing 12 month distribution of $3.94 / share or 17.5% trailing yield. This is far superior to XYLD and JEPI, which paid 12.7% and 11.7% trailing yields respectively (Figure 1).
Figure 1 – SVOL vs. SPY, XYLD, and JEPI distribution yield (Seeking Alpha)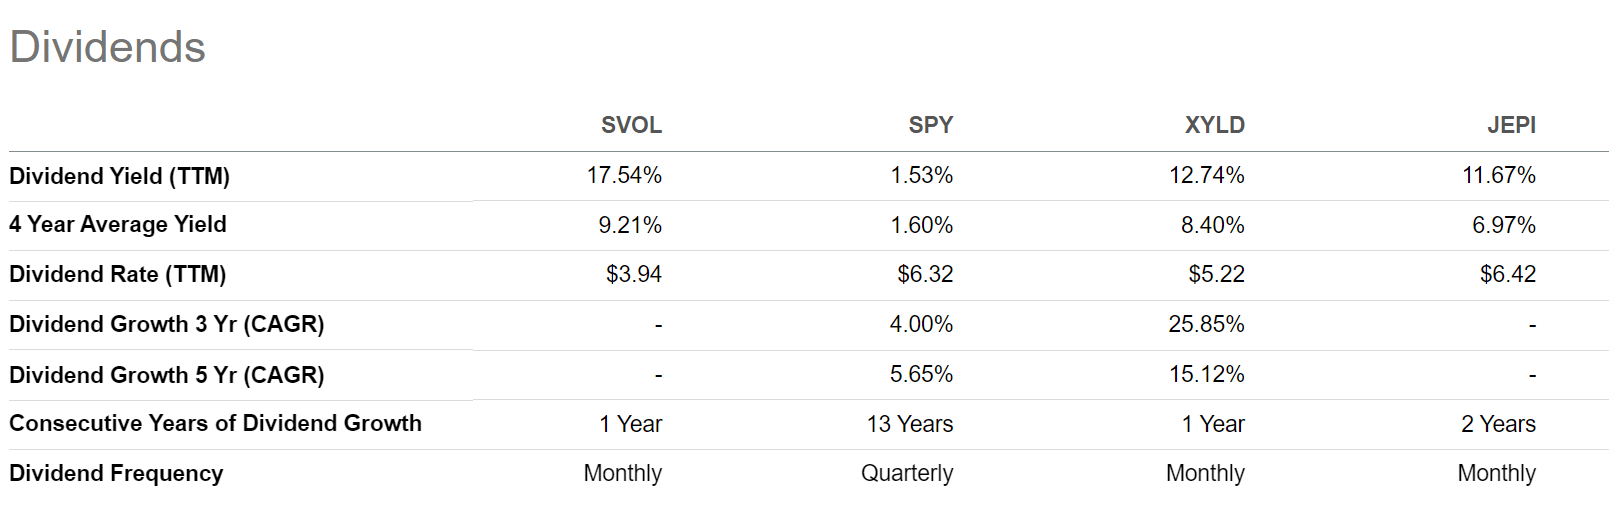
Moving on to total returns, since SVOL’s inception on May 12, 2021, the SVOL ETF has outperformed with 13.0% in total returns vs. S&P 500 TR at 3.4%, XYLD at 4.0%, and JEPI at 9.7% respectively (Figure 2).
Figure 2 – SVOL vs. SPY, XYLD, and JEPI total return since inception (Seeking Alpha)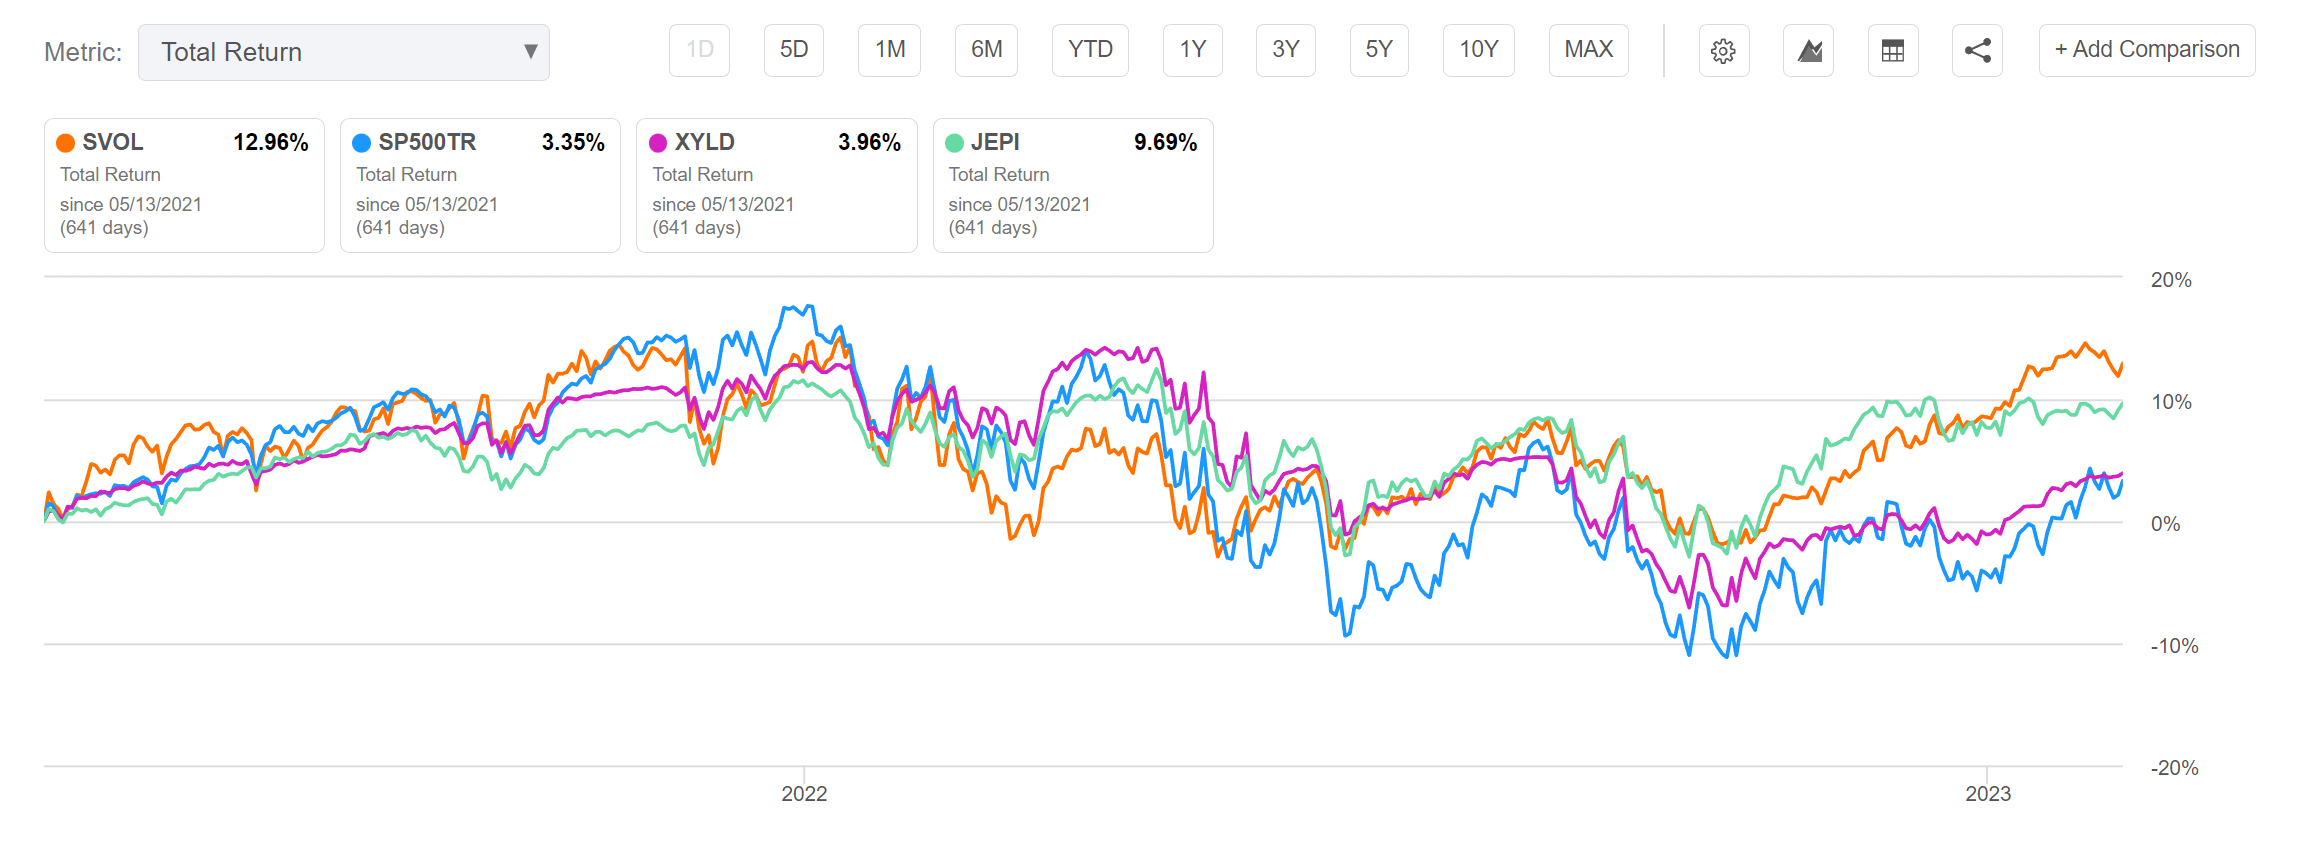
Similarly, on a 1Yr basis, SVOL has returned 8.5% in total returns vs. -4.5% for the S&P 500 TR, -4.9% for XYLD and 3.2% for JEPI (Figure 3).
Figure 3 – SVOL vs. SPY, XYLD, and JEPI trailing 1Yr total return (Seeking Alpha)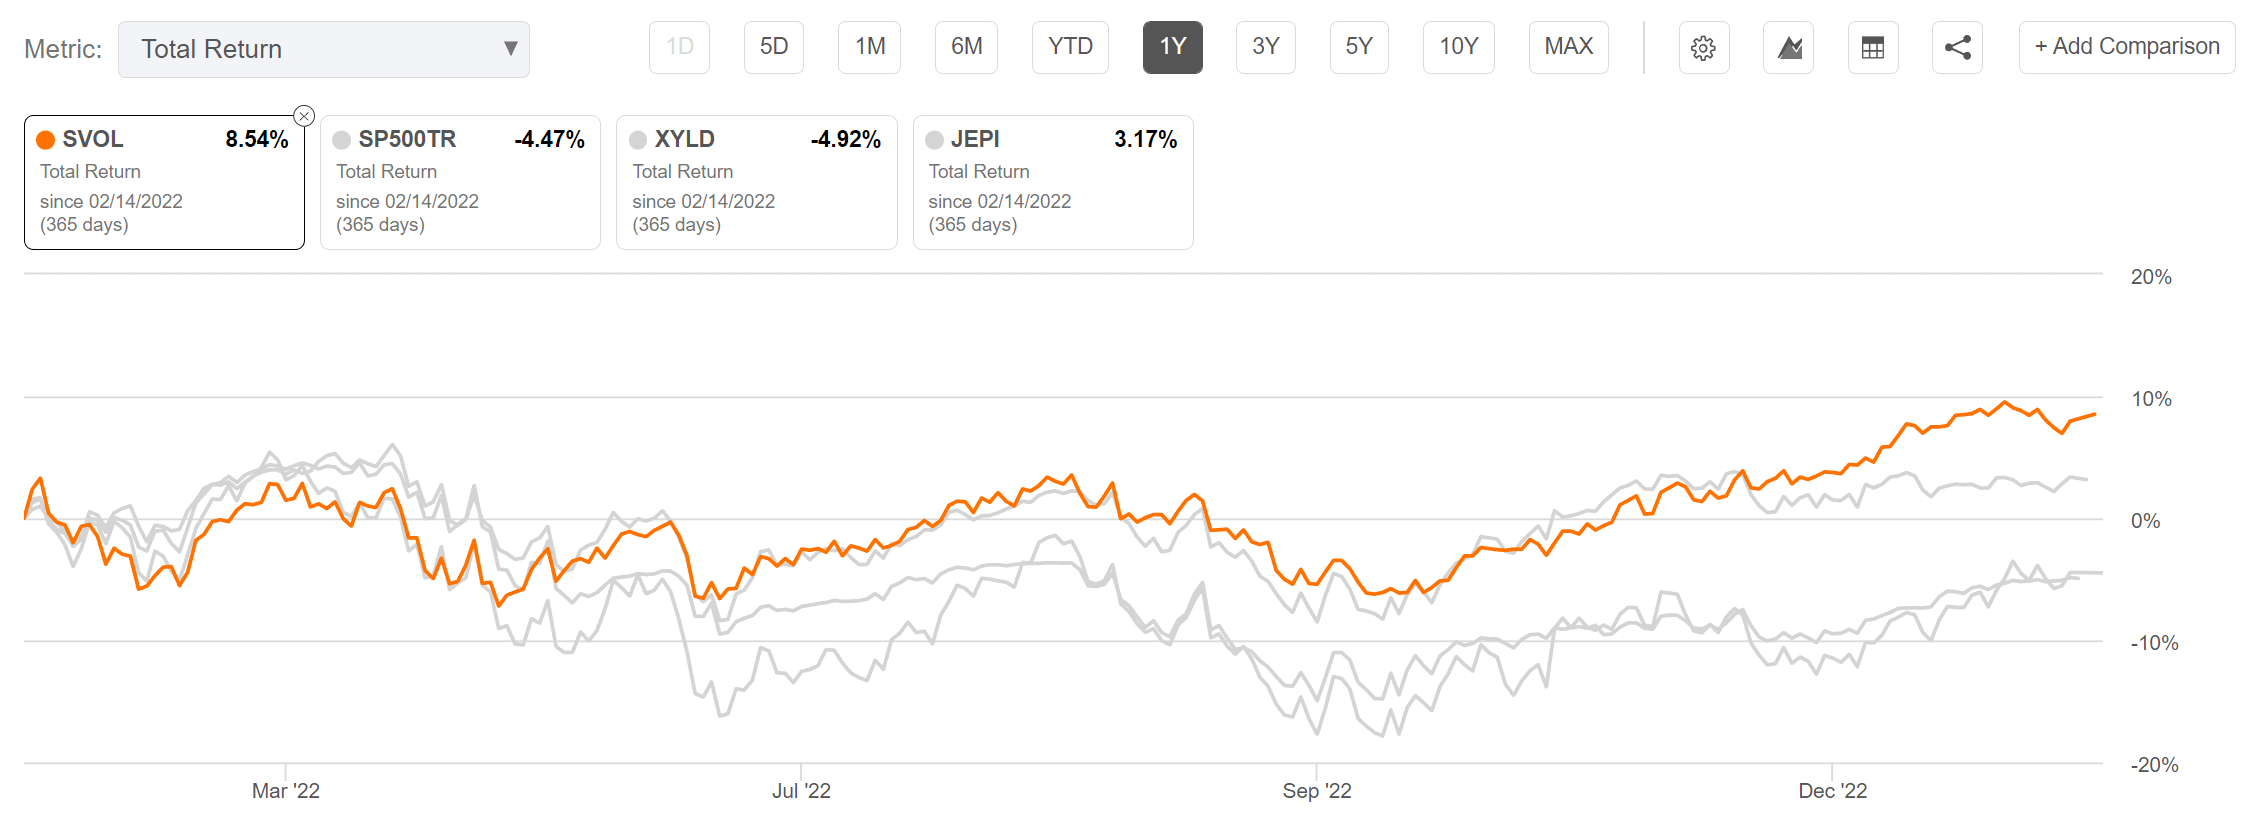
Finally, since October 12, 2022, when the S&P bottomed, SVOL has returned 15.0%, lagging the S&P 500 TR at 16.3%, but beating XYLD at 11.7% and JEPI at 12.7% (Figure 4).
Figure 4 – SVOL vs. SPY, XYLD, and JEPI total returns since October 12, 2022 (Seeking Alpha)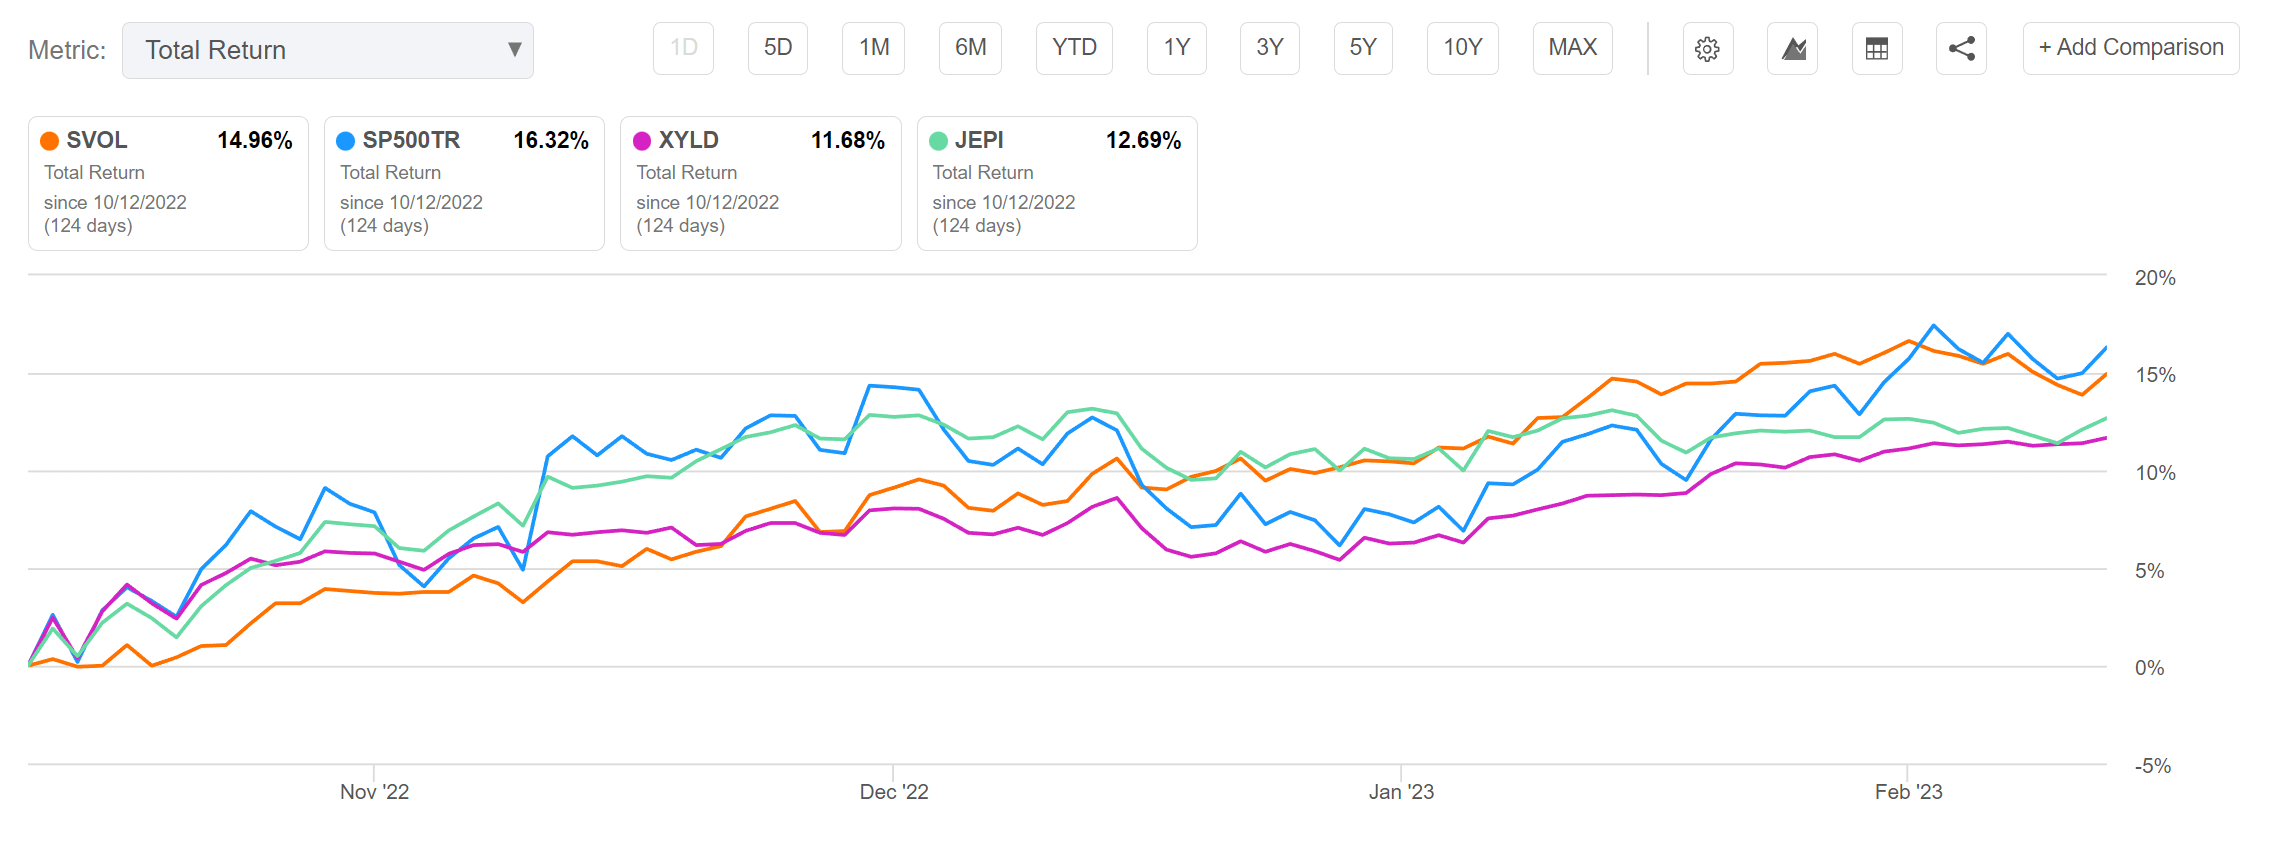
The reason SVOL outperforms is very simple. As I have written in my critique of the Nuveen S&P 500 Dynamic Overwrite Fund (SPXX), call writing strategies fundamentally underperform because they trade away part of their upside in exchange for premium income.
For example, assume a fund sells 2% OTM calls on the S&P 500 Index to generate premium income. Looking at the S&P 500’s historical returns, we can see that since 1985, 39% of the time, the S&P 500’s monthly return is greater than 2%. That means a fund selling 2% OTM call options would lose out in those situations (Figure 5).
Figure 5 – S&P 500 monthly returns distribution (Author created with data from Yahoo Finance)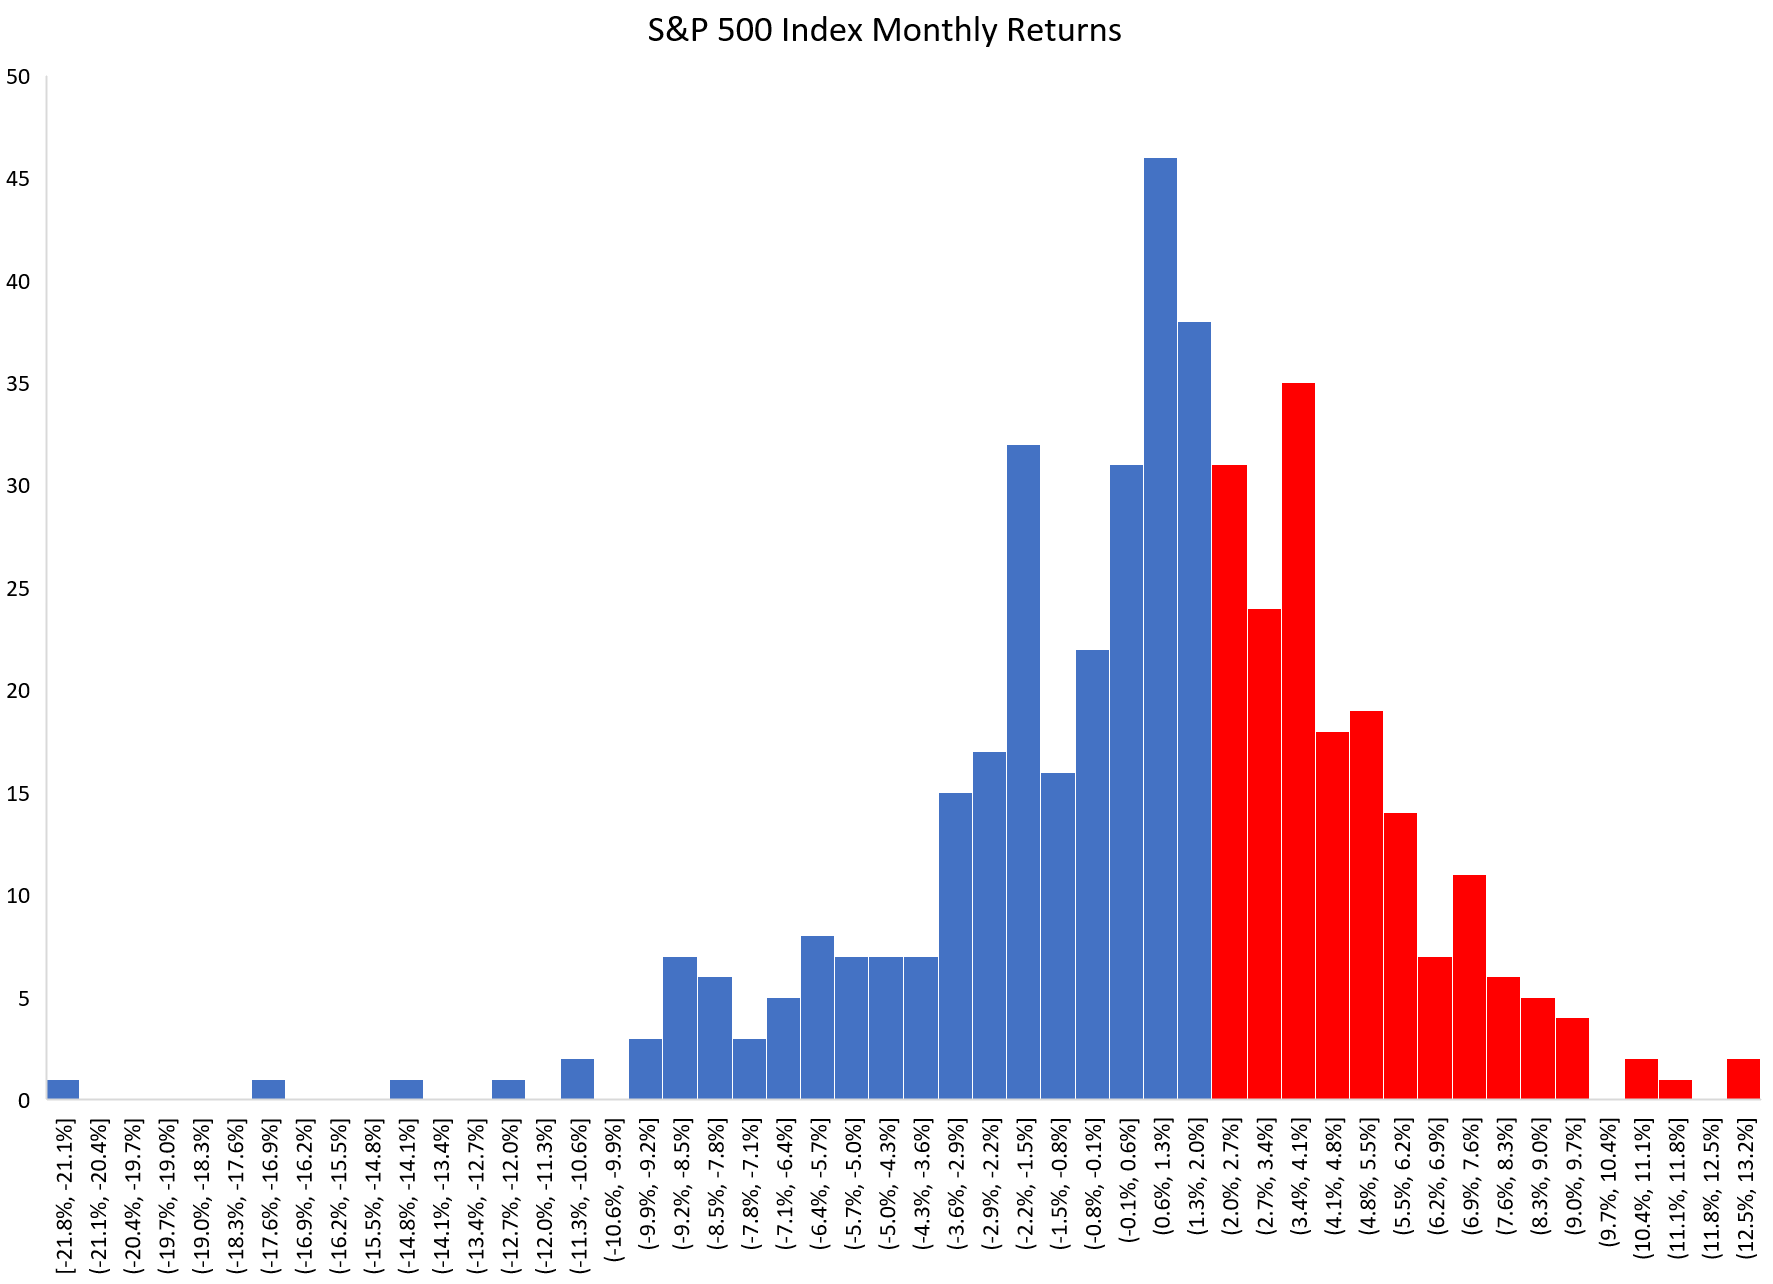
A similar analysis can be performed for funds like XYLD that sell at-the-money (“ATM”) calls. Compounded over long periods of time, missing the best performing months can seriously dent a fund’s total returns. For example, since inception, the XYLD has only delivered 85.3% in total returns vs. 203.0% for the S&P 500 TR (Figure 6).
Figure 6 – XYLD vs. S&P 500 total return since inception (Seeking Alpha)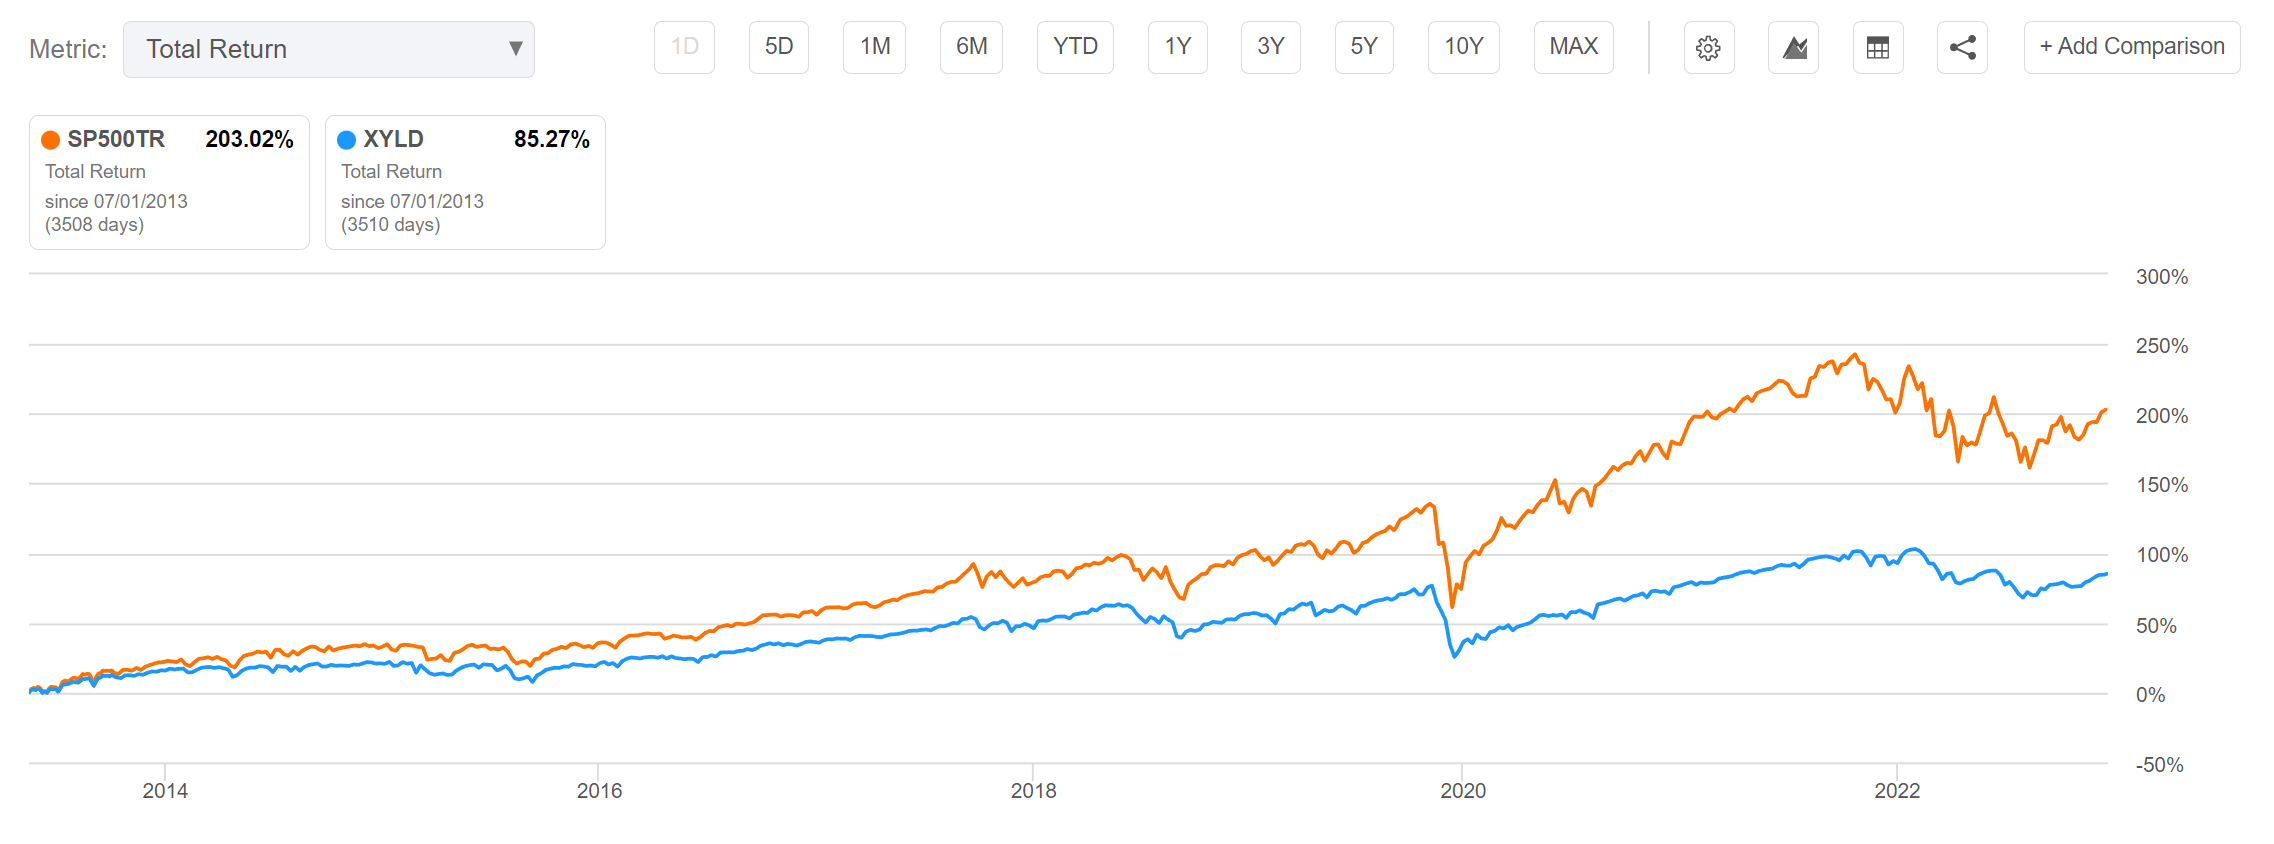
On the other hand, a short-vol strategy like SVOL does not suffer from upside capture issues, since upside returns are uncapped. From the historical analysis above, it appears SVOL has a better chance of providing market-like total returns with high distribution yields than covered call strategies like XYLD and JEPI.
What investors need to be aware of for short-vol strategies like SVOL is the left-tail, i.e. market declines and crashes. Although SVOL owns out-of-the-money (“OTM”) calls on the ProShares Ultra VIX Short-Term Futures ETF (UVXY) as a hedge, the left tail performance of SVOL’s strategy has not been tested in the recent bear market in 2022.
Is Amortizing NAV Going To Be An Issue?
Recently, one of my readers have questioned the core holding of the Simplify Volatility Premium ETF, as its NAV appears to ‘suffer permanent declines every time VIX round trips’. Specifically, I believe he is referring to the pattern seen in figure 7 below, where SVOL’s NAV has successively declined every time the VIX Index spikes, even though the VIX Index has subsequently returned to the 20 level.
Figure 7 – SVOL has a declining NAV problem (Author created with price chart from stockcharts.com)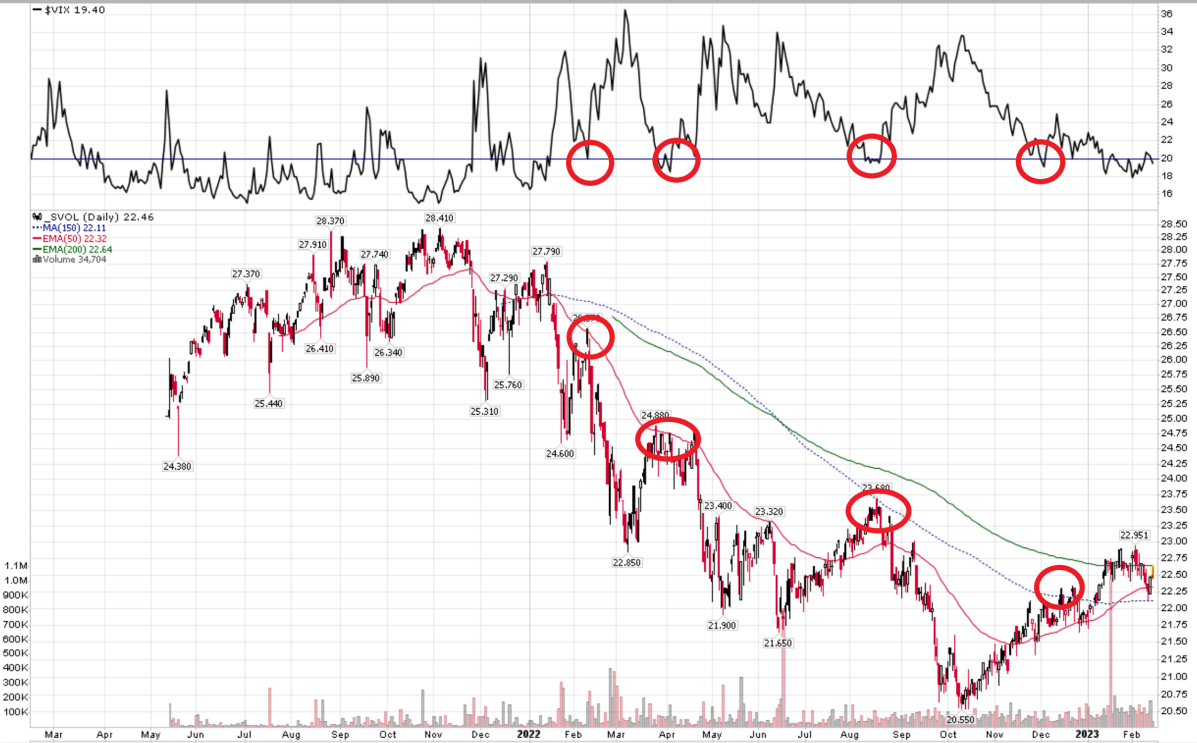
I believe this is a legitimate concern, as the NAV declines, there is less income earning assets to pay future distributions, so future distributions could be compromised.
In fact, when we comb through the fund’s reports and website, we can see that on a per share basis, the dollar value of short VIX contracts has declined, from $6.33 / share in December 31, 2021 when the NAV was $27.32 / share to $4.91 / share on February 13, 2023, when the NAV was $22.40 / share (Figure 8).
Figure 8 – SVOL’s short VIX per share has declined, following NAV (Author created with data from fund reports and website)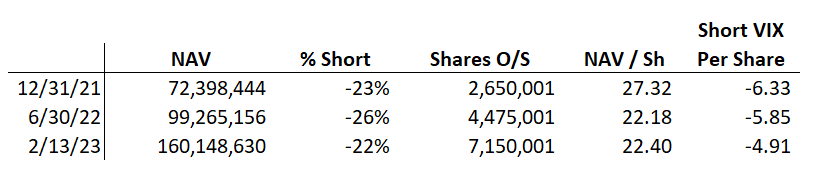
Will SVOL Be Able To Maintain Its Distribution?
This raises a question on the sustainability of SVOL’s distribution.
First, for the good news, from the available information on SVOL’s website, the fund’s distribution for 2022 will be 100% classified as Ordinary Income (Figure 9). This implies SVOL had no trouble ‘earning its distribution’ for 2022 from shorting VIX futures.
Figure 9 – SVOL distribution history (simplifyetfs.com)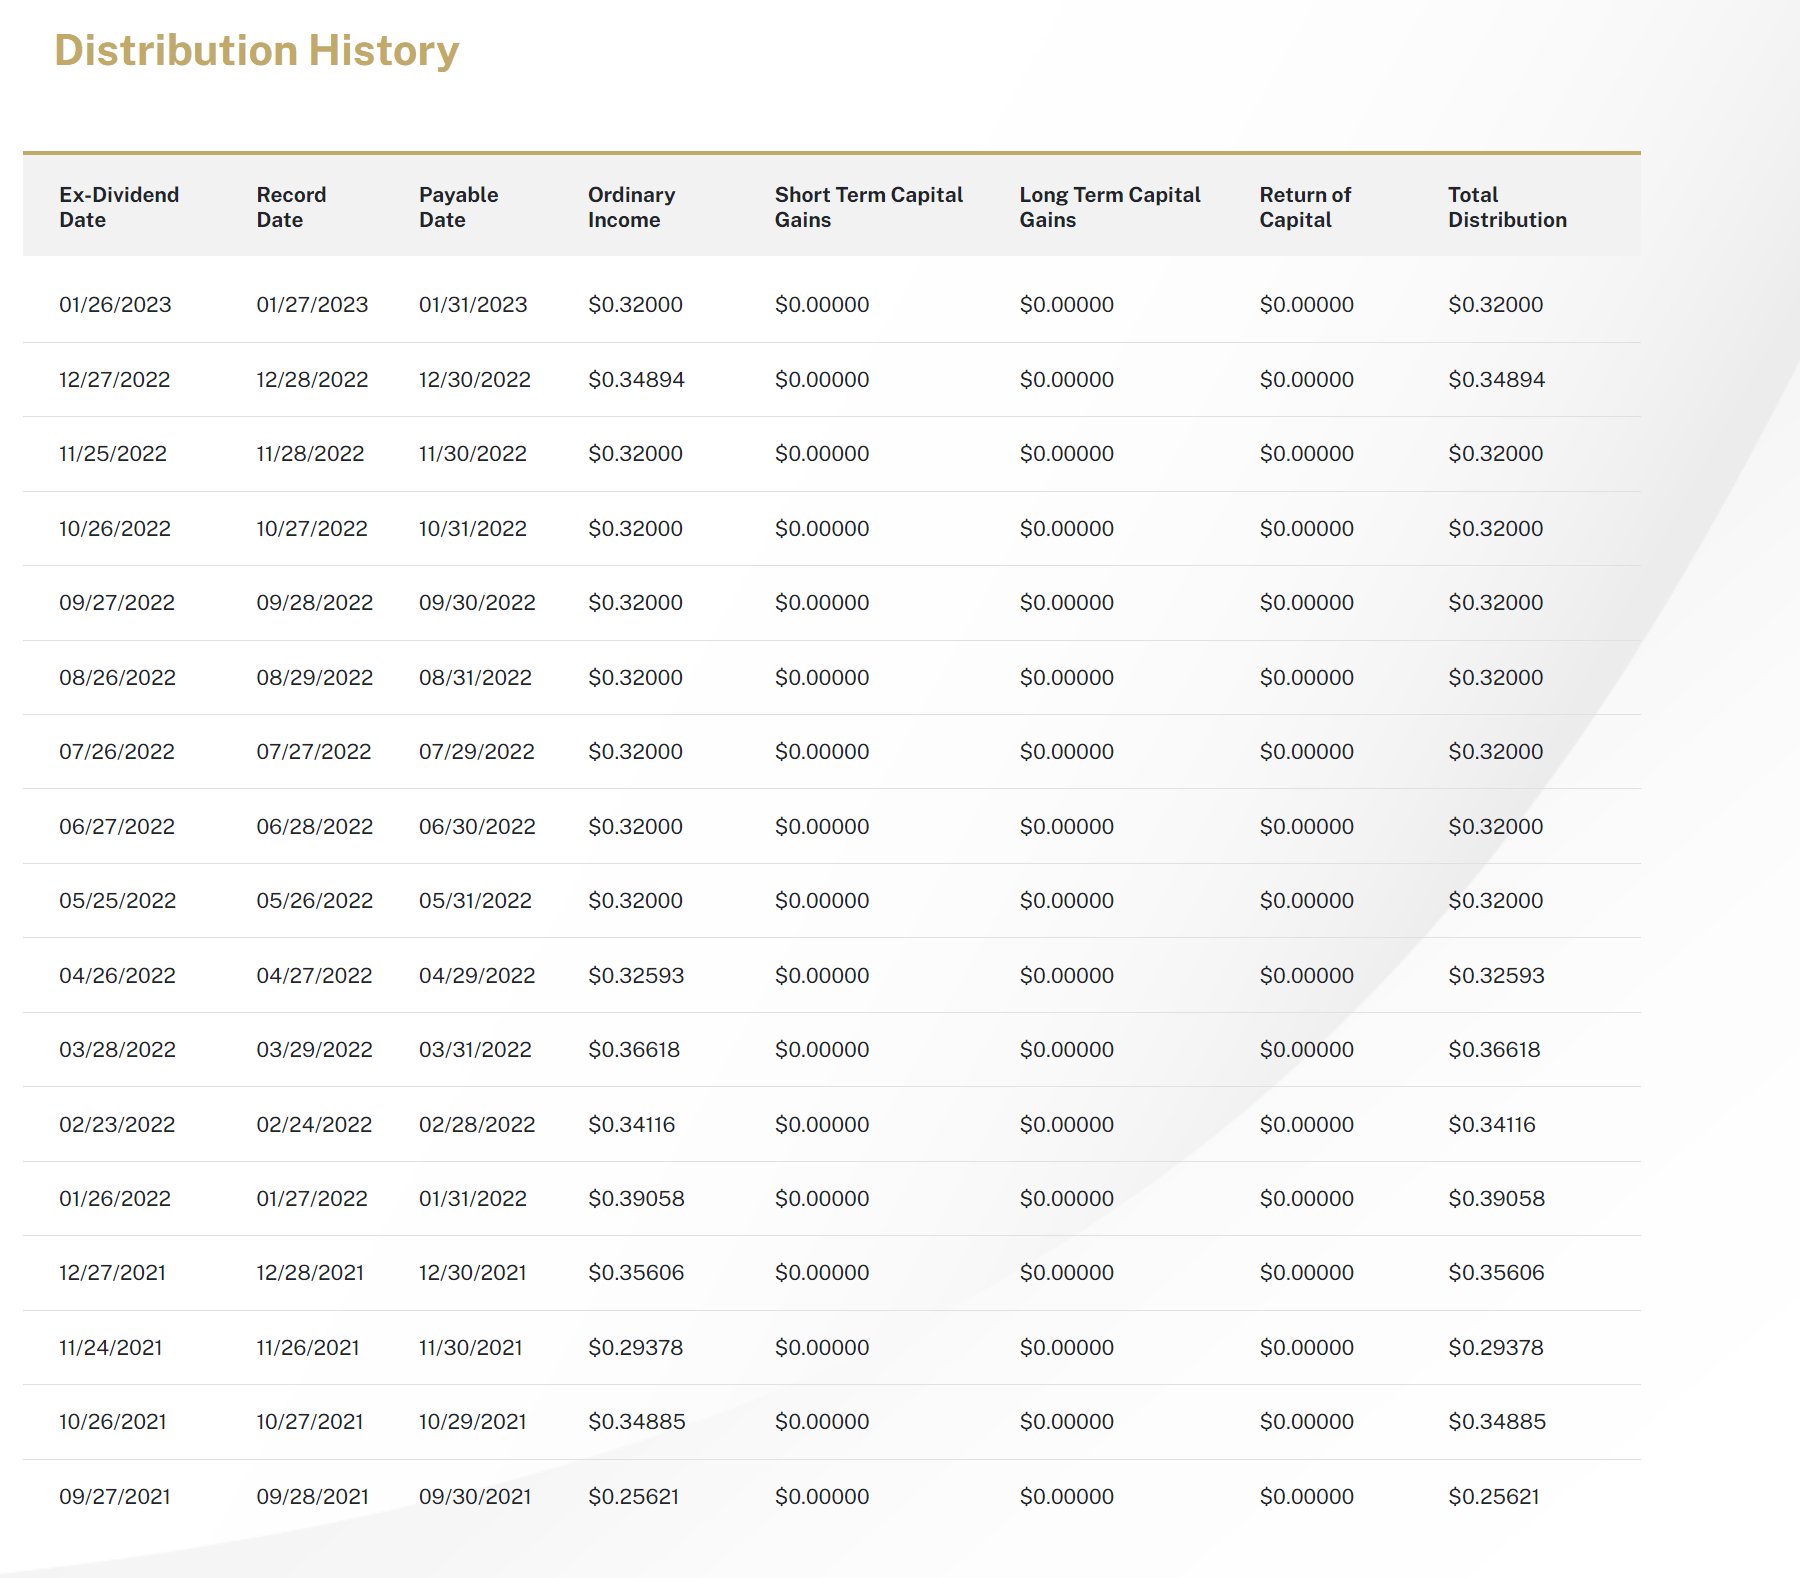
However, if SVOL’s NAV is ~20% lower now than in the beginning of 2022 and the per share amount of VIX shorts is also ~20% lower, then can SVOL generate the same income in 2023 to sustain its $0.32 / month distribution?
Income Potential Looks Good For Now
For now, the income potential on SVOL looks good, as the VIX curve remains very steep on the short end, with more than 1.5 pt of volatility difference between the 1st and 2nd month contract (Figure 10).
Figure 10 – VIX curve currently very steep (vixcentral.com)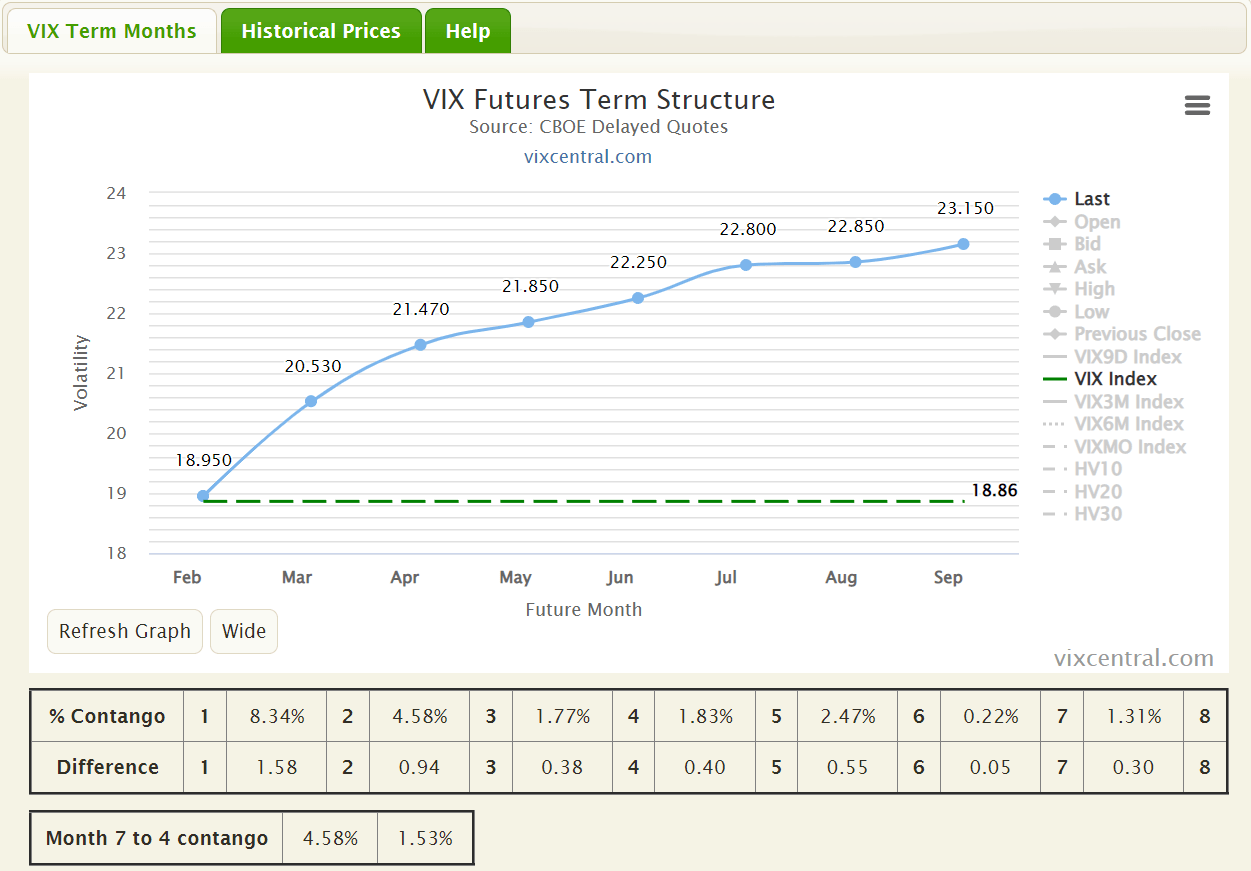
If markets remain calm and the VIX curve remains constant, holding a short position on the 2nd month March contract for one month should earn 1.58 VIX pts or 7.7%. Given SVOL is ~21% short VIX at the moment, this should translate into an annualized ~19% yield, so the fund should be able to cover its annualized 17.0% ($0.32 / month) distribution.
However, VIX futures curves are notoriously fickle, so while the current income profile for the fund looks good, that assessment could change in an instant. Even a simple flattening of the VIX curve could impact the amount of roll yield SVOL earns, jeopardizing the fund’s future distributions.
Continue To Monitor The NAV
The one thing SVOL investors should continue to closely monitor is the fund’s NAV. For now, since markets bottomed in October, SVOL’s NAV has been steadily climbing, from a low of $20.56 to $22.40 recently, indicating the fund has been able to earn more than its distribution yield (Figure 11). However, if markets resume their declines, it is likely that SVOL will also resume the NAV declines we saw in 2022.
Figure 11 – SVOL’s NAV has recovered somewhat (morningstar.com)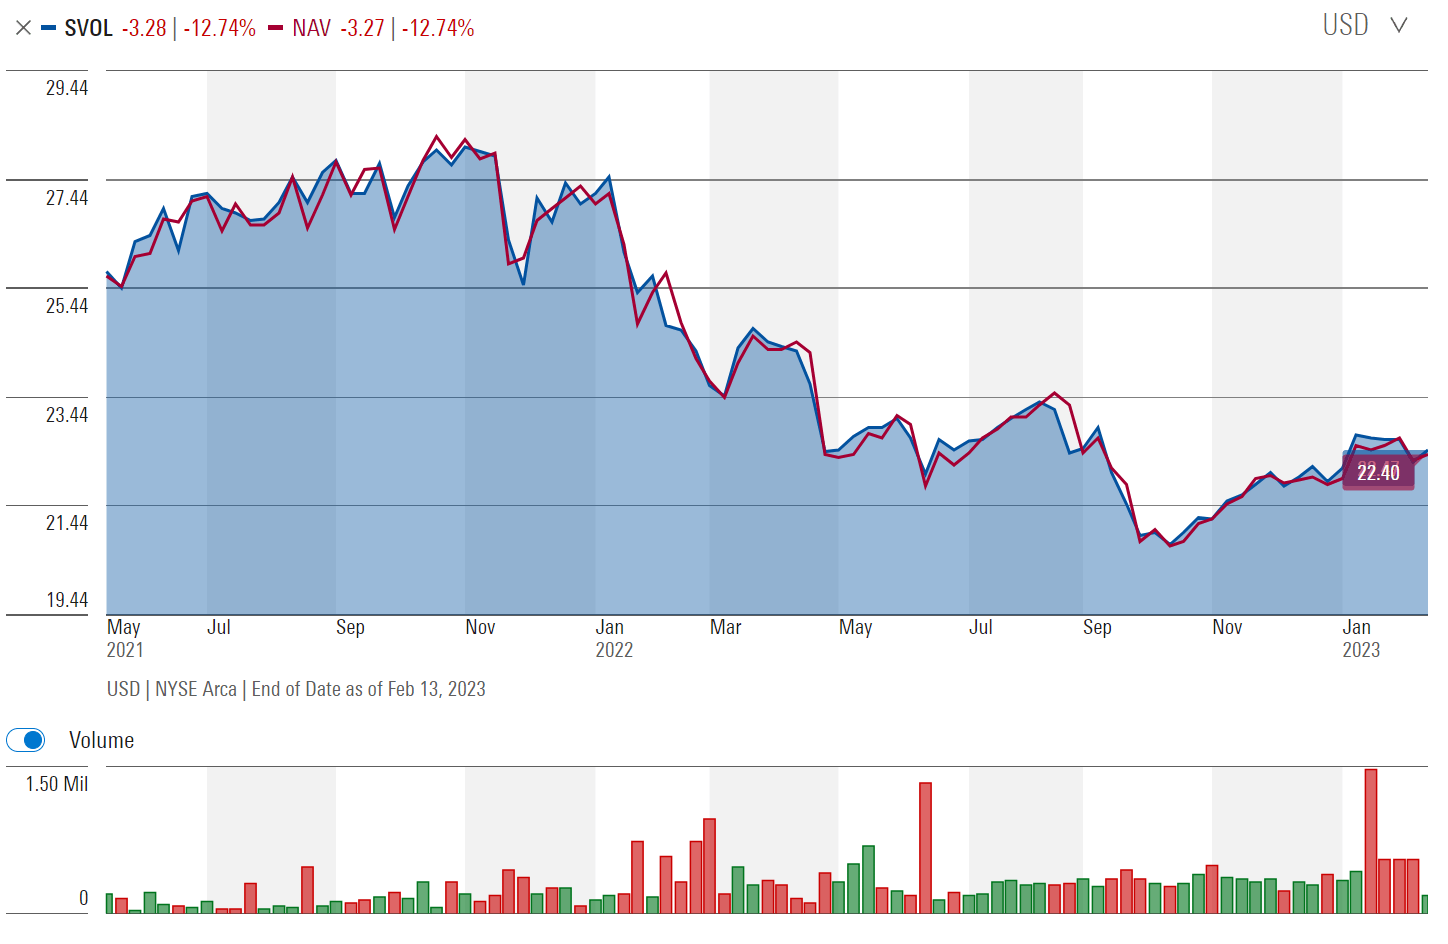
If that turns out to be the case, then investors need to watch out for a potential distribution cut, since further declines in NAV may make a $0.32 / share distribution rate unsustainable.
In fact, it would be great if SVOL’s management (Shailesh and Mike, hope you are reading this) can release some estimates on what level of historical returns a 20-30% short on 1st and 2nd month VIX futures can generate over the long-run so analysts like myself can better assess the sustainability of the fund’s distribution.
Conclusion
Looking at SVOL’s historical performance data, it appears the strategy is better at generating high distribution yields while maintaining market-like total returns compared to call-selling strategies.
However, SVOL does have a troubling case of declining NAV, which could turn into a distribution cut if the bear market resumes. For now, I am still comfortable holding SVOL for its high income potential, but I would suggest new investors wait for a market pullback (and spike in volatility) before jumping in.
Be the first to comment