


ThitareeSarmkasat
Supply Chain Climate Exposure Risks
To manage climate risks, investors need reliable climate exposure metrics all across a company’s supply chain. For example, a company may seem green on a standalone basis but can still have material climate exposure if it has customers or suppliers whose activities could be impaired by transition or physical climate risks. Unfortunately, such risks are not always captured by traditional climate data. For example, the authors of the 2020 study “ Corporate Carbon Performance Data: Quo Vadis?” found that “data on direct emissions are more consistent than data on indirect emissions, and they are especially inconsistent for Scope 3.” (Scope 1 is direct emissions from production; scope 2 is indirect emissions from consumption of purchased electricity, heat or steam; scope 3 is indirect emissions from the production of purchased materials, product use, waste disposal, outsourced activities, etc.) As another example, a company may have zero scope 3 emissions but still have climate risk exposure because it derives material revenue from customers with high climate exposure.
To address these issues, in their July 2022 paper “ Supply Chain Climate Exposure Risks,” AQR’s Kate Liu, Greg Hall, Lukasz Pomorski and Laura Serban proposed a metric that quantifies the exposure a company has to customers or suppliers who may in turn be exposed to climate risks. Their metric is related to scope 3 emissions. While scope 3 focuses on products sold to customers and supplies sourced from suppliers, their metric captures the strength of economic linkages and the overall climate exposure of a firm’s customers and suppliers—it depends on the economic revenue from customers to the company, and from the company to suppliers. The data necessary to compute their measure is “broadly accessible and is arguably of a higher quality than the currently available scope 3 data.” Thus, their metric’s intuitive definition and transparency should be appealing for investors.
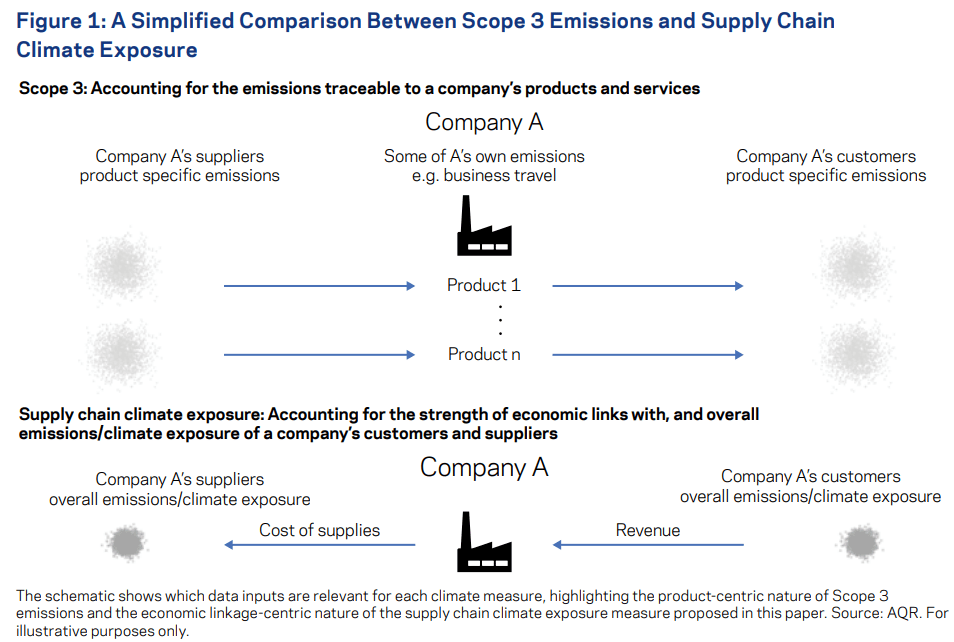
Simplified Comparison Between Scope 3 Emissions and Supply Chain Climate Exposure (AQR)
While their focus was on large-cap developed stocks, roughly equivalent to the holdings of the MSCI World Index, they did not restrict the universe of customers or suppliers of such stocks. Their supply chain data was blended from multiple third-party vendors who use data from regulatory filings, earnings transcripts, company and industry publications, and news sources to comprehensively track global supply chains and the strength of linkages. As their measure of a customer’s (or a supplier’s) own climate exposure, they used the scope 1+2 carbon intensity of customers and suppliers as reported in the Trucost database. Their data sample spanned the period May 2009-December 2021. Following is a summary of their findings:
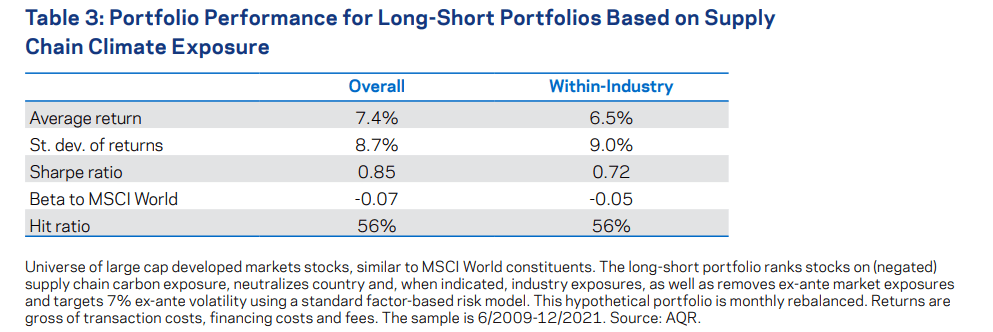
Their measure had relatively low correlations (provides additional information) with traditional climate data and helps explain stock price reactions to climate-related news sentiment. Their measure subsumed climate-related information that was contained in third-party measures (e.g., scope 1, 2 or 3 emissions). The relationship between the measure of supply chain climate exposure was positively related to climate news sentiment, with a correlation between 0.15 and 0.20 — “green” stocks outperformed “brown” stocks during times when climate concerns were heightened, validating their measure of climate exposure risk. Firms that produced more emissions from company-controlled sources also tended to have customers who emitted a lot (correlation of 0.3-0.4). Portfolios based on their measure (long in stocks with low supply chain climate exposure and short in stocks with large supply chain climate exposure, formed in a country-neutral manner, with or without industry adjustments, targeted zero beta [equity market neutral], and 7% ex-ante volatility) realized attractive Sharpe ratios and significant alphas to traditional investment factors. As a test of robustness, they found at least as strong performance in the first half of the 2009-2021 sample as in the second half.
Portfolio Performance for Long-Short Portfolios Based on Supply Chain Climate Exposure (AQR)
Supply chain exposure predicted fundamentals such as earnings or sales surprises beyond what is captured by traditional quality, fundamental or price momentum signals, suggesting that it may capture a new facet of quality and potentially generate forward-looking returns, similar to other quality signals. Their supply chain measure spiked for utilities, energy and materials, three sectors that are also associated with high scope 1 emissions, suggesting that their (revenue-weighted) average customer is also carbon intense. There was also a relatively higher supply chain exposure for industrials than one may expect from traditional emissions data. Similarly, financials had relatively larger supply chain climate exposure relative to any of scope 1, 2 and 3 carbon intensities. This suggests that some industrials and financial companies provide goods and services to customers who may be subject to significant climate risk despite being green on a standalone basis.
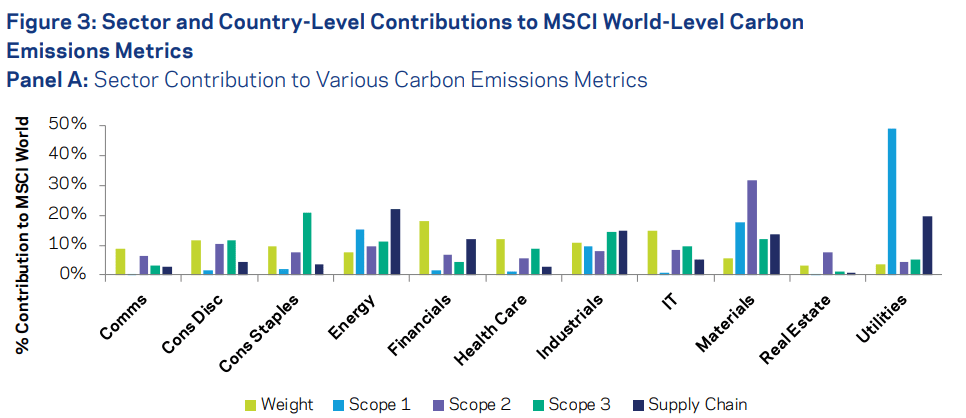
Sector and Country-Level Contributions to MSCI World-Level Carbon Emissions Metrics (AQR)
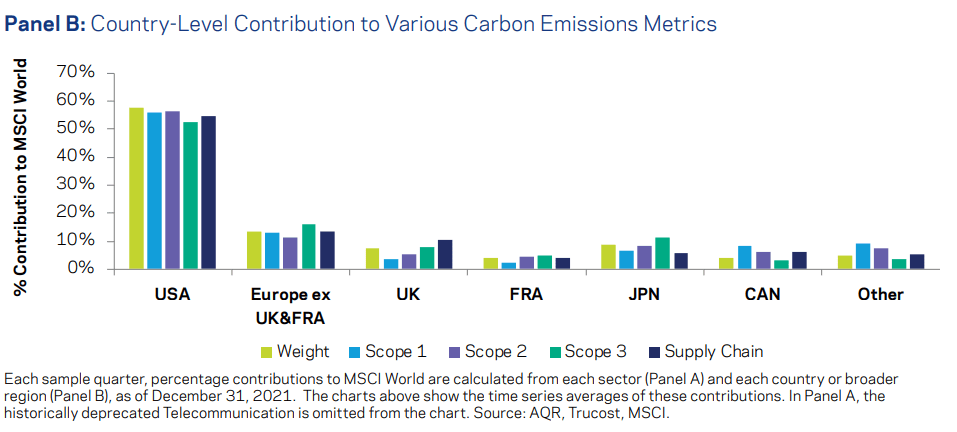
Looking at the countries with the highest weight in the MSCI World Index, the U.S. stood out in absolute terms.
Country Level Contribution to Various Carbon Emissions Metrics (AQR, Trucost, MSCI)
Liu, Hall, Pomorski and Serban noted that their “indicator may also be useful in stewardship, for example by identifying companies with abnormally high supply chain exposures as potential targets for engagement, or by measuring the progress that portfolio companies make in engaging with their own supply chain partners. This may be particularly relevant for emissions offshoring, which occurs when a company switches from making the most carbon-intense components inhouse to buying them from suppliers instead. When such components are produced using company-owned assets, they increase the company’s scope 1 emissions; when they are bought from suppliers instead, they only affect scope 3 emissions. Because most investors today focus on scope 1 and 2, emissions offshoring may artificially increase investors’ assessment of how green a portfolio company is. In principle, this behavior would be apparent in a firm’s scope 3 emissions, but … such data is unfortunately very noisy. Our measure can at least partially fill this gap by helping identify companies that dramatically reduce their scope 1 emissions but at the same time look increasingly brown on our measure.”
Their findings led Liu, Hall, Pomorski and Serban to conclude: “Our measure is similar to, but not a replacement for the often-discussed scope 3 emissions. It captures somewhat different information that we argue may be more material for an issuer’s financial risks. It also has a meaningful advantage of being easier to assess, using data that is already broadly familiar to the investment community. While our measure is not available ‘off the shelf’ from third party vendors, the straightforward methodology we explain in detail in this article can be implemented in-house by at least some investors.”
Investor Takeaways
While AQR’s measure captures a portion of climate-related information that is similar to the traditional measures from MSCI and Trucost, the weight of their evidence seems sufficient to recommend the use of the AQR supply chain climate exposure measure when analyzing securities and portfolios. Hopefully, it will lead the seven major providers of ESG ratings to begin to incorporate the insights gained.
For informational and educational purposes only and should not be construed as specific investment, accounting, legal, or tax advice. Certain information is based upon third party data which may become outdated or otherwise superseded without notice. Third party information is deemed to be reliable, but its accuracy and completeness cannot be guaranteed. By clicking on any of the links above, you acknowledge that they are solely for your convenience, and do not necessarily imply any affiliations, sponsorships, endorsements or representations whatsoever by us regarding third-party websites. We are not responsible for the content, availability or privacy policies of these sites, and shall not be responsible or liable for any information, opinions, advice, products or services available on or through them. The opinions expressed by featured authors are their own and may not accurately reflect those of Buckingham Strategic Wealth® or Buckingham Strategic Partners®, collectively Buckingham Wealth Partners. Neither the Securities and Exchange Commission (SEC) nor any other federal or state agency have approved, determined the accuracy, or confirmed the adequacy of this article. LSR-22-340
Be the first to comment