RiverNorthPhotography/iStock Unreleased via Getty Images
Introduction
After Sunoco (NYSE:SUN) impressively sustained their distributions throughout the turmoil of 2020 and the bumpy start to 2021, their high 8.09% yield was looking safe but stuck when looking ahead, as my previous article discussed. Subsequently, oil and thus fuel prices have surged to heights not seen in almost a decade but despite causing pain at the pump, their distributions are still stuck in place.
Executive Summary & Ratings
Since many readers are likely short on time, the table below provides a very brief executive summary and ratings for the primary criteria that were assessed. This Google Document provides a list of all my equivalent ratings as well as more information regarding my rating system. The following section provides a detailed analysis for those readers who are wishing to dig deeper into their situation.
Author
*Instead of simply assessing distribution coverage through distributable cash flow, I prefer to utilize free cash flow since it provides the toughest criteria and also best captures the true impact upon their financial position.
Detailed Analysis
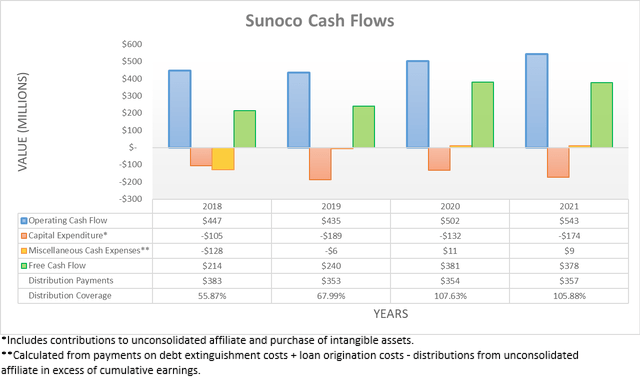
When first opening their cash flow statement for 2021, their full-year operating cash flow of $543m initially appears disappointing following the $512m they had generated throughout the first nine months. Thankfully this simply stems from the temporary $122m working capital draw they saw during the first nine months of 2021 reversing out during the fourth quarter, thereby leaving no material working capital movement for the year. Regardless of these temporary influences, their operating cash flow for 2021 still saw a decent improvement of 8.17% year-on-year versus their previous result of $502m during 2020, thereby offsetting their higher capital expenditure and thus keeping their free cash flow broadly flat year-on-year at $378m, which provided adequate coverage to their distribution payments of $357m.
Following oil prices surging to the highest levels in almost a decade, the pain consumers feel each week filling up their vehicles has become one of the biggest topics. Naturally, investors could be wondering whether this fuel-related partnership stands to benefit and thus help relieve the pressure on their wallets but unfortunately, this is not the case because their margins and volumes are normally inversely correlated, as per the commentary from management included below.
“Again, I would remind everyone that if volume weakness were to sustain for a period of time, that we would expect it to be offset to some extent by higher breakeven margins as we’ve experienced for the last two years.”
-Sunoco Q4 2021 Conference Call.
When it comes to business, finance and economics, there are seldom any free lunches and thus, if you benefit one way, you tend to lose the other way too. This dynamic within their margins and volumes have been evident throughout the recent years with 2019 seeing record volumes of 8.2 billion gallons but with a margin of only 10.1 cents per gallon, which was short of their margins of 11.9 and 11.2 cents per gallon seen during 2020 and 2021 respectively that saw lower volumes of 7.1 and 7.5 billion gallons respectively, as per their quarterly reports. Whilst making their financial performance more stable, it also means that the higher prices at the pump are not necessarily helping this investment and thus there are no free lunches, as their stability comes at the expense of less upside potential.
When looking at their guidance for 2022, it further confirms this dynamic with their adjusted EBITDA of $790m at the midpoint only representing a modest increase of 4.77% year-on-year versus their result of $754m during 2021, as per their fourth quarter of 2021 results announcement. Since their operating cash flow should see a positive correlation, it should increase by circa 5% to approximately $570m during 2022. Meanwhile, their guidance also points to growth and maintenance capital expenditure of $150m and $50m respectively for 2022, which at a total of $200m represents a modest increase year-on-year versus their $174m during 2021. This leaves their estimated free cash flow for 2022 at circa $370m, which would once again provide adequate coverage to their $357m per annum of distribution payments. Whilst this remains safe and sustainable, it once again leaves essentially no room to fund any material growth and thus despite surging fuel prices, their distributions still remain stuck in place unless they reduce their future capital expenditure, although this obviously remains unknown.
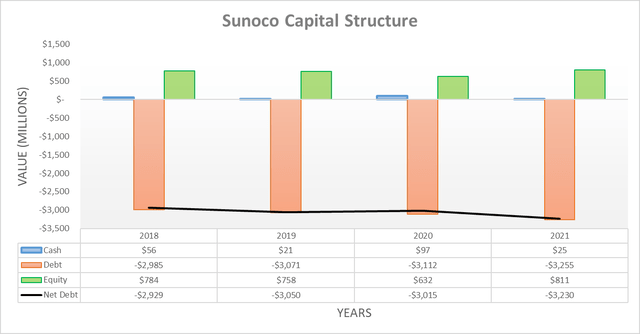
Following the fourth quarter of 2021, their net debt ended the year at $3.23b versus its level of $2.84b when conducting the previous analysis following the third quarter. Despite representing a sizeable increase for only one quarter, this was already expected within my previous analysis and resulted from their $255.5m terminal acquisition as well as their working capital draw reversing. When looking ahead into 2022, unless they make any further acquisitions, their net debt should remain broadly unchanged given the narrow gap between their distributions and estimated free cash flow.
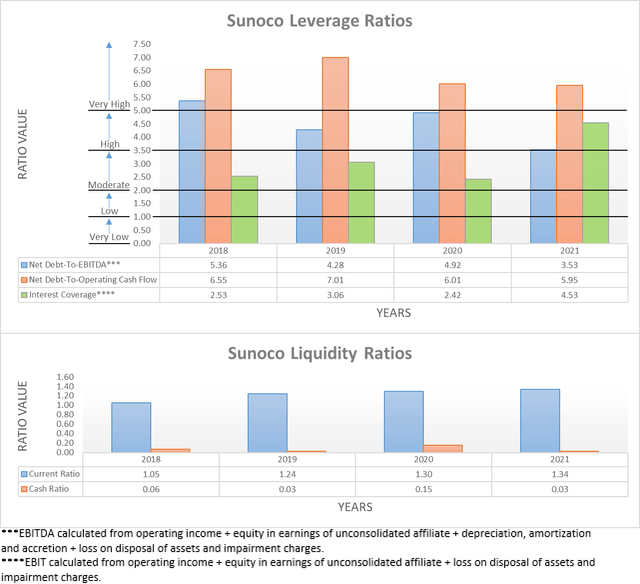
Since their cash balance also only saw immaterial changes, it means that not only has their leverage remained broadly unchanged but their liquidity also has too, thereby making both rather redundant to reassess in detail, although if any new readers are interested in further details, please refer to my previously linked article. The two relevant graphs have still been included below for reference, which shows that their leverage remains strung between the high and very high territories with their net debt-to-EBITDA of 3.53 sitting slightly above the threshold of 3.51 for the former, whilst their net debt-to-operating cash flow of 5.95 sits above the threshold of 5.01 for the latter. Meanwhile, their respective current and cash ratios of 1.34 and 0.03 both indicate that their liquidity remains adequate, thereby easing the risks from their otherwise concerning leverage.
Conclusion
Whilst their high distribution yield certainly looks to be appealing on the surface, it does not stand to benefit from these surging fuel prices and thus similar to 2021, it once again remains safe but stuck in place, as it consumes most of their free cash flow. Since it appears that 2022 represents another business-as-usual year for their financial performance, I believe that maintaining my hold rating is appropriate with their unit price still trading around its five-year highs and close to the intrinsic value that my earlier article estimated.
Notes: Unless specified otherwise, all figures in this article were taken from Sunoco’s SEC filings, all calculated figures were performed by the author.


Be the first to comment