

buzbuzzer
Sun Communities, Inc. (NYSE:SUI) is a leading owner and operator of manufactured housing communities (“MH”), recreational vehicle resorts (“RV”), and marinas. At September 30, 2022, their portfolio consisted of 662 developed properties with over 200K total sites and wet slips located in 39 states throughout the U.S, the U.K., Ontario, Canada, and Puerto Rico.
Over a longer timeframe, shares in the stock have significantly outperformed both the S&P 500 (SPY) and the MSCI U.S. REIT index, with total returns of 77% and 334% over a 5-year and 10-year period, respectively.
November 2022 Investor Presentation – 5 and 10-Year Return Of SUI Compared To Broader Indexes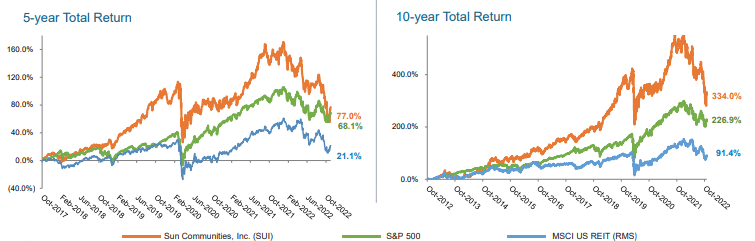
Over the past year, however, the stock is down over 30%, which is significantly worse than the broader indexes. The underperformance is despite impressive operating performance that continues to come in ahead of expectations.
While Seeking Alpha’s Quant System rates shares as a hold, with a “F” grade on valuation offsetting positive scores elsewhere, there is more to the company’s value than just their surface level pricing multiple.
Seeking Alpha – SUI Quant Rating History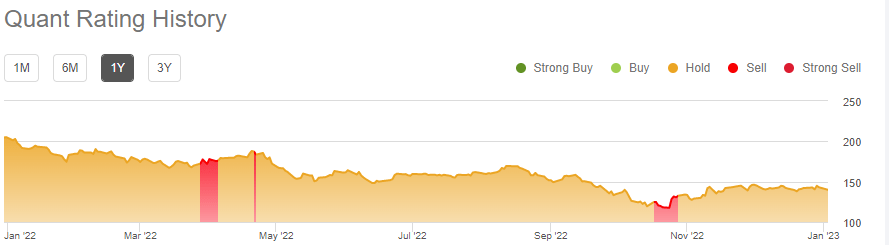
Aside from valuation, the current underperformance could also be attributed to fears of the effects of a potential economic downturn on SUI’s business model, which in recent years has rapidly expanded outside of the MH core portfolio.
RVs and Marinas, for example, account for over 50% of annualized base rents. While these two segments are, indeed, more exposed to economic cycles due to their recreational nature, it’s important to note that about 90% of the marinas’ portfolio net operating income (“NOI”) is attributable to reoccurring sources with lease terms of approximately 8 years.
Likewise, the company has posted record transient site conversions in their RV segment, which not only is resulting in an immediate revenue boost but is also creating new reoccurring annual cash flow streams.
The sticky revenue streams in combination with their strong recent operating performance, thus, warrants a second look from investors seeking new additions to their diversified REIT portfolios.
Recent Performance
In Q3FY22, all segments displayed strength. In the same-property population, real property NOI was up a combined 6.4% in the MH/RV segments, due to a combination of rate growth and a 200 basis point (“bps”) increase in occupancy.
Leading the way higher was an 8.4% increase in RV NOI, driven in part by a 13.4% increase in revenues due to a record number of transient site conversions during the year. During the quarter, conversions accelerated 30% compared to last year. On a YTD basis, the company has now converted approximately 2K transient sites.
Q3FY22 Investor Supplement – Snapshot Of Quarterly NOI By Segment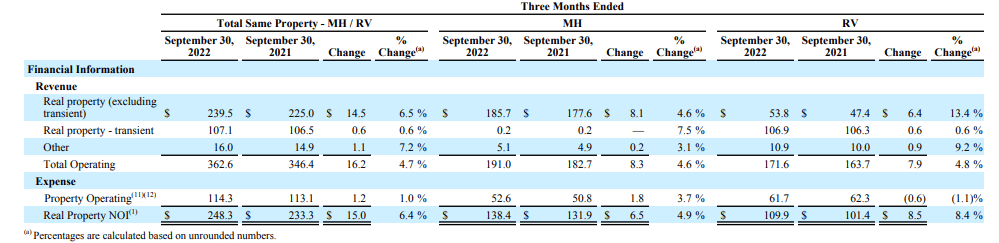
This is notable since these conversions have the effect of a creating a sizeable boost in revenues in the year immediately following the conversion. In addition, the conversion also creates a new stream of reoccurring cash flows over an extended timeframe.
In addition to more annual sites, monthly base rent per RV site increased by 7% YOY. On a combined basis with increased base rents on MH, total rents were up 4.7% from last year. And looking ahead to 2023, rents are expected to increase another 7.8% and 6.3% at the midpoint of current guidance for RVs and MH, respectively.
Providing a strong supplement to their MH/RV segment were their marinas, which exhibited nearly double-digit NOI growth, driven by increased revenues in both boat slips and storage. And according to management commentary, 85% of the Safe Harbor Marinas have a waitlist to join. This should result in continued strength in the segment in future periods as demand is ultimately filled.
The all-around positive performance during the quarter contributed to a 28% increase in constant current core funds from operations (“FFO”) along with upward revisions in annual guidance.
Liquidity And Debt Profile
SUI’s primary source of liquidity is availability on their revolving credit facility, which enables borrowings up to +$3.05B through April 2027. As of September 30, 2022, the company had +$862M of borrowings outstanding on this facility.
In addition to their credit facility, SUI had cash and equivalents of approximately +$112M at period end. Combined with their stable reoccurring cash flows generated through operations, which currently stands at +$655M through nine months of the year, SUI has ample liquidity to fund both their short-term obligations and long-term growth ambitions.
SUI also benefits from a well-laddered debt stack. At present, the weighted average years to maturity of their current debt outstanding is 8 years. Though there is an upcoming maturity in 2023 that needs to be addressed, it is just +$120M. This can be easily paid off via free cash flows.
Overall, the company has +$6.7B of debt outstanding, which represents 5.7x of EBITDA on a net basis. This is consistent with prior periods and in-line with expectations.
They do have elevated exposure to floating rate debt, at about 20% of their total composition, due primarily to their usage of their revolver, but their weighted average interest rate on their overall load is still low at 3.4%. Additionally, interest coverage is strong at 5.7x. As such, there are limited concerns regarding SUI’s ability to meet their reoccurring debt servicing obligations.
Dividend Safety
SUI has a strong dividend track record of payout continuity and growth. Over the past five years, the payout has grown at a compound rate of 5.6%. Most recently, the quarterly payout was increased by 6% from $0.83/share to its current level of $0.88/share. This represents an annualized yield of about 2.5% at current pricing.
While the yield is unappealing in its current form, long-time investors are likely benefitting from an attractive yield-on-cost, given the strong growth rate of the payout over time, in addition to superior share price performance over most years.
Seeking Alpha – SUI’s Dividend Yield-On-Cost Over Time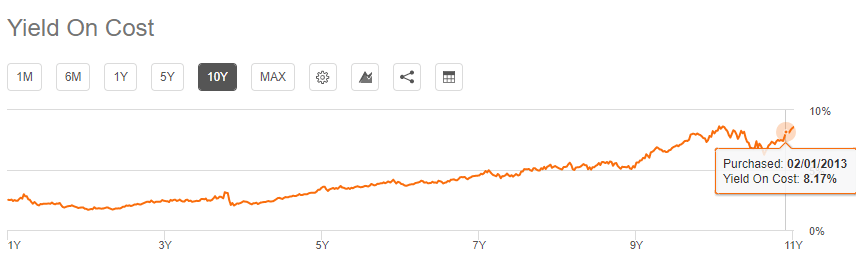
At a payout ratio of less than 50%, the dividend is well covered and is unlikely to be at risk of a cut at any time in the foreseeable future.
Why SUI Is A Buy
SUI has continued posting strong results through nine months of 2022. And in the most recent quarter, guidance for full year FFO/share was increased for the second consecutive time to a midpoint that represents 13% growth over 2021.
On a same-property level, the company did moderate their full year NOI growth expectations for MH and RV, but the new range still represents 6% growth at the midpoint.
Contributing to their success is their record number of transient conversions, with nearly 2K completed YTD. This is not only 60% above original expectations, but this exceeds last year’s record by 20%. And this figure is expected to be even higher for their Q4 release. These conversions are notable because they have historically increased revenue per site by 40-60% for the first full year following conversion.
More importantly, the conversions create a more stable source of recurring revenue. As it is, SUI’s income stream is largely uninterrupted, as the average tenure is about 14 years in their MH communities and 8 years on average for both their RV resorts and marinas.
The record conversions will add to their number of annual sites and should contribute favorably to long-term FFO growth, which already is growing at a compound rate of 9.2% over the past ten years, with 12% growth logged from 2017. This compares favorably to peers and adjacent sectors, such as Multifamily and Storage, who posted growth of 5.2% and 10.7%, respectively.
And for those concerned about the prospects of recession on their business model, it’s worth noting that the company has recorded positive same-property NOI growth for more than 20 years in every individual year or rolling 4-quarter average. This even includes the period through the Great Financial Crisis.
At about 20x forward FFO, shares don’t appear to be a bargain at first glance. At the end of the past three years, however, the stock has traded at a 30x multiple. While some would scoff at that price point, others could point to its market leadership and scale that includes an international presence as one justification for a premium multiple.
Its continued earnings success and expectations for further rental rate growth in 2023 also warrant a reassessment of its current trading position. Assuming a long-term dividend growth rate of about 3% and a CAPM-derived cost of equity of 8.13%, with a 5-year BETA of 0.66, a market risk premium of 5.5% and a risk-free rate of 4.5%, shares would be reasonably valued at about $173/share when utilizing a 5-year dividend discount model.
While this upside may not be enough to fully recover all their losses over the past year, it would still represent an attractive opportunity for prospective investors seeking to add a high-quality market leader to their diversified portfolios.
Be the first to comment