

sefa ozel
Dividend kings are generally considered to be some of the safest and most stable investments in the market, with their history of at least 50 years of consecutive dividend increases without a single missed year. V.F. Corporation (NYSE:VFC) is a newly crowned king at just 50 years of consecutive increases, but will its reign be shortlived after shares of the company plummeted by 69% in the last three years? Seeking Alpha’s quant is rating VFC Dividend safety as an F! Let’s find out if I agree with this rating.
SA VFC Dividend Scorecard (Seeking Alpha)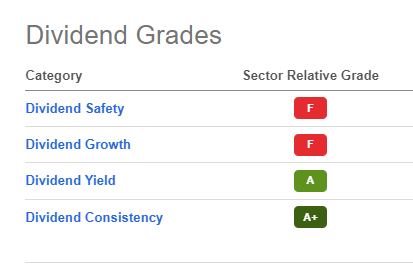
Throughout this article, if I don’t declare otherwise, the data will be taken from Seeking Alpha directly.
Dividend grades
Seeking Alpha ranks dividends on four metrics:
- Safety
- Growth
- Yield
- Consistency
Growth, Yield and Consistency can be fairly quickly checked; the focus of this article will be on safety.
The easy metrics
Let’s quickly go through the easy metrics:
Dividend Growth
VFC has seen a considerable deceleration in its dividend growth over the last decade, with the forward dividend growth expectations even turning negative!
| Timeframe |
Compound Annual Growth Rate (CAGR) |
Sector Median |
|---|---|---|
| next year expected | -0.77% | 15.57% |
| last one year | 2.04% |
18.64% |
| last three years | 1.89% | 6.73% |
| last five years | 4.42% | 9.42% |
| last ten years | 10.92% | 10.31 |
Source: Author, with data from Seeking Alpha
Dividend Yield
VFC currently has a 7.28% dividend yield, significantly above the sector median in the consumer discretionary sector of 2.53% and above its 4-year average yield of 3.05%. No question about it; this is a very strong yield. If we look at the 5-year yield on cost, though (if we bought shares five years ago, how much would our personal yield be), it is significantly lower at 2.72% due to the collapsing share price.
Dividend Consistency
Some websites show 49 years and some 50 years. Regardless of what it is, VFC has a very long history of consistent dividend growth over half a century.
Is the dividend safe or can we expect a cut?
High dividend yields only mean something if the dividend can be sustained and doesn’t have to be cut or paid by rising issuance of debt or shares. First off, let’s look at some data and then go into detail:
| Criteria | VFC | Sector Median |
|---|---|---|
| EPS GAAP Payout ratio | 186.11% | 31.43% |
| EPS Non-GAAP Payout ratio | 76.72% |
29.48% |
| Cash Flow Payout ratio | 72.91% | 22.04% |
| FCF Payout Ratio | negative FCF | 38.33% |
| Net Debt/EBITDA | 173.49% | 120.59% |
We can see that all selected safety metrics look bad. I do not care too much about the EPS Payout ratios because, after all, you can’t pay a dividend with accounting profits anyways; you need cash flow for that! So let’s have a look at why FCF is negative and how bad the debt situation is:
We can see that inventories are the VFC’s big problem. Over the last twelve months, inventories increased by $1.4 billion, more than doubling in size and taking FCF down with it. The company currently has $6.5 billion in net debt (with $550 million cash on hand, down from $1.4 billion in 2021 after the Supreme acquisition), $123 million trailing twelve months (TTM) of interest payments and $777 million TTM dividend payments. The interest payments aren’t a big problem, considering the low rates of the notes (page 85 of the 10k), but the company needs to generate over $777 million in Free cash flow to pay and grow its dividend.
The next question is how committed the management is to solving the inventory situation.
VFC inventories getting out of hand (Koyfin)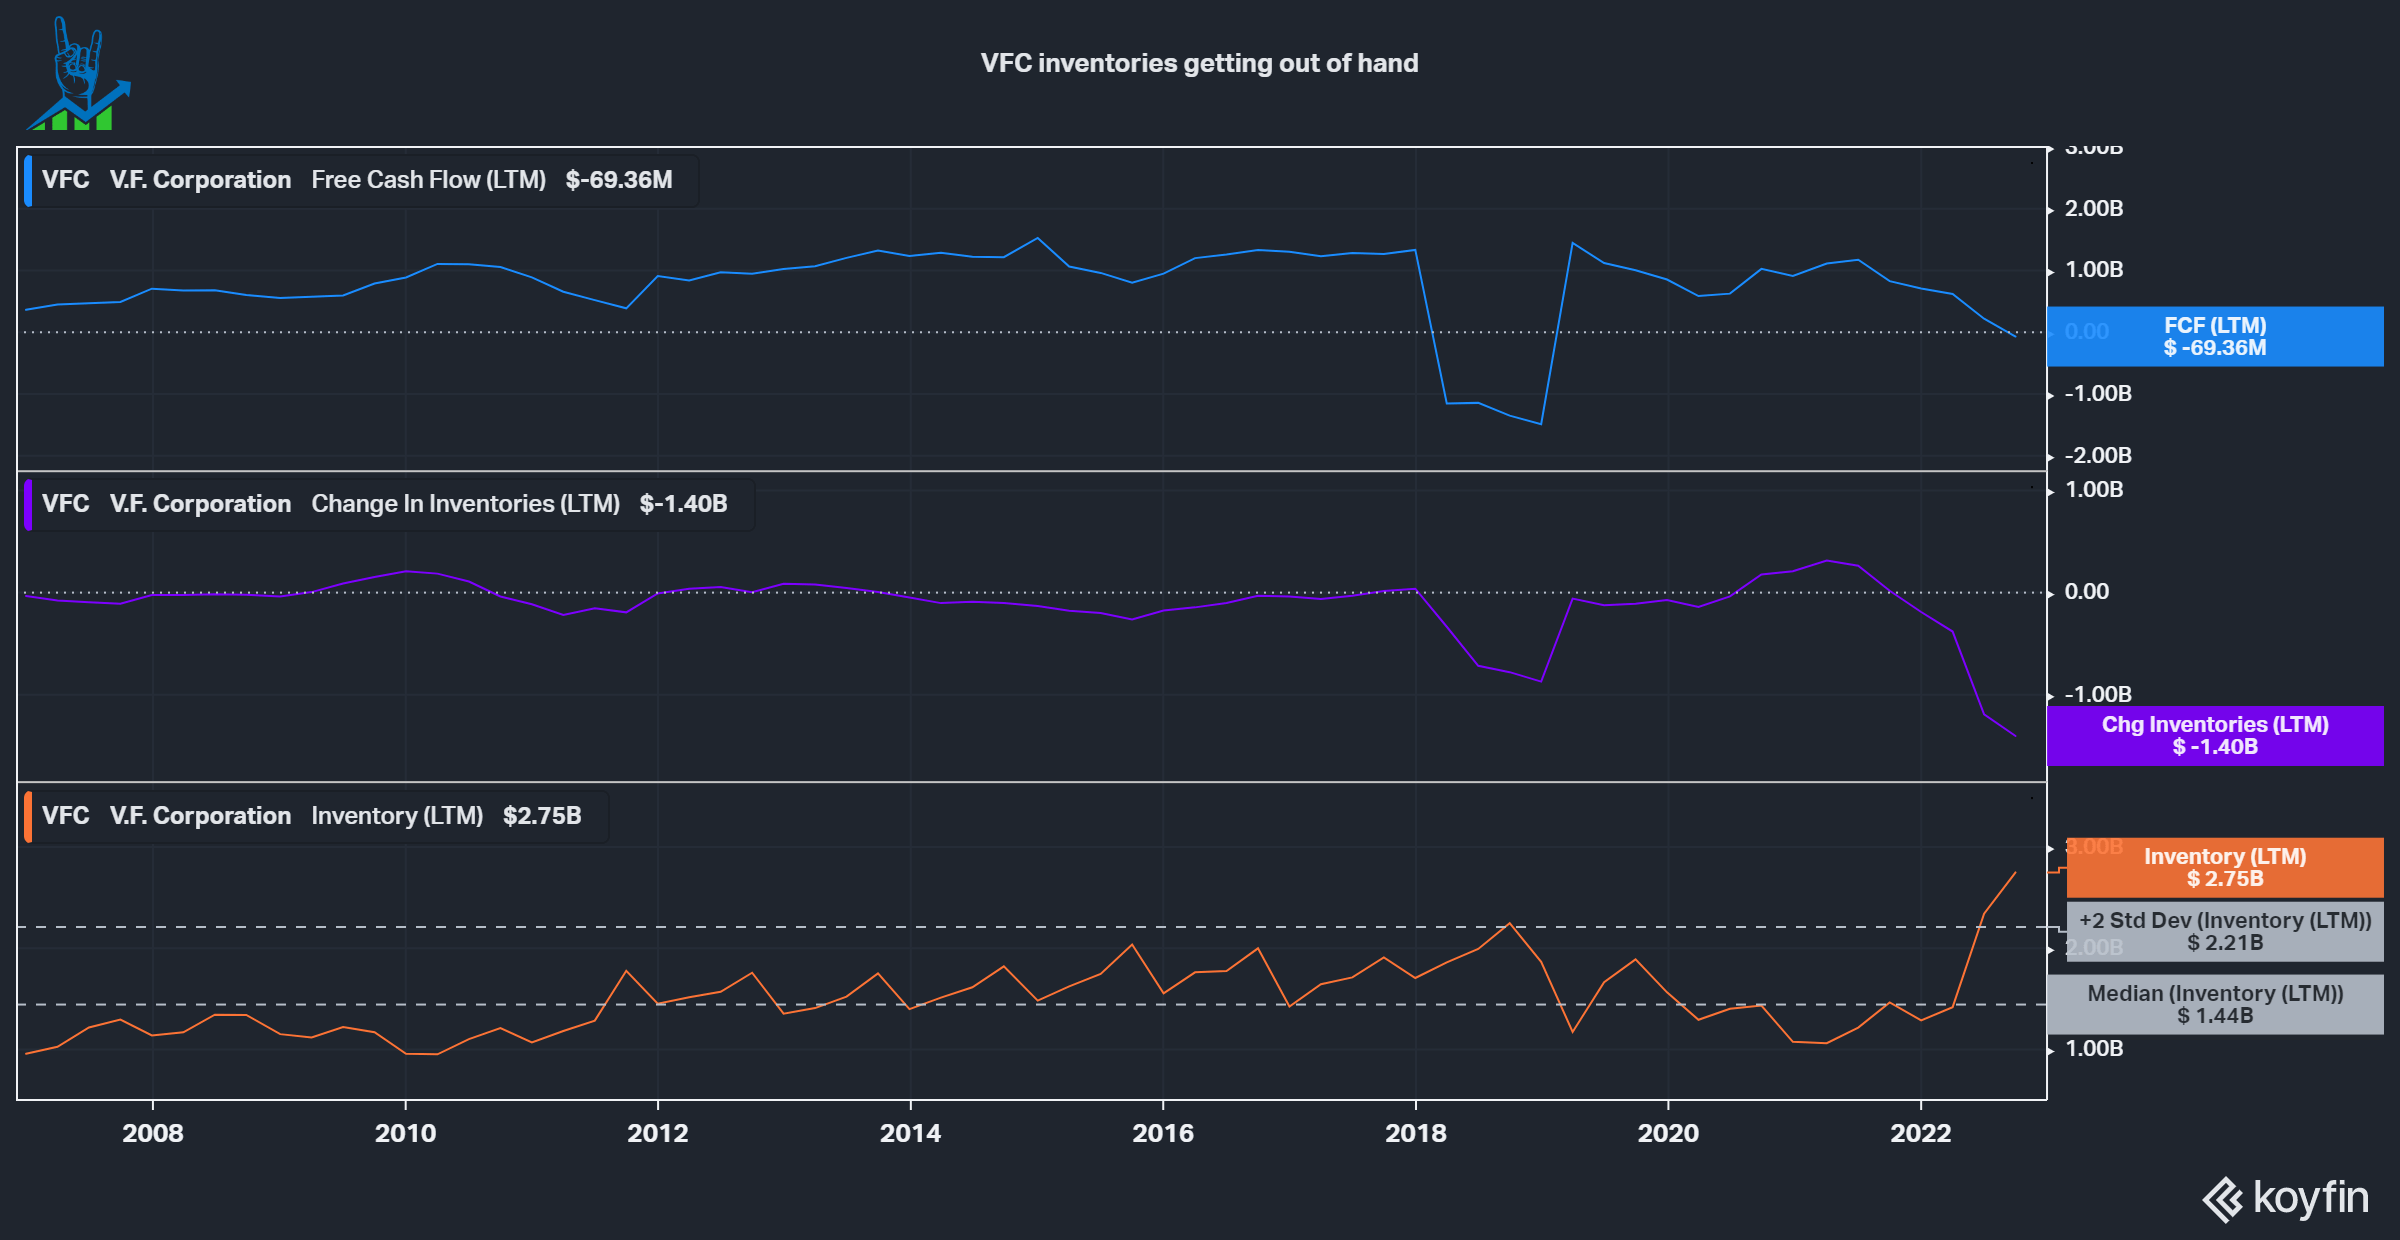
Management incentives
A vital part of a company’s management is its incentives, which should be aligned with shareholders. We can find this information in the latest Proxy, where the company said it is decreasing the weighting of Free Cash Flow at the expense of Net Income for executive compensation. I believe that to be a very unfitting decision amid a dramatic increase in inventories and, thus, plummeting FCF.
While the Barbey family owns 17% of VFC, according to Forbes, the insiders own less than 1% of the company. Furthermore, the company held an investor day in September, outlining a patch of growth to $5.5 billion in cumulative FCF until FY 2027. Yet, the word Inventories/Inventory was not mentioned a single time on 172 slides! Investors should decide for themselves if they believe that management is aligned with their interests under these circumstances.
VFC disincentivizing FCF (VFC proxy statement)
The company is also looking to sell its Jansport brand for $500 million to raise cash. Portfolio management still is a large part of VFC’s value proposition for shareholders, together with Dividends and buybacks. One should question the effectiveness of this approach after the company spent $2.1 billion in November of 2020 to acquire Supreme, arguably at one of its peaks in popularity (based on Google trends, see picture below), to add $600 million to the revenue of the company at a >20% operating margin.
Supreme search trends (Google trends)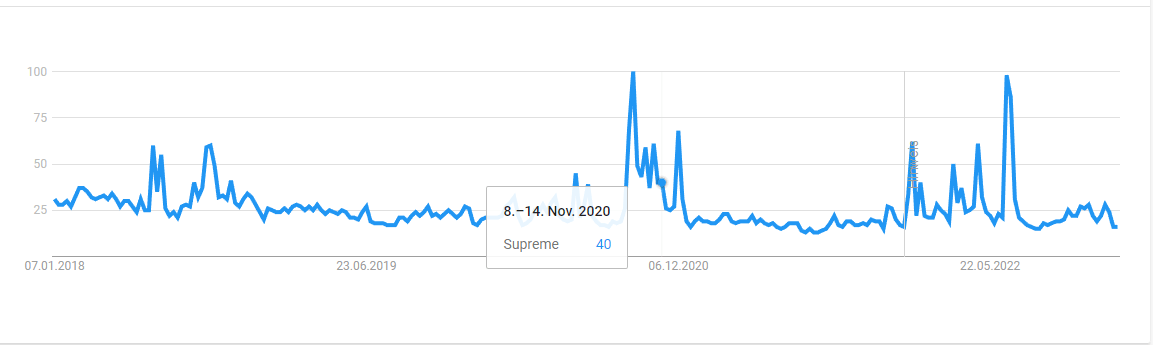
Management’s outlook is way too rosy
At the end of the investor day, VFC’s management paints a very rosy picture with a low double-digit to low teens expected organic total shareholder return. This should leave room for inorganic growth on top of acquisition (which I’d be careful about).
VFC TSR goal (VFC investor day)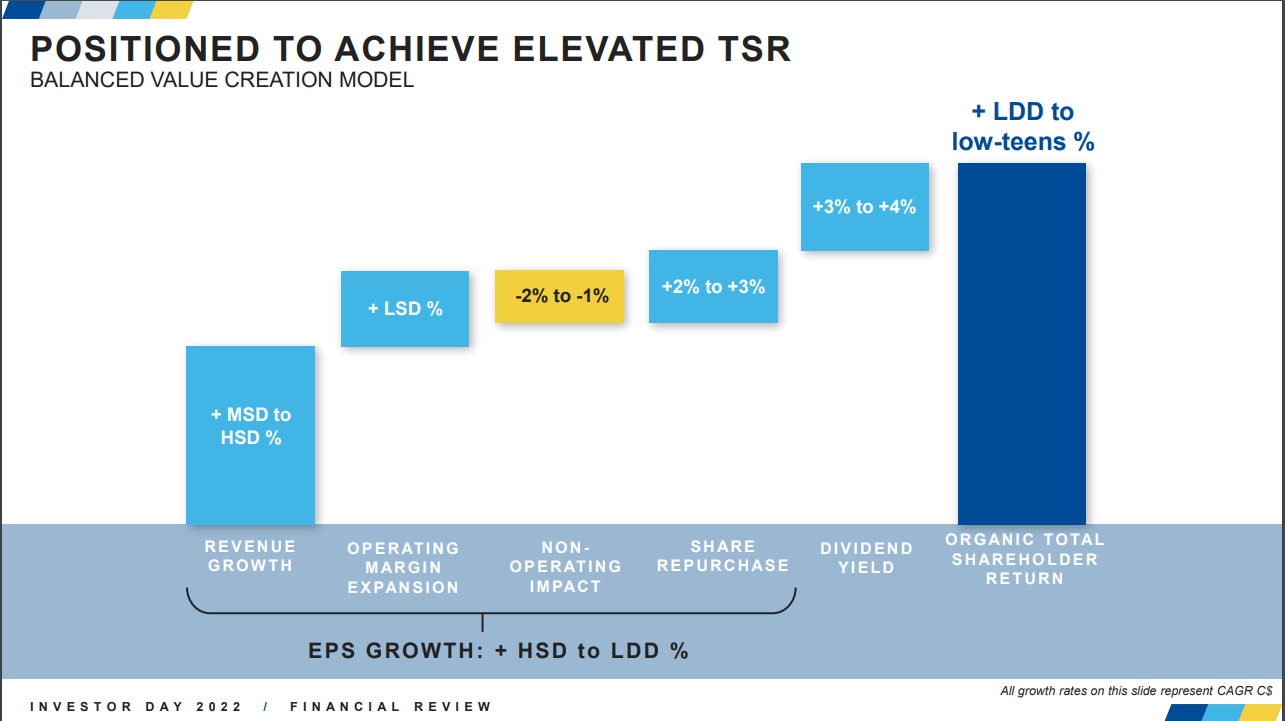
My question is, how do they expect to draw down the inventory and get cash flows back up? VFC has a portfolio of premium brands, potentially heading into a recession with mountains of debt and sky-high inventories. Furthermore, they are counting on 2-3% growth from repurchases. If we look at the past ten years, the company spent $5.59 billion on buybacks, that’s 95.5% of FCF in the same period. $5.59 billion is 52% of the current market cap of $10.73 billion, yet the share count only declined by 11.83% at the same time. Add on top of around $7 billion of dividends paid out in the same period and mediocre acquisitions and you understand why they had to take on loads of debt.
VFC terrible repurchases (Koyfin)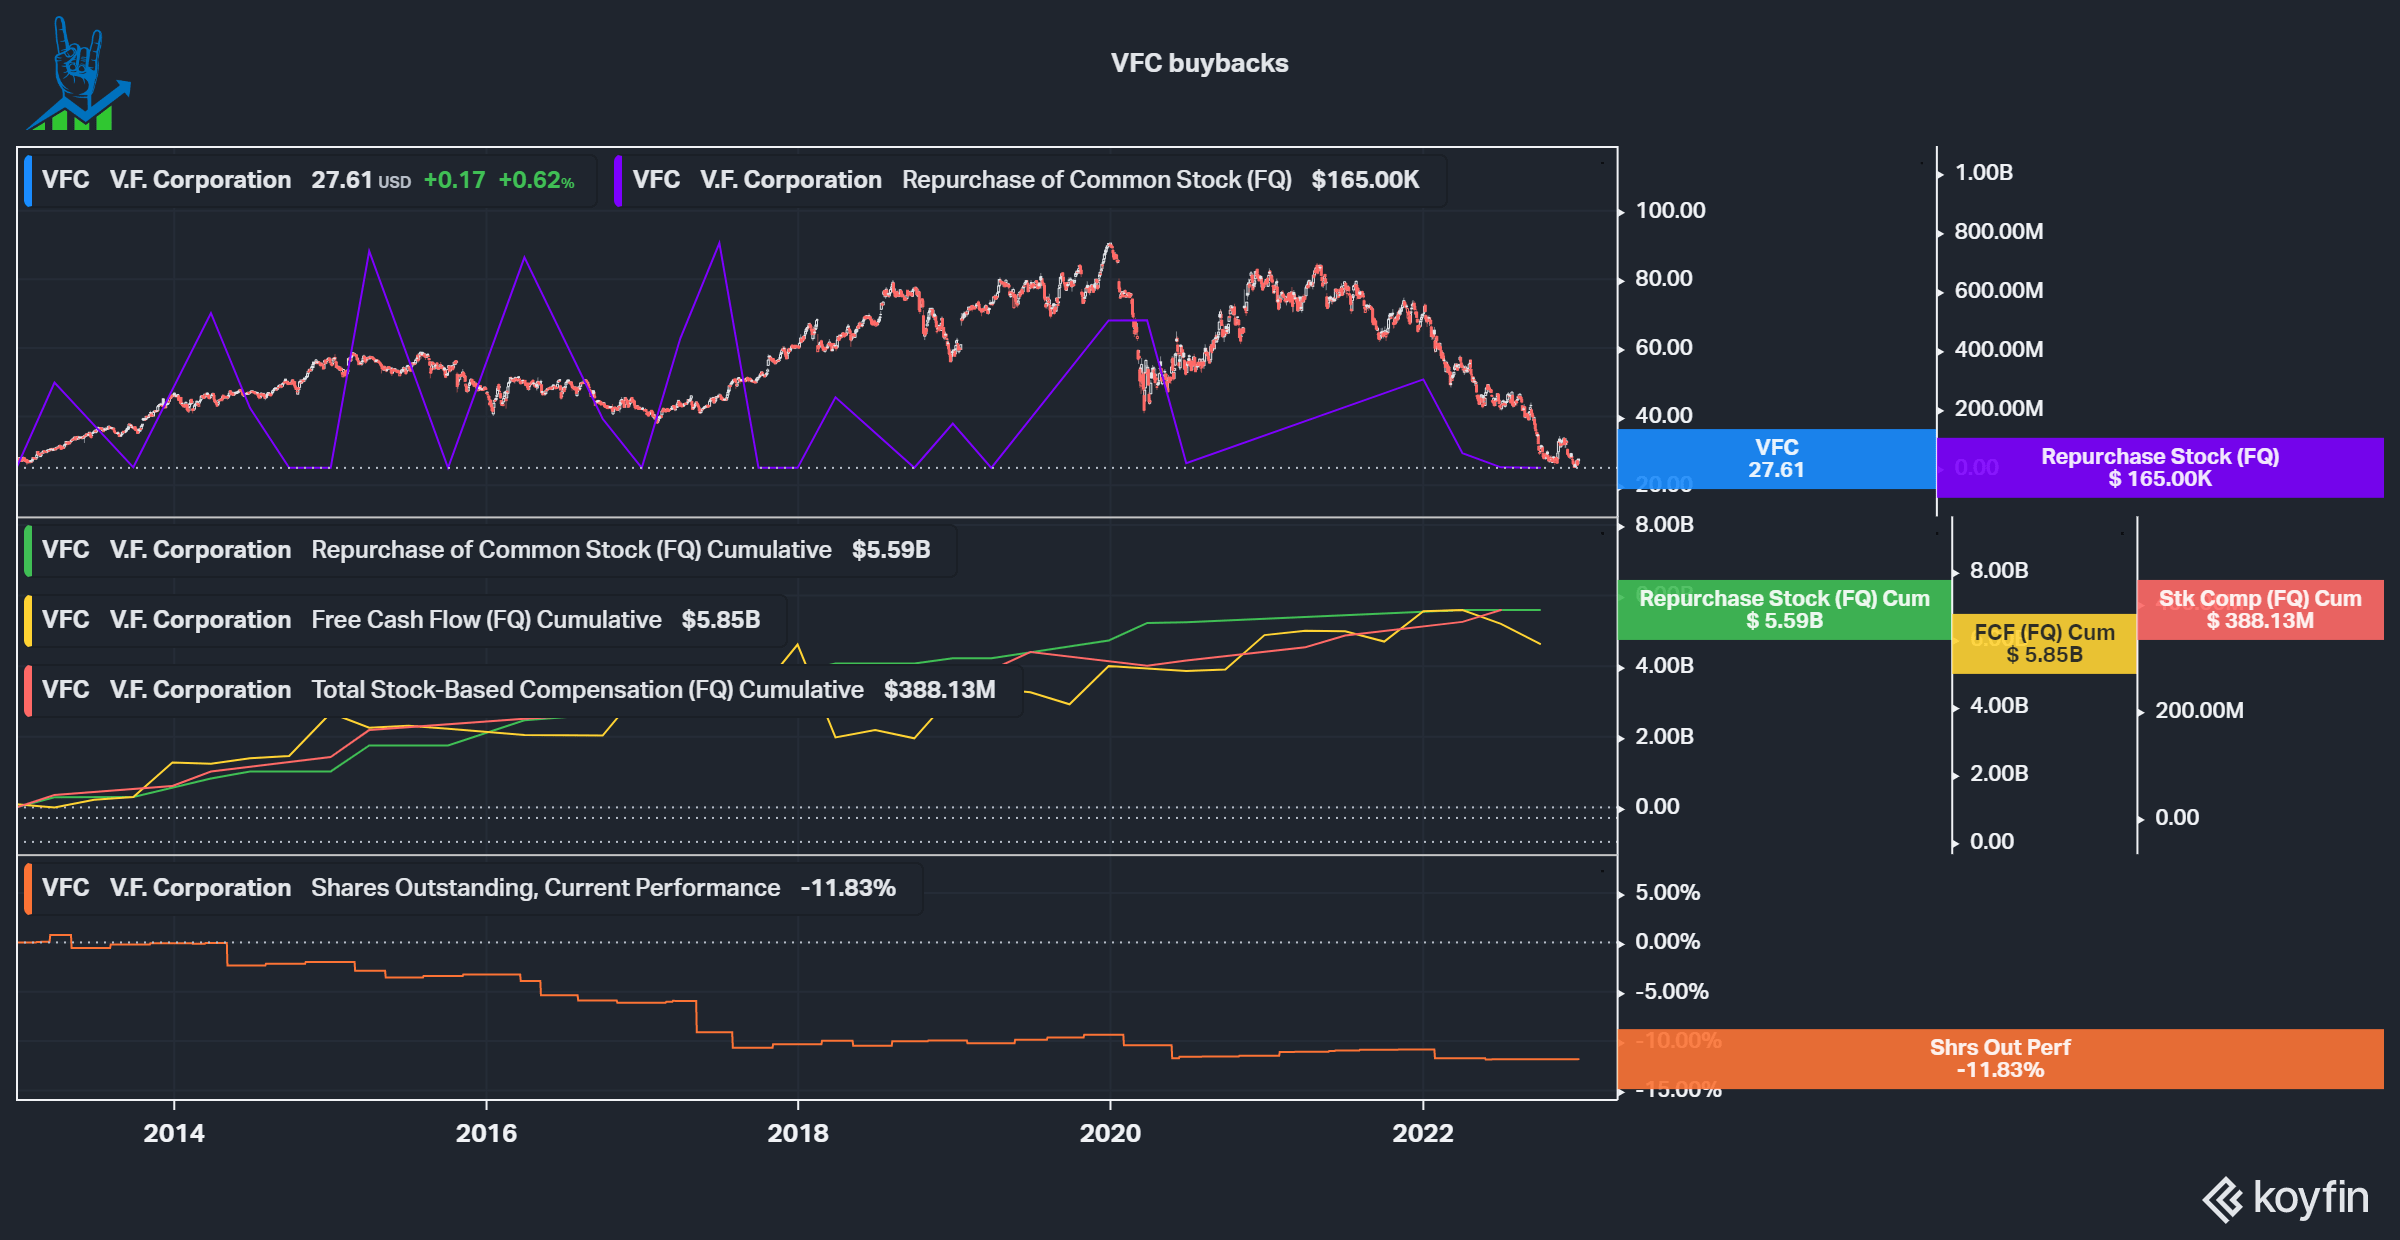
VFC is a light sell and the dividend isn’t safe
I wouldn’t bet on a turnaround here. When I looked at Stanley Black & Decker’s (SWK) inventory issues and resulting negative Free Cash Flow, the company was fast to present solutions to the problem instead of just picturing a rosy picture like VFC is doing. I do not see a clear path outlined by the management team here, which rather talks about their “consistent capital allocation” (Slide 162) while destroying shareholder capital for the last decade with this strategy. The entire investment plan of the company relies on a strong FCF generation to reinvest. Many things are going wrong:
- There is no communicated plan to shareholders about how to turn FCF positive again.
- The CEO suddenly quits and leaves the company with a temporary CEO.
- A history of misallocation of capital.
- Three significant negative earnings surprises in a row (6/8 of the last 8 were negative as well) and continued downward revisions of the guidance.
If we look at the numbers then yes, the stock is cheap. A forward EV/EBITDA valuation of 12.5x is below its ten-year median of 14x. I’ve thought quite a bit about whether or not to make it a sell or just a hold and I ended up choosing a sell rating, even though it could’ve also been a hold instead. I am not convinced by management to turn the ship around and that’s what a turnaround is all about in my opinion. Instead, management is heading for the exit (at least the CEO was)! There are many interesting opportunities out there right now, so I don’t see a reason to go for VFC. The company is loaded with debt and inventory and has a history of bad capital allocation. The stock might do alright, but I don’t expect it to match the SPY; thus, it is a sell in my eyes.
Of course, I could be proven wrong if the following things happen and the stock could be a home run:
- The company finds a great new CEO that turns the ship around.
- The macro increases significantly faster than expected, helping VFC to generate FCF.
- The company can achieve its goals laid out in the investor day by improving its operations.
- The supply chain situation gets resolved faster than expected.
Be the first to comment