


DNY59
The latest bear market pullback is now underway. After bottoming in mid-June, the U.S. stock market as measured by the S&P 500 posted an impressive rebound throughout the summer. Through early last week, stocks had posted a strong +19% bounce. But in the end, the summertime warmth for stocks eventually gave way to the chills of reality. Stocks are once again on the move to the downside. The question now is how far can we expect stocks to fall in this latest move lower.
The fundamental problem. The fact that stocks have resumed their slide to the downside should come as no surprise. What was arguably more surprising was the length and duration of the summertime stock market rally. Why? To begin with, it’s not like stocks were all that cheap trading at 19 times earnings on the S&P 500 when they first bottomed in June. And in the two months since, we saw various signs of slowing across the U.S. and global economy at a time when corporate profit forecasts were collectively slashed by nearly double-digits during the latest earnings season and the U.S. Federal Reserve was dropping successive 75 basis point rate hike bombs to combat high inflation. As a result, we are now left with stocks that are now trading at a pricey 22 times earnings on the S&P 500 that offers investors a scant risk premium over long-term U.S. Treasuries or the risk-free rate for that matter in an environment of persistent economic and market uncertainty as we head into the fall.
So why the summertime rally then? This is a great question to consider, as it may define the stock market environment in which we operate in the coming months if not potentially the next year or two. It’s been a long time now since investors have suffered a sustained stock bear market, so it’s worthwhile to reflect on how they traditionally work.
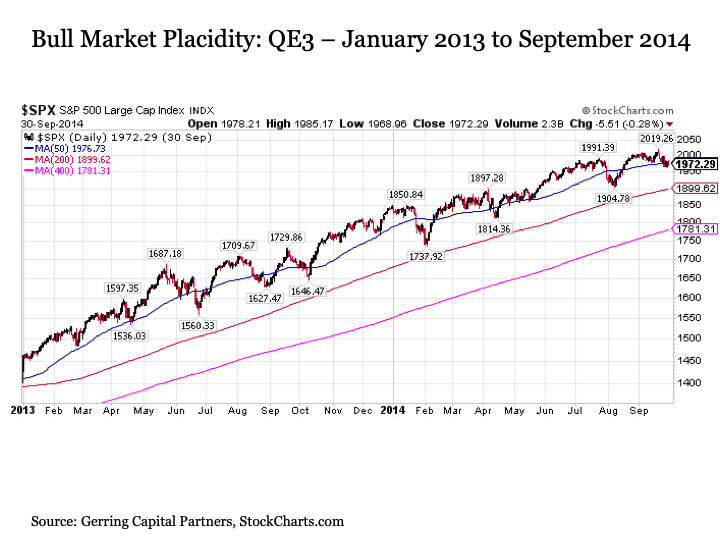
When stocks are in a bull market phase, the gains tend to be more uniform to the upside with less volatility. Periodic pullbacks or corrections take place, but they tend to be relatively short in duration and typically occur in the context of the larger uptrend. This was particularly true during large swaths of the post Great Financial Crisis bull market, as the steady flow of monetary stimulus from the U.S. Federal Reserve had effectively numbed the U.S. stock market into a state of placid euphoria. Two recent examples in the charts below highlight this phenomenon. The first is during the third round of quantitative easing from January 2013 to September 2014.
StockCharts
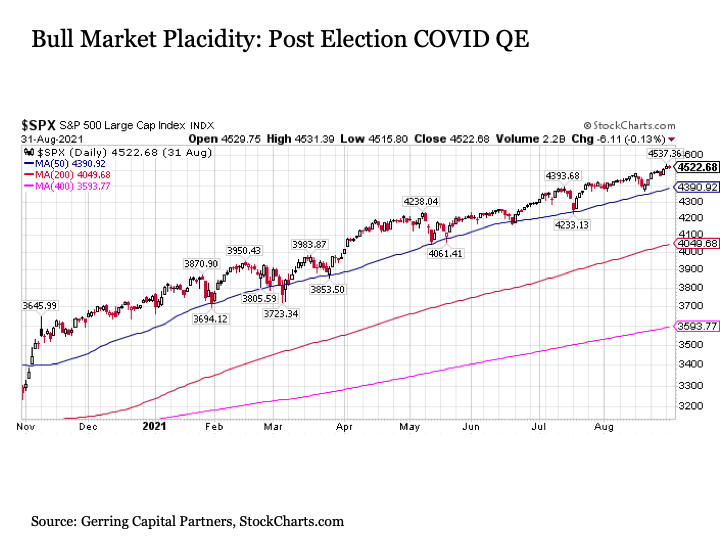
The second is during the post-election period during COVID from November 2020 to September 2021 when quantitative easing was still pouring on strong and inflation was only starting to heat up.
StockCharts
In both bull cases, stocks are moving higher with only very modest oscillations. Pullbacks were shallow, fleeting, and quickly bought.
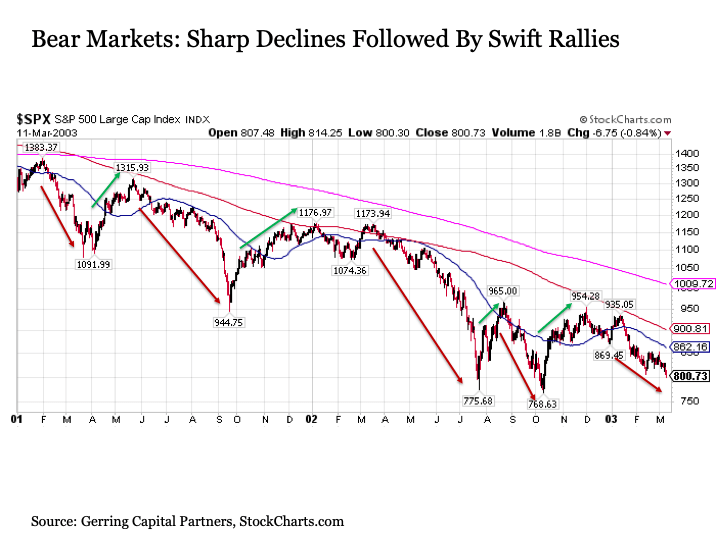
Bear markets in sharp contrast are defined by much bigger swings both to the downside and the upside. The bursting of the technology bubble provides a clear example in this regard, as five separate major declines during this period (red arrows in chart below) were followed by subsequent strong rallies (green arrows in chart below).
StockCharts
Put more directly, unlike bull markets to the upside, bear markets typically do not move in a straight line to the downside. Instead, bear markets are defined by staggering downside corrections followed by sharp upside rallies. The net of these moves is a stock market that ends up moving steadily lower over the longer term – lower highs and lower lows – but provides extended periods of upside hope along the way to lure investors back into stocks only to rip their hearts out with the next leg lower. This is why bear markets are so ruthless for stock investors, as many are not aware that their portfolio is trapped in the jaws of a bear market until it is too late.
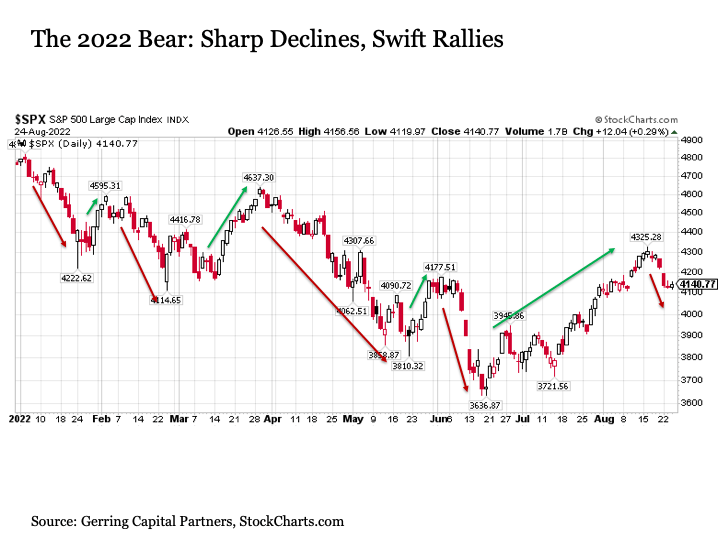
The way of the bear. Such is the environment in which we have been operating since the start of 2022. So far this year, we have seen five sharp declines to the downside followed by four strong rallies. What defines these movements over the longer-term period of time is that each pullback results in stocks setting new cycle lows.
StockCharts
With all of this in mind, how much more downside should we expect from the S&P 500 amid what appears to be its latest bear market decline?
First, let’s consider expected short-term movements. In its latest pullback after failing at 200-day moving average resistance (the red line in the chart below), the S&P 500 Index is already down by -5% from its peak from last week. In the process it has already slashed back below its ultra-long-term 400-day moving average (the pink line) and has since broken below its short-term 20-day moving average (the dotted green line).
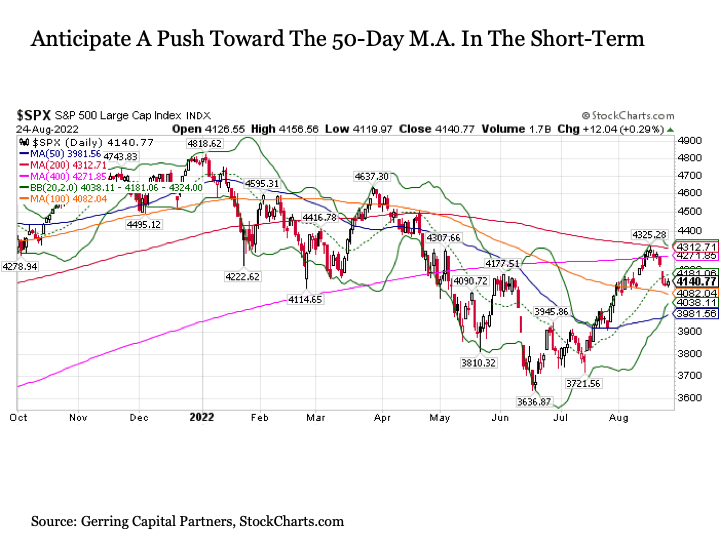
StockCharts
As a result, further downside should be expected on the S&P 500 in the near-term. The next support level is relatively weak at the 100-day moving average, which at 4086 is another 1% below Wednesday’s close at 4140. The more logical level for the S&P 500 to hope to find support is the medium-term 50-day moving average at 3981, which is another -4% below current level and roughly -8% below the recent peak.
But here is the problem when considering the longer term. When stocks are in a bear market, they typically set new lows during corrections. As a result, a move below 3637 on the S&P 500 Index should be anticipated with this latest move to the downside.
But what if the bear market is over? While this is a possibility, the problem is that the fundamentals do not support the 2022 bear market drawing to a close. Instead and as mentioned above, fundamentals support even further downside weakness in stock prices, not upside support.
So where could we reasonably expect stocks to bottom on this latest move lower? The period from Labor Day through mid-November just before Thanksgiving is historically treacherous during periods of broader weakness, so we should be prepared for potentially further and more sustained downside in the months ahead now that we are on the cusp of the start of September. With this in mind, the S&P 500 reentering its downward sloping trading channel during a pullback to the 3200 to 3600 range on the S&P 500 should be anticipated by investors over the coming weeks.
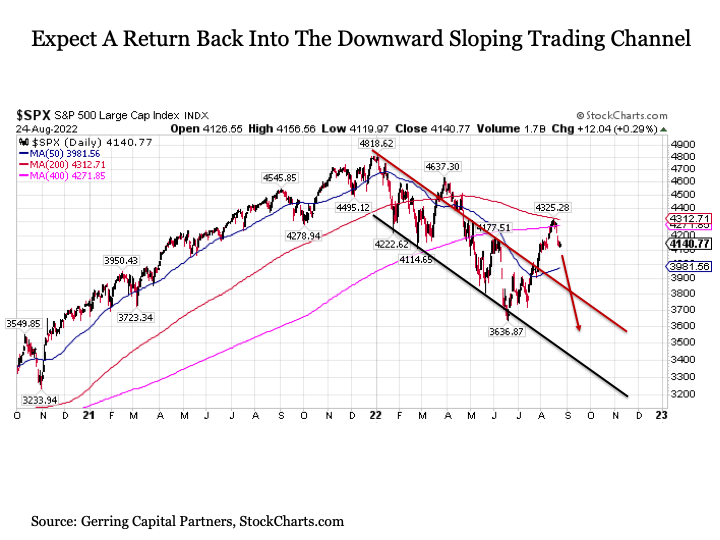
StockCharts
A different technical perspective provides added support to this potential move toward 3200 on the S&P 500 through the fall of 2022. When considering the moves through successive major peaks and troughs during this 2022 bear market, the S&P 500 has been moving to the downside in a widening oscillation pattern. This implies the potential for a more pronounced downside move in the coming months in keeping with this technical setup.
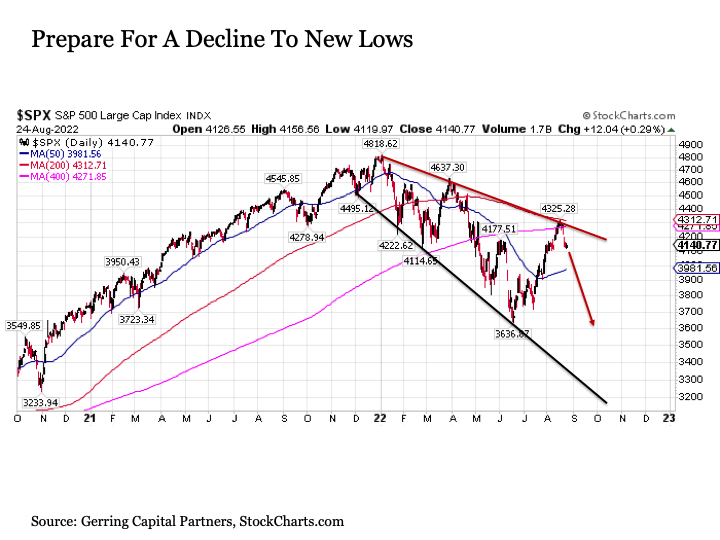
StockCharts
Bottom line. It has been a promising summer for stocks, but unfortunately, we have seen this script before. Bear markets provide investors with encouragingly strong rallies for extended periods, only to give it all back and more to the downside before it’s all said and done. And it appears that over the past week we have entered into the latest bear market swing to the downside.
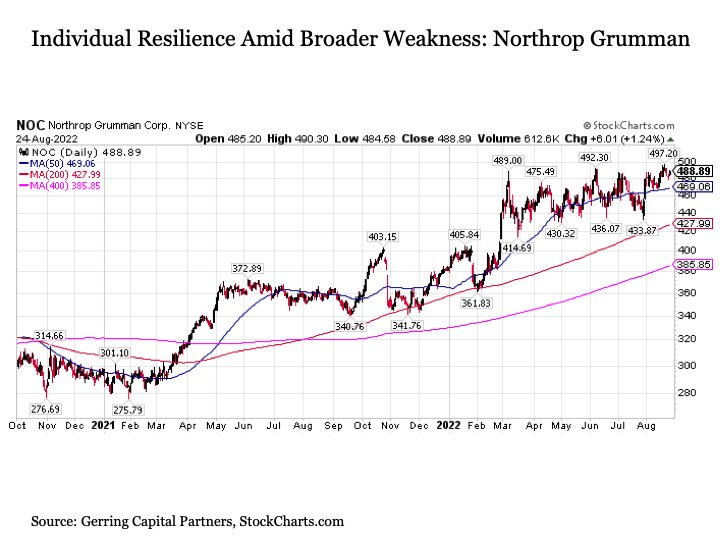
This leads to an important note. Just because the broader S&P 500 may be tumbling lower does not mean that all 503 stocks in the index are moving uniformly to the downside. A stock index is an index of stocks, and we continue to operate in an environment where selectively targeted active management can still be rewarded. For example, the fundamental case for owning military defense stocks is strong for a number of reasons, and the persistent strength of Northrop Grumman (NOC) in the face of broader market weakness is just one example of the type of resilience that can be found in the marketplace today.
StockCharts
Another company bucking the trend is Kellogg (K), which is pushing to new highs as the broader market gives way to the downside. Food companies have historically performed well during bear markets during their defensive characteristics – regardless of how badly the economy is doing, people still have to eat – and deeply discounted valuations across the food industry add to the appeal of these names in the current market environment.
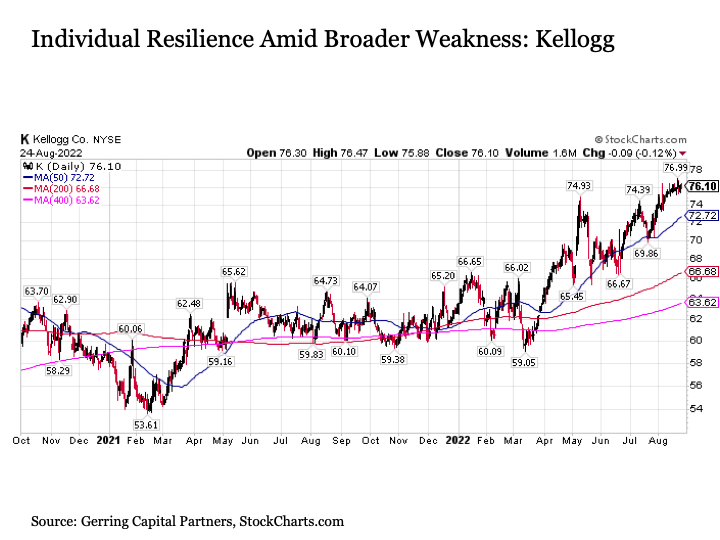
StockCharts
These are just a few of the numerous individual upside opportunities that continue to exist in today’s marketplace even if the broader market continues to give way to the downside in the coming weeks.
Be the first to comment