

niphon
This article will examine if the recent rally in STORE Capital Corporation (NYSE:STOR) gives me enough confidence to initiate a position. I will use a technical analysis perspective to see if there is a compelling argument to initiate a position in STOR and look at price targets and stop losses to mitigate risk.
When I invest, I like to buy companies that are moving higher and are outperforming the SP 500 index. I don’t think I am that much different than many of readers of the Seeking Alpha website in this regard. What may make me a little different is that I use a technical analysis or price action approach to choose my investments. So, to get started, let’s look at the Real Estate Select Sector SPRD Fund (XLRE) and see how it compares to the SP 500 index.
Chart 1 – XLRE Weekly and Relative Strength Ratio
www.stockcharts.com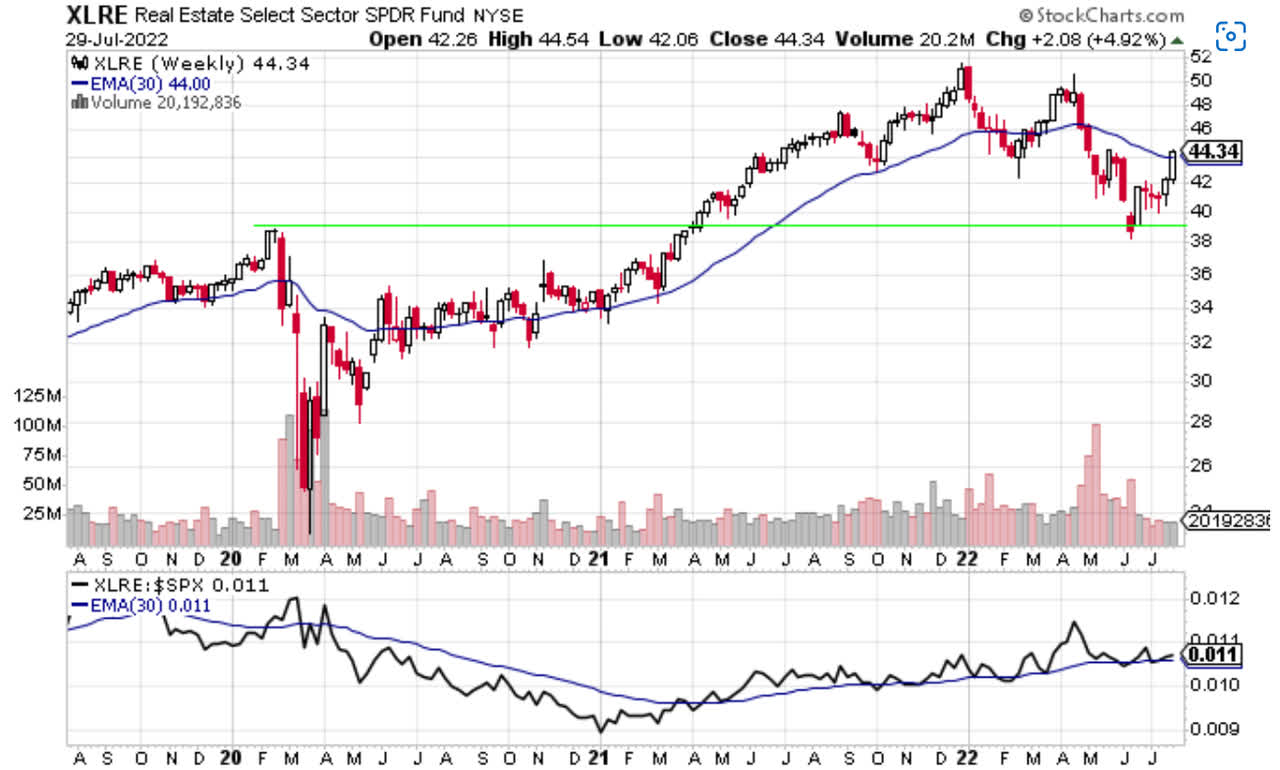
Chart 1 above shows the price action of XLRE. You can see that XLRE came out of the COVID-19 low in June 2020 and then consolidated until the end of 2020. From there it started trending higher and staying above the blue 30-week moving average. I use the 30-week moving average as an intermediate term timing tool. When price is above the moving average and the moving average is trending higher, that is considered bullish. When price is below the moving average and the moving average is trending lower that is considered bearish.
XLRE topped out at the end of 2022 and then started its decline. Its most recent low was made in June and from there XLRE has risen 6 points or about 16%. Three aspects intrigue me about this price action. The first is that XLRE has closed above the 30-week moving average. That is bullish. The second aspect is that XLRE has stayed above the green line on Chart 1. That green line was a level of resistance back in the Spring of 2020 and now acts as support as price closed above the green line in April 2021 and has bounce off support most recently in June. The longer XLRE stays above that level of support, the more bullish I would be on XLRE moving forward.
The third aspect of the chart is that the blue 30-week moving average line is not trending higher. At best it is flattening out, which is needed before it does turn higher. In other words, the declining or flat 30-week moving average line makes me cautious about REITs continuing to move higher from here. It would not surprise me if XLRE consolidates at this price level like it did from June 2020 to November 2020.
The lower pane of Chart 1 shows the relative strength of XLRE to the SP 500 index. When the black line is moving higher that means the XLRE is outperforming the major index. When the black line is trending lower that means that XLRE is underperforming the major index. These relative strength ratio charts are great tools for investors to use to help them establish the sectors, industries, and companies that are outperforming a particular benchmark. We can see in this ratio that XLRE has outperformed the SP 500 index since January 2021. For the most part the ratio has stayed above the rising 30-week moving average. That is bullish.
Putting these two tools together, we can see that XLRE is a sector we want to be in since it is outperforming the major index and that XLRE has closed above its 30-week moving average which has preceded major price advances in the past. We would feel better about the future price action of XLRE if the blue 30-week moving average line starts trending higher.
Now let’s use the same techniques on STOR. See Chart 2 below.
Chart 2 – STOR Weekly and Relative Strength Ratios
www.stockcharts.com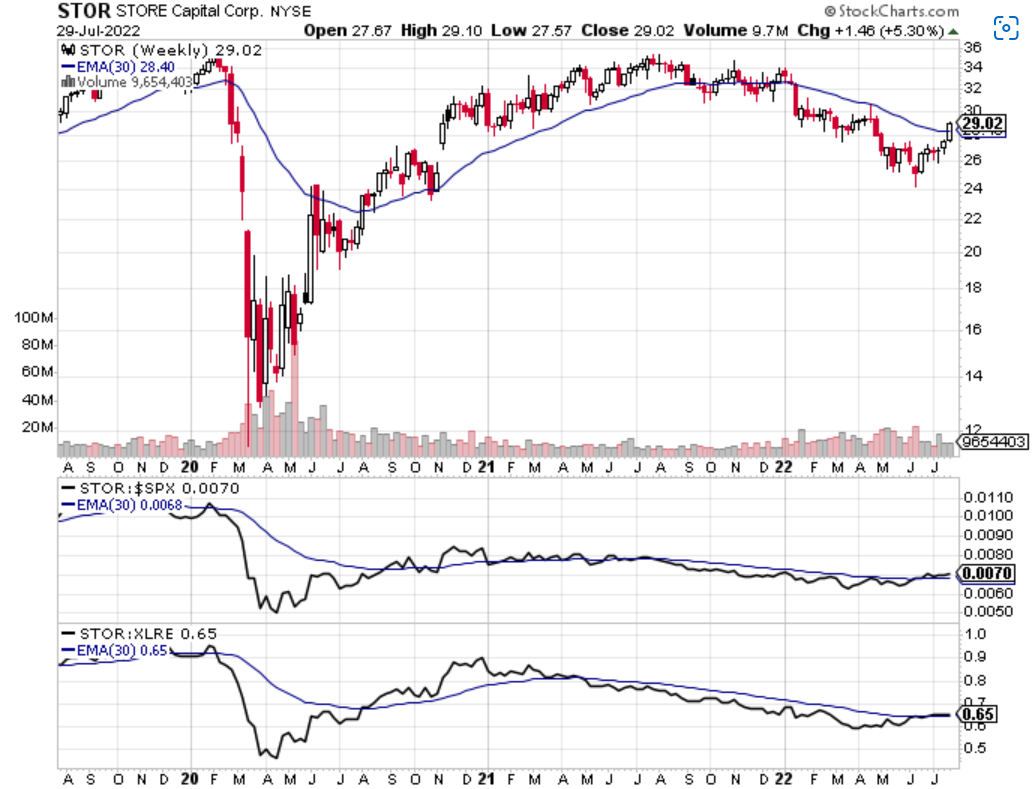
We can see that STOR had a massive drop during COVID. It dropped almost 70% in six weeks. Ouch! STOR then consolidated for ten weeks and then started moving higher. It closed above its 30-week moving average in August 2020. That would have been a good entry point using a simple cross over strategy technique. STOR then proceeded to rally 50% over the next 12 months. The 30-week moving average was a good proxy for staying invested in STOR. I know that STOR closed below its 30-week moving average in October 2020. When one of my positions closes below its 30-week moving average I look to sell all or part of that position if price goes below that candle’s low the following week. In this case that never happened. After STOR closed below the 30-week moving average, STOR rallied the next week. It never dropped below the candle that closed below the 30-week moving average. Your position in STOR would have been maintained until September 2021. Investors using this simple moving average cross over technique would have netted a 35% gain.
Since August 2021, STOR has made a series of lower highs and lower lows. That is the textbook definition of bearish trend. Perhaps that trend is changing. Since June, STOR has rallied about 20%. STOR also closed above its 30-week moving average for the first time since the beginning of the year.
Looking at the two lower panes for relative strength, you can see that STOR is even to a little stronger than XLRE and is outperforming the SP 500 index. The 30-week moving averages are flat in both cases after trending lower. The next step would be for those moving averages to start trending higher showing serious outperformance.
Chart 3 – STOR Daily
www.stockcharts.com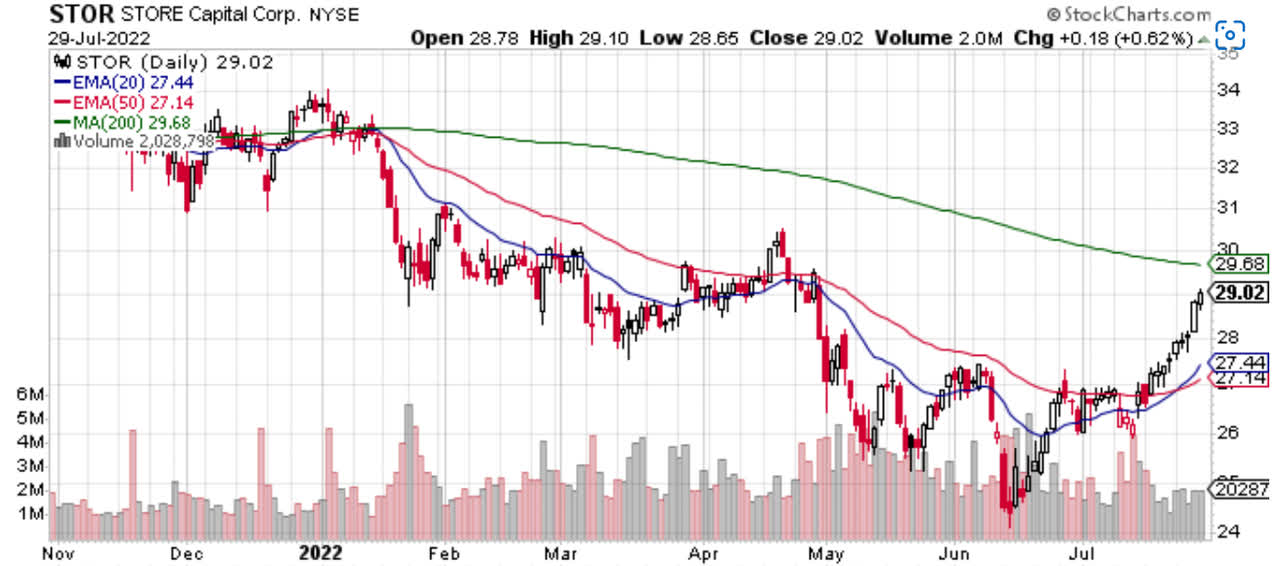
Chart 3 shows the daily price action for STOR for the last nine months. STOR has been in a downtrend but there are signs of that trend reversing on the daily chart. The first sign is that price reached its low in mid-June at just above $24. It then rallied to just above $27 in late June. Price then consolidated rather than reversing to a new low. STOR then moved from $26 to its current price making a higher high. That is a bullish development.
Secondly, price has closed above its 20-day moving average (blue line) and 50-day moving average (red line) and price has stayed above both moving averages for a few weeks. That is a bullish development which hasn’t been seen since late last year. The third sign of a trend change is that the 20-day moving average crossed above the 50-day moving average. That occurrence has not been seen since late last year. The next bullish step for STOR to take is for price to close above and stay above its green 200-day moving average. That moving average is a common long-term proxy to determine if a stock is bullish or bearish.
All trend changes start on the lower time frames. Looking at Chart 3, I see enough trend change evidence to allow me to start a position in STOR. That is why I say I am willing to take a partial position now. If STOR continues to trend higher and act bullish, I can simply add to my position. I prefer to add to winning positions as opposed to add to losing positions. A good place to add for me may be when STOR closes above its 200-day moving average. Keep in mind that STOR could turn down and take out its June lows due to a bad earnings report, negative news on the economy, the overall market turning lower, etc. STOR reports earnings on 3 August after the market closes.
I will be initiating a position in STOR on Monday. My intermediate outlook is for STOR to challenge its previous highs of $35.50. That is not a predication of where STOR will go but a profit target that gives me a favorable risk to reward ratio. It’s possible that STOR goes much higher. It’s also possible that my analysis is incorrect. That is why I use a stop loss.
With that in mind, I will set my initial stop loss to sell part of my position if STOR drops below $25.75. I would look to exit my position entirely if the June lows are exceeded. At that point my analysis would be proven incorrect. Then I simply look to preserve what capital I have left and find my next investment.
Be the first to comment