

Spencer Platt/Getty Images News
Thursday’s (November 10th) monster rally in the stock market (the Dow Jones Industrials rose 1,200 points, almost 4%) on slightly better CPI inflation data for October was the epitome of a “relief rally” during a bear market. That’s my opinion, while other knowledgeable heavyweights (billionaire traders, in fact) like Carl Icahn agree. Mr. Icahn appeared on CNBC after the close, explaining his worries and logic to continue holding many short positions.
I am not currently holding shorts or index put option hedges. I have been holding between 60% and 100% of my portfolios in cash the whole year. Luckily, my large 20% long position in precious metals gained with stocks this week, and a 15% weighting in regular equities rode higher with the rush of Wall Street buying. Did I conclude the bottom is in, and follow the crowd into a greater equity weighting? No, I did the opposite. I actually sold some longs into the huge rally, reducing my equity exposure (outside of gold/silver/platinum miners and assets) from 15% to less than 10%.
Why am I suspicious of the rally? The main reason is the Treasury debt-market yield curve is screaming a recession is getting close. The Federal Reserve will not be happy with 7% CPI. This rate needs to fall back dramatically for financial stability, with several Fed members coming out today to say rates will still rise at the next FOMC meeting. So, if interest rates are rising into 2023, and the full effect of the incredible bear market in bonds takes 6-12 months (on average) to play out in the economy, I remain concerned corporate profits are going to tank in the first half of 2023. That’s how the world has worked in the past. The structure of the yield curve since October, now “officially” inverted between 3-month and 10-year Treasuries (the level where short-term rates constrict liquidity and loan creation), is screaming major trouble for the economy is dead ahead.
Statistically speaking, since 1982, EVERY inversion has led to lower stock prices, sometimes immediately, sometimes a year or more later. My suggestion is, don’t get over-enthused by the spike higher in share quotes this week. Could Wall Street zigzag in a bullish direction for another couple of weeks or months? Sure, but any further rally should be aggressively sold, not bought. Here’s why…
Inverted Yield Curve – Horrible News for Dow Industrials
When you review economic history, many of the worst times to own regular stocks (especially industrial names) occur between the moment an inverted bond yield curve appears and the middle of a recession (often caused by the inversion). Several weeks ago here, I talked about the problems for our economy being created by the 2022 bond market slide. This story is a companion piece reviewing more directly how the Dow Jones Industrial Average reacts during and after yield curve inversions, with the SPDR Dow Jones Industrial Average ETF (NYSEARCA:DIA) the easiest way to trade it.
Below are charts comparing 3-month Treasury rates with 10-year yields. When short-term rates are higher than long-term ones, we get a positive number for my “inversion” indicator. Recessions are shaded in grey since 1982.
YCharts – Treasury Inversion, 3-Month Duration Minus 10-Year Rate, Since 1982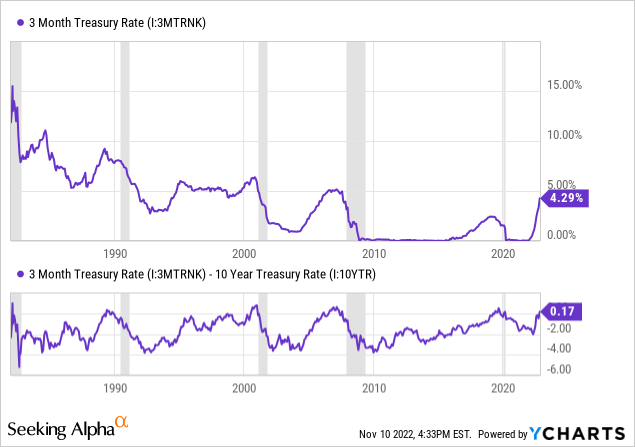
Next, we can review the Dow Jones Industrial reaction to inverted yield curves. 2020 and 1982 saw inverted curves during a recession. Usually, bond market trouble appears first, and the economy/stock market turn lower 6-12 months later.
YCharts – Dow Industrials Price, Yield Curve Inversion, Recessions Shaded, Since 1982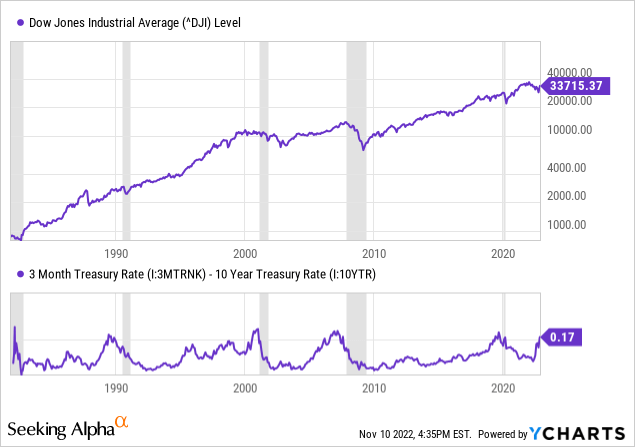
2019-2020
Zooming in, we can dissect each contraction in liquidity (loan origination) and correlated recession in economic activity. The last Treasury market inversion took place in the middle of 2019 and again as the pandemic recession started in 2020. From the first point of inversion in June 2019, the Dow Industrials rose another 10%, before crashing 30% during the COVID-19 pandemic shutdown.
YCharts – Dow Industrials Price vs. Inverted Yield Curve, Author Reference Points, May 2019 to April 2020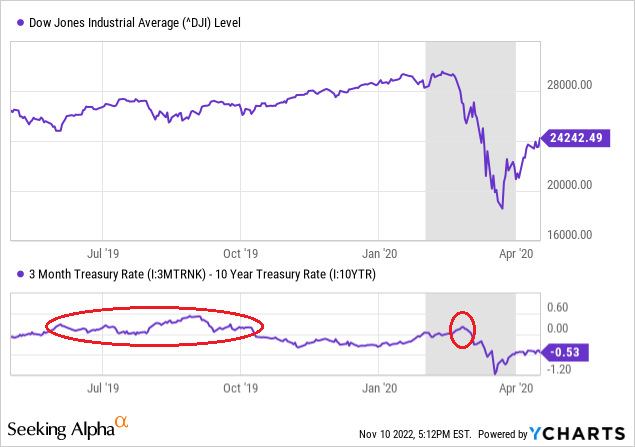
2006-2009
Leading us into the Great Recession banking crisis and real estate bust, Treasury yields inverted in late 2006 and early 2007. From August 2006, the Dow continued another 20% higher into late 2007 before imploding 50% over the next year and a half.
YCharts – Dow Industrials Price vs. Inverted Yield Curve, Author Reference Point, January 2006 to Sept 2009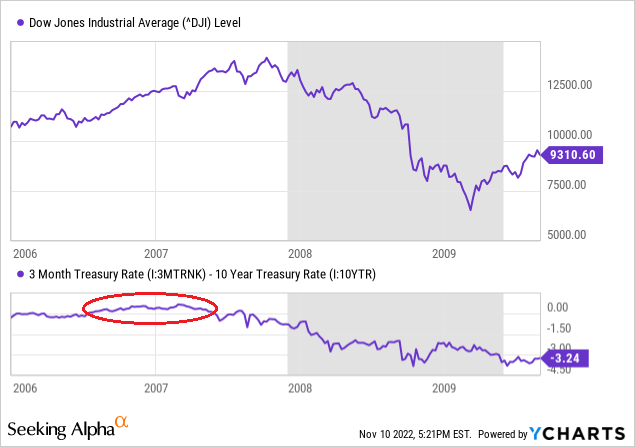
2000-2002
The Dow Industrials peaked in January 2000, the year of the Dotcom tech boom reversal into bust. In this instance, many stocks topped before the Treasury yield inversion showed up in the second half of the year. Measured from peak to trough, the Dow fell almost 40% into October 2002. From the initial bond market inversion, prices declined 30%.
YCharts – Dow Industrials Price vs. Inverted Yield Curve, Author Reference Point, January 2000 to Dec 2002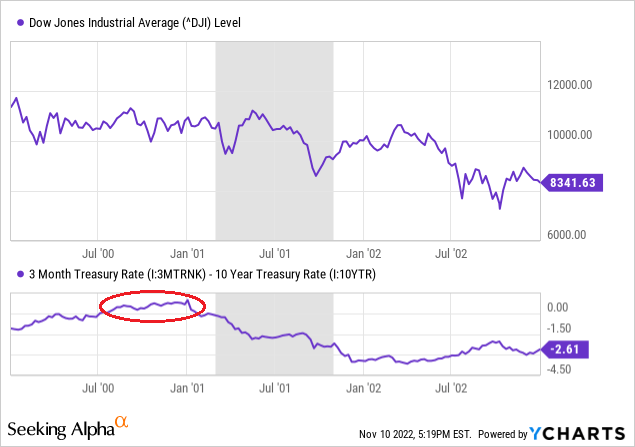
1989-1991
We have to go back a decade to find another Treasury inversion example. Starting in the middle of 1989 and flashing again in November-December, short-term rates rose above long-term yields. By January 1990, most stocks peaked, while the Dow was able to zigzag higher into July. Measured from the initial June 1989 inversion, the Dow was able to rise another 20%, before dropping 20%+ on the oil spike and Persian Gulf War with Iraq in the autumn of 1990.
YCharts – Dow Industrials Price vs. Inverted Yield Curve, Author Reference Points, May 1989 to March 1991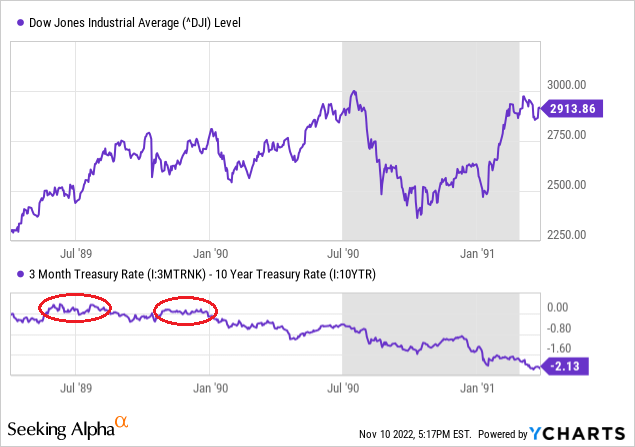
1982
1979-82 experienced considerable stagflation and several defined recessions in real GDP output. For our purposes, the 1982 inversion was unique in the fact it occurred in the middle of a prolonged economic contraction (with some similarities to the 2020 pandemic instance). The inversion first appeared in February 1982, with the Dow falling another 15% over six months (using intraday stats).
YCharts – Dow Industrials Price vs. Inverted Yield Curve, Author Reference Point, January to December 1982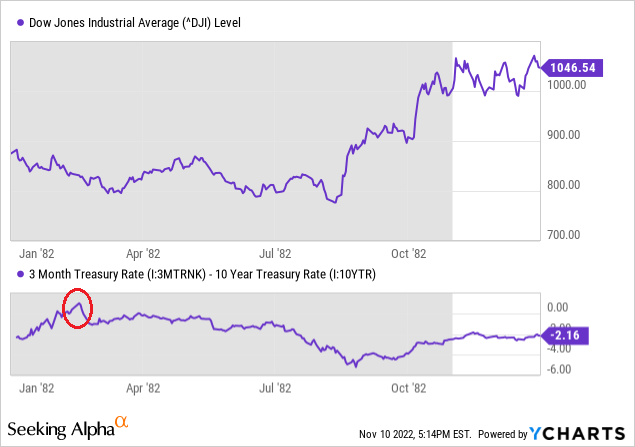
Final Thoughts
The implosion in bitcoin and cryptocurrencies this week are new pieces of the evaporating liquidity puzzle, telegraphing real issues are starting to crop up for the financial system. Rumors of poor system liquidity in the Treasury market have persisted for several months. The inverted Treasury yield curve is a serious development, and more evidence of trouble for the economy is coming soon.
A side argument against a lasting equity bottom in October, Thursday’s spike in share prices outpaced gold/silver bullion. Effectively, the monetary metals failed to keep up with the percentage gain in equities generally (and are lagging the advance from early October). My belief, which I have discussed many times since the summer, is precious metals should rally first and faster than the overall stock market into and after the final low. Precious metals tend to rebound quickly out of a liquidity crisis and/or recession. Yes, gold, silver, and platinum are beginning to perk up a little. For me to read Thursday’s action as part of a new multi-year bull market, I would expect precious metals bullion prices to rise strongly in the coming weeks. If they don’t, the Wall Street bottom has not yet arrived.
Other major U.S. indexes and ETFs, including the SPDR S&P 500 (SPY), iShares Russell 2000 (IWM) and Invesco NASDAQ 100 (QQQ) will surely follow the Dow Industrials lower from today in the not-too-distant future. If you believe Wall Street can fight the horrific bond yield setup and a weakening economy next year, you may be suffering from the “I believe it’s different this time” investment disease.
Historically, stocks DO bottom and reverse higher near the middle to end of a recession (which has not even begun into November), weeks or months after the Fed has “pivoted” from raising rates to cutting them dramatically.
I hope I am wrong and wish I had better news for readers. But my job is to report to you the way I see it, based on 36 years of trading and investing. This bear market could take another 3-6 months (or longer) to find a lasting bottom. Patience will be required. In the end, your pocketbook and long-term wealth may depend on you thinking prudently and waiting for a smarter (maybe much lower) entry point for U.S. equities.
Again, my risk-adjusted suggestion is to just sit in cash and cash-like investments paying 3% to 4% for annual interest (CDs, money markets, Treasury Bills). Direct market hedges are too expensive in my mind, and the market may not slide immediately from today. It’s OK to hold some stocks, just keep your weightings on the low side. Now is not the time to be a hero or leveraged long in any shape or form. Trust me, you will sleep soundly at night when big down days resume for the market.
I am reluctantly moving my 12-month rating for U.S. market index ETFs into a Sell posture vs. the Hold setting I have suggested since May. The odds now favor a flat to lower stock market into October 2023.
I place potential upside reward for the U.S. equity market at a low +5% to +10% over the next 12 months, especially with dividend yields near record lows at 1.6%. Theoretical downside in a severe recession could be as high as -30% to -40%.
Hopefully, the bulk of the bearish selloff will be over by March. However, a steep 20%+ drop for the Dow Industrials and S&P 500 into January could flip the Fed into an easing liquidity stance to support the economy. Such a scenario could provide the foundation for a lasting bottom on Wall Street.
Thanks for reading. Please consider this article a first step in your due diligence process. Consulting with a registered and experienced investment advisor is recommended before making any trade.
Be the first to comment