

DjelicS/E+ via Getty Images
WD-40 Company (NASDAQ:WDFC) is well-known by many. Its blue, yellow and red can is easily recognizable and helps people solve everyday problems with anything that should move, but doesn’t. Its namesake product has over 2000 documented uses.
WD-40 is a global company with the Americas providing ~44% of sales, the EMEA region 43%, and the Asia-Pacific area 13% for Q2. Management expects the Asia-Pacific region to grow the fastest as they have the least penetration in that market, followed by EMEA, and then the Americas.
WD-40 (WD-40 FY 2022 Q2 Earnings Presentation)
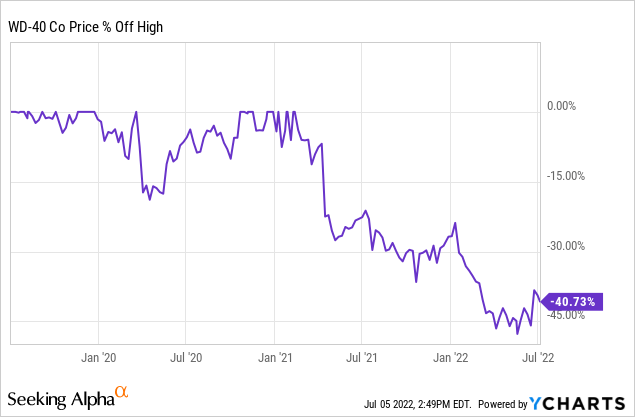
When I last examined WD-40, it appeared very richly valued with sky high prospects for an otherwise slow and steady business. WD-40’s share price is down over 40% since its high reached in early 2021. Seeing that kind of decline made me want to take another look to see if the risk:reward ratio has changed.
Dividend History
The dividend growth investment strategy is the one that most appealed to me when I first began investing. It’s a simple strategy in that you aim to buy, at reasonable valuations, quality businesses that have a history of paying and consistently growing their dividend over time.
WD-40 Dividend History (WDFC Investor Relations)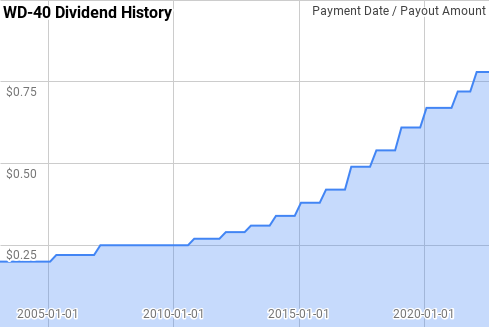
WD-40’s dividend growth took a brief pause in both 2008 and 2009; however, since then raises have come every single year. Their streak is up to 13 consecutive years of growth, assuming the 4Q 2022 payment is made at $0.78 per share.
During WD-40’s current streak year over year dividend growth has ranged from 2.0% to 16.7% with an average of 9.2% and a median of 9.8%.
Dating back to 2003 there’s been 15 rolling 5-year periods with annualized dividend growth spanning 3.0% to 12.4% with an average of 7.7% and a median of 8.3%.
There’s also been 10 rolling 10-year periods over that time with WD-40’s annualized dividend growth rate ranging from 4.5% to 10.4% with an average of 7.7% and a median of 7.5%.
The rolling 1-, 3-, 5-, and 10-year annualized dividend growth rates from WD-40 since 2003 can be found in the following table.
| Year | Annual Dividend | 1 Year | 3 Year | 5 Year | 10 Year |
| 2003 | $0.800 | ||||
| 2004 | $0.800 | 0.00% | |||
| 2005 | $0.860 | 7.50% | |||
| 2006 | $0.880 | 2.33% | 3.23% | ||
| 2007 | $1.000 | 13.64% | 7.72% | ||
| 2008 | $1.000 | 0.00% | 5.16% | 4.56% | |
| 2009 | $1.000 | 0.00% | 4.35% | 4.56% | |
| 2010 | $1.020 | 2.00% | 0.66% | 3.47% | |
| 2011 | $1.080 | 5.88% | 2.60% | 4.18% | |
| 2012 | $1.160 | 7.41% | 5.07% | 3.01% | |
| 2013 | $1.240 | 6.90% | 6.73% | 4.40% | 4.48% |
| 2014 | $1.360 | 9.68% | 7.99% | 6.34% | 5.45% |
| 2015 | $1.520 | 11.76% | 9.43% | 8.31% | 5.86% |
| 2016 | $1.680 | 10.53% | 10.65% | 9.24% | 6.68% |
| 2017 | $1.960 | 16.67% | 12.96% | 11.06% | 6.96% |
| 2018 | $2.160 | 10.20% | 12.43% | 11.74% | 8.01% |
| 2019 | $2.440 | 12.96% | 13.25% | 12.40% | 9.33% |
| 2020 | $2.680 | 9.84% | 10.99% | 12.01% | 10.14% |
| 2021 | $2.830 | 5.60% | 9.42% | 10.99% | 10.11% |
| 2022 | $3.120 | 10.25% | 8.54% | 9.74% | 10.40% |
Source: Author; Data Source: WD-40 Investor Relations
When looking at dividend growth investments, the payout ratio is an important metric to track. The payout ratio examines the dividend payments versus either net income or free cash flow and lets you know how safe the dividend is due to potential, hopefully temporary, interruptions in the underlying business.
WDFC Dividend Payout Ratios (WDFC SEC filings)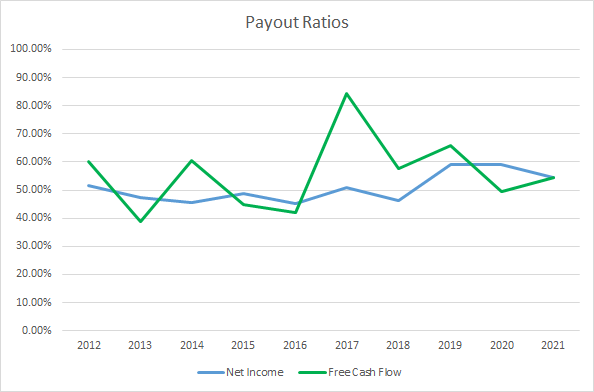
WD-40’s payout ratio has consistently been around 50% when looking at both profits or free cash flow. The 10-year average net income payout ratio is 50.8% with the 5-year average at 53.9%. Accordingly the average free cash flow payout ratios are 55.8% and 62.3%.
Quantitative Quality
My aim is to invest in what I believe are quality businesses that have, and will likely continue, to stand the test of time and of course competitors. As such I track several business metrics over time to see how a business has performed.
WDFC Revenue Profits and Cash Flow (WDFC SEC filings)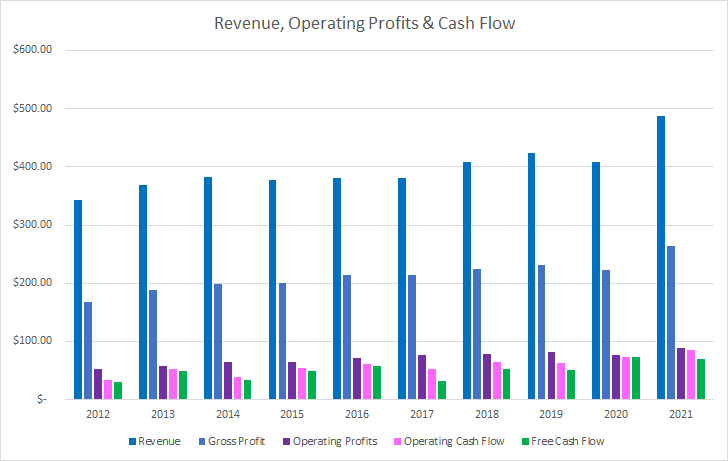
WD-40 has shown steady, albeit slow, growth in revenues over the last decade. Over that time sales have risen 42.3% or 4.0% annualized. Gross profits outpaced revenue growth increasing 57.1% over that time or 5.2% annualized.
Operating profits grew by 71.2% or 6.2% annualized with operating cash flow rising 150.0% or 10.7% annualized. Free cash flow increased an impressive 133.3% in total over that time or ~9.9% annualized.
My expectation is to see stable or improving margins as a sign of a good business. I’m not overly concerned about year to year fluctuations, rather it’s the trend over time that I track. I prefer free cash flow margins to be greater than 10%.
WDFC Margins (WDFC SEC filings)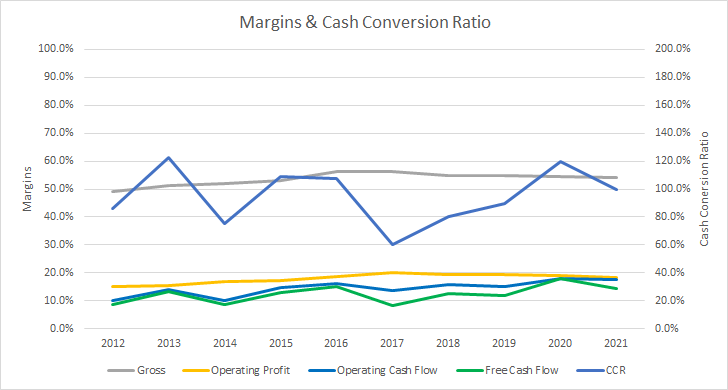
WD-40’s free cash flow margin has shown steady improvement during the last decade. The 10-year average free cash flow margin is 12.4% with the 5-year average coming to 13.0%.
Similarly, I monitor how efficient the business is able to generate free cash flow compared to its assets and capital base. Much like the free cash flow margin I want to see free cash flow ROICs greater than 10% and preferably trending higher over time.
WDFC Free Cash Flow Returns (WDFC SEC filings)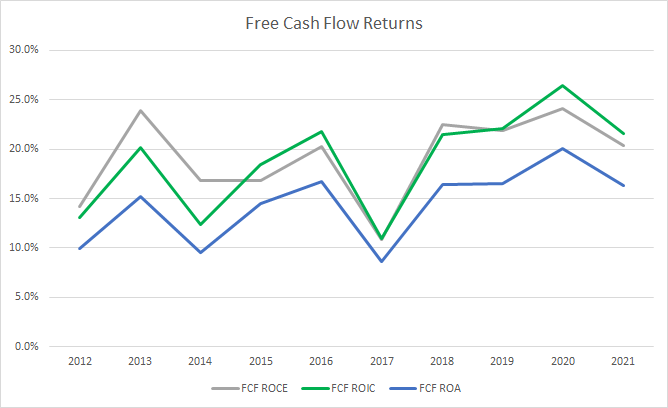
WD-40 has easily surpassed the 10% threshold for FCF ROIC beating it each year over the last decade. The 10-year average FCF ROIC is 18.8% with the 5-year average at 20.5%. Even with the more strict FCF ROA WD-40 has been very efficient with its asset base surpassing 10% in all but two years with averages of 14.4% and 15.6%, respectively.
To understand how WD-40 uses its free cash flow, I calculate three variations of the metric, defined below:
- Free Cash Flow, FCF: Operating cash flow less capital expenditures
- Free Cash Flow after Dividend, FCFaD: FCF less total cash dividend payments
- Free Cash Flow after Dividend and Buybacks, FCFaDB: FCFaD less net cash used in share repurchase activity
WDFC Free Cash Flows (WDFC SEC Filings)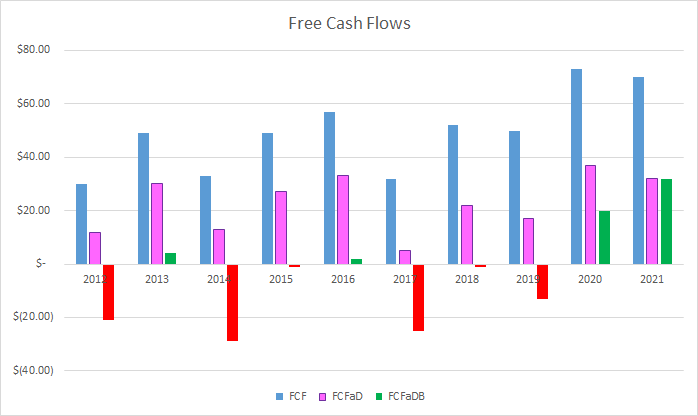
WD-40 has been able to generate $495 M in cumulative FCF over the last decade while paying out $267 M in total dividends to shareholders. That puts the cumulative FCFaD for the last decade at $228 M. WD-40 has also used a net total of $260 M repurchasing shares over that time which puts the 10-year FCFaDB at -$32 M.
If a business lacks internal re-investment opportunities for their excess cash, then I want to see them return it to shareholders via special dividends or by repurchasing shares. Special dividends aren’t too common; however, buybacks are utilized heavily.
WDFC Shares Outstanding (WDFC SEC filings)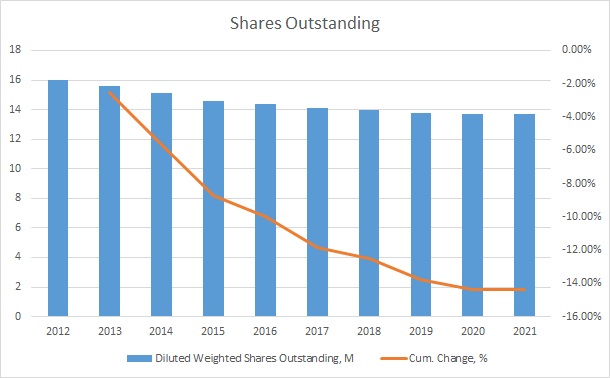
Since the end of FY 2012 WD-40’s share count has fallen by 14.4% thanks to share repurchases. That’s roughly a 1.7% annualized reduction. WD-40 scaled back their share repurchases in FY 2020 and FY 2021 which I honestly like to see since I believe the WD-40’s share price was very expensive over that time.
Additionally I track how the capital structure of the business has changed over time by monitoring the debt-to-capitalization ratio. I want to see stable or improving levels over time with any significant deviations examined closer.
WDFC Debt to Capitalization (WDFC SEC filings)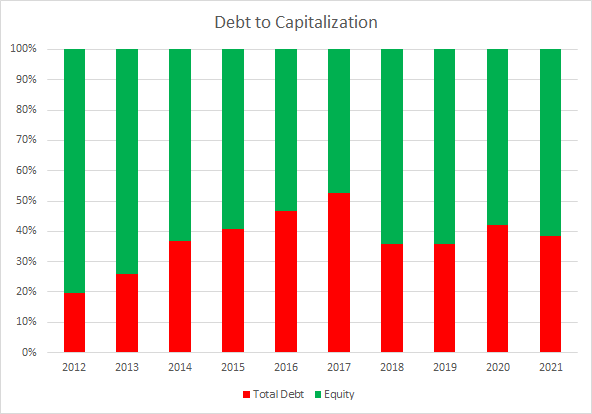
While WD-40’s debt-to-capitalization ratio has worsened, it still appears to be at fairly conservative levels. The 10-year average debt-to-capitalization ratio for WD-40 is 37% with the 5-year average coming to 41%.
The debt ratios take more weight in my comfort level with the leverage a company carries. The net debt ratios look at the net debt a company carries compared to some measure of profits or cash flow.
WDFC Debt Ratios and Interest Coverage (WDFC SEC filings)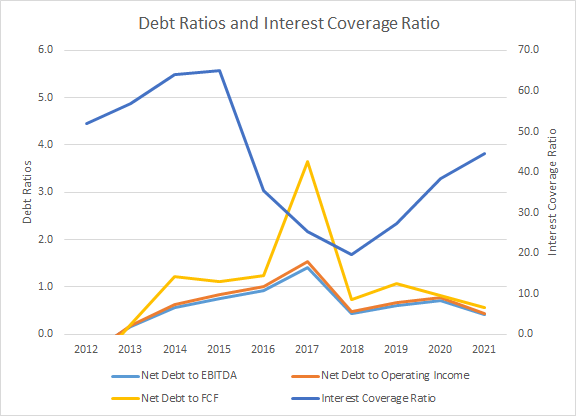
While WD-40’s debt accounts for roughly 40% of the capital structure, compared to the cash flows there’s very little to be concerned with at this time. The 10-year average net debt-to-EBITDA, net debt-to-operating income and net debt-to-FCF ratios are 0.7x, 0.7x, and 1.2x. Similarly the 5-year averages are 0.7x, 0.8x, and 1.4x, respectively.
Valuation
When trying to determine a fair price to pay for a business, I employ multiple valuation methods to try and home in on an attractive level. The valuation methods that I utilize are the minimum acceptable rate of return, MARR, analysis, dividend yield theory, and a reverse discounted cash flow.
Analysts expect WD-40 to show $5.18 in FY 2022 EPS and $6.00 for FY 2023 EPS. They also expect WD-40 to have $6.00 in EPS for FY 2023 and expect them to grow EPS at a 10.0% annual rate over the next 5 years. I then assumed that WD-40 would be able to grow EPS 5.0% annually for the following 5 years. Dividends are assumed to target a 60% payout ratio.
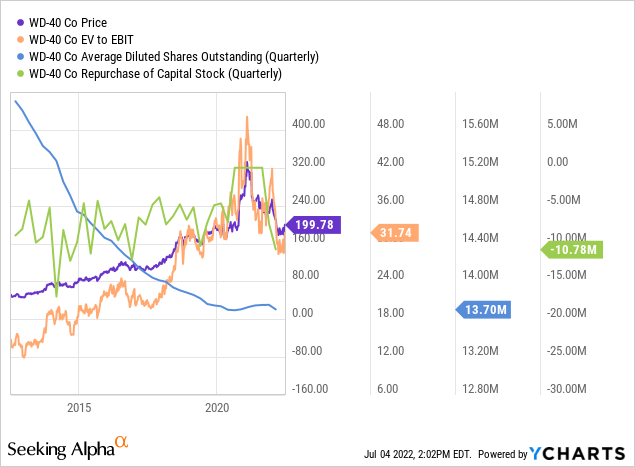
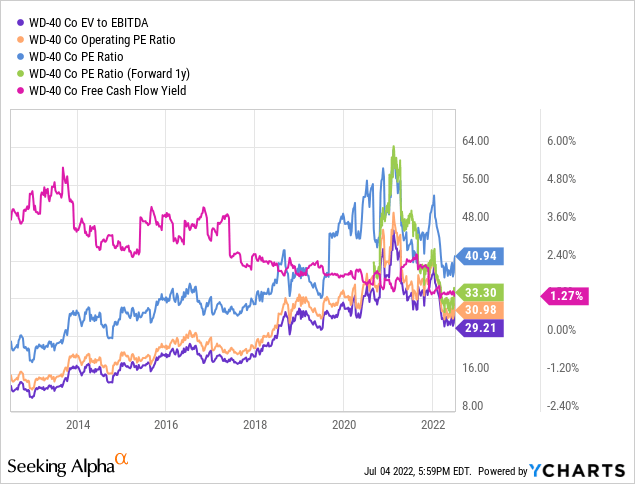
As we can see in the following chart, during the last decade WD-40 has typically been valued between ~15x and ~35x TTM EPS. I’ll examine exit multiples spanning that range for the MARR analysis.
The following table shows the potential internal rates of return that an investment in WD-40 could produce if the assumptions laid out above prove to be realistic forecasts for the future. Dividends are assumed to be taken in cash as well as paid and increased along the timeline that WD-40 has usually followed. Returns assume that shares are purchased at $199.78, Friday’s closing price.
| IRR | ||
| P/E Level | 5 Year | 10 Year |
| 35 | 9.2% | 7.3% |
| 30 | 5.6% | 5.8% |
| 25 | 1.6% | 3.9% |
| 20 | -3.1% | 1.7% |
| 15 | -8.8% | -1.0% |
Source: Author
Additionally I use the MARR analysis structure to work backwards to determine what purchase price targets based on the growth assumptions specified above. My base hurdle rate is a 10% IRR and I’ll also examine 8% and 12% return thresholds.
| Purchase Price Targets | ||||||
| 10% Return Target | 12% Return Target | 8% Return Target | ||||
| P/E Level | 5 Year | 10 Year | 5 Year | 10 Year | 5 Year | 10 Year |
| 35 | $194 | $162 | $180 | $139 | $210 | $190 |
| 30 | $169 | $143 | $156 | $123 | $182 | $167 |
| 25 | $143 | $123 | $132 | $106 | $154 | $144 |
| 20 | $117 | $104 | $108 | $90 | $126 | $121 |
| 15 | $91 | $84 | $85 | $73 | $98 | $97 |
Source: Author
Dividend yield theory is a valuation method that is built on the idea that a business will be valued around a “normal” dividend yield by market participants assuming there’s been no material changes to the underlying business. For WD-40 I’ll use the 3-year average forward dividend yield as a proxy for fair value.
WD-40 Dividend Yield Theory (WD-40 Investor Relations and Google Finance)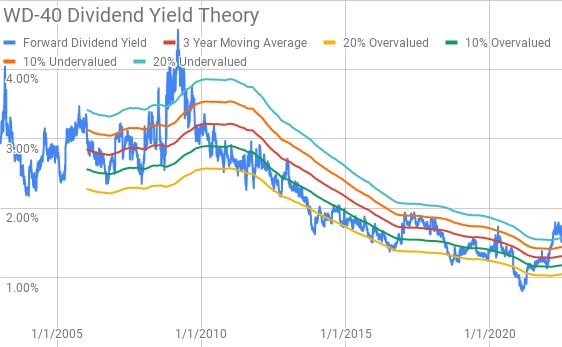
WD-40 currently offers a forward dividend yield of 1.56% compared to the 3-year average forward dividend yield of 1.31%.
A reverse discounted cash flow analysis can be used to decipher what the current market valuation means about the future growth and margins that a business will generate. Instead of making explicit forecasts to determine what the business is worth, you work backwards from the price right now to see what cash flows the business must generate to support the market valuation.
With a goal of being roughly right I use a simplified DCF model built on revenue growth, an initial FCF margin of 10% that increases to 13.5% during the forecast period, and a terminal growth rate of 3.0%. Under those assumptions WD-40 needs to grow revenues 17.6% annually through FY 2031 in order to generate the necessary free cash flows to support a 10% return. Reducing the discount rate to 8% lowers the required revenue growth to 11.7% annually through FY 2031.
Conclusion
WD-40 is a business that I’d like to own for a lot of reasons. For one there’s probably at least one can of it in every single household in America. Also, it’s a nice boring business that routinely carries strong margins and ROIC’s. That’s a winning combination over time.
Dividend yield theory suggests that WD-40 is attractively valued with a fair value range between $216 and $264. However, the MARR analysis looking at a 5-year time period and an exit multiple between 20x and 25x puts the fair value between $117 and $143 with a 10% return target. Dropping the return target to 8% increases the fair value range to $126 to $154.
The reverse DCF model also seems to show that WD-40 is quite expensive at current levels. For both the 10% and 8% return targets WD-40 needs to grow at a very rapid pace or significantly increase their margins in order to generate the cash flows that would support the current market valuation.
WD-40 has some very ambitious growth targets with an aim to increase sales to between $650 – $700 M by FY 2025. That’s a 33% – 43% increase from FY 2021’s revenues.
WDFC Revenue Growth Aspirations (FY 2022 Q2 Earnings Presentation)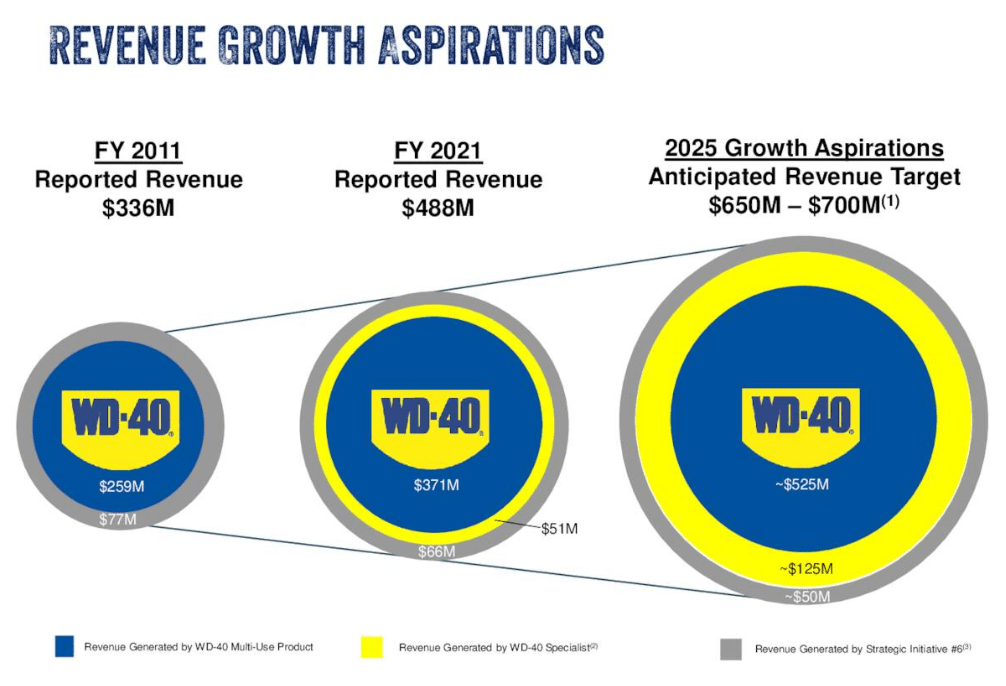
Unfortunately, even if they hit the high end of that target, WD-40 would still need sustained, rapid revenue growth or a large improvement in margins for the DCF analysis to make sense with even an 8% discount rate.
While I like WD-40 the business, the market valuation currently appears disconnected from what the business reality will likely be. As such, the risk/reward ratio remains heavily skewed towards risk despite the ~40% drawdown from the high reached in 2021.
Be the first to comment