

AsiaVision
The shares of StoneCo (NASDAQ:STNE) have lost about 90% of their value in the last year and a half. But the major misfortunes that bulls have had to endure over that timeframe may soon come to an end. Solid operating cash flow, robust profitability gauges (if you know where to look and distinguish between strong fundamentals and circumstantial headwinds), favorable valuation and risk/reward, combine to make this market disruptor and fintech leader a solid prospective investment.
StoneCo Has Disrupted the Financial Industry in Brazil
StoneCo’s business model is disruptive and has enabled the firm to gain significant traction in just under a decade. Per the company’s 10k, it has become the largest independent merchant acquirer and the fourth largest based on volume in Brazil. In 2017, It became the first non-bank entity to obtain authorization from the Central Bank to operate as a Merchant Acquirer Payments Institution.
The group has over 1.7 million active payments clients in Brazil as of December 31, 2021, including digital and brick-and-mortar merchants. It primarily targets the 13.5 million Brazilian Micro, Small and Medium Businesses (MSMBs), which have been historically underserved by legacy banks.
In 2019, it broadened its set of solutions to merchants to include both financial services and software solutions. Financial services include digital banking solutions, working capital loans and insurance, and payments. Software includes companies (like Linx, the leading retail software management company in Brazil, acquired in 2021) that offer POS/ERP solutions, CRM solutions, accounting services, etc.
Remuneration for the services provided encompasses (i) payment processing fees related to transaction activities, (ii) financial income related to prepayment financing and interest/fees related to credit solutions and (iii) subscription and equipment rental fees, which includes recurring subscription revenues from software. Per the 10k, these accounted for 33.7%, 38.9% and 22.2%, respectively, of revenues in 2021.
New Momentum Is Building: StoneCo’s Relative Strength Is Improving
As the following daily stock chart illustrates, the shares of StoneCo have lost two-third of their value since going public in October 2018 and a whopping 90% since reaching an all-time high of $95.12 on February 15, 2021.
E*Trade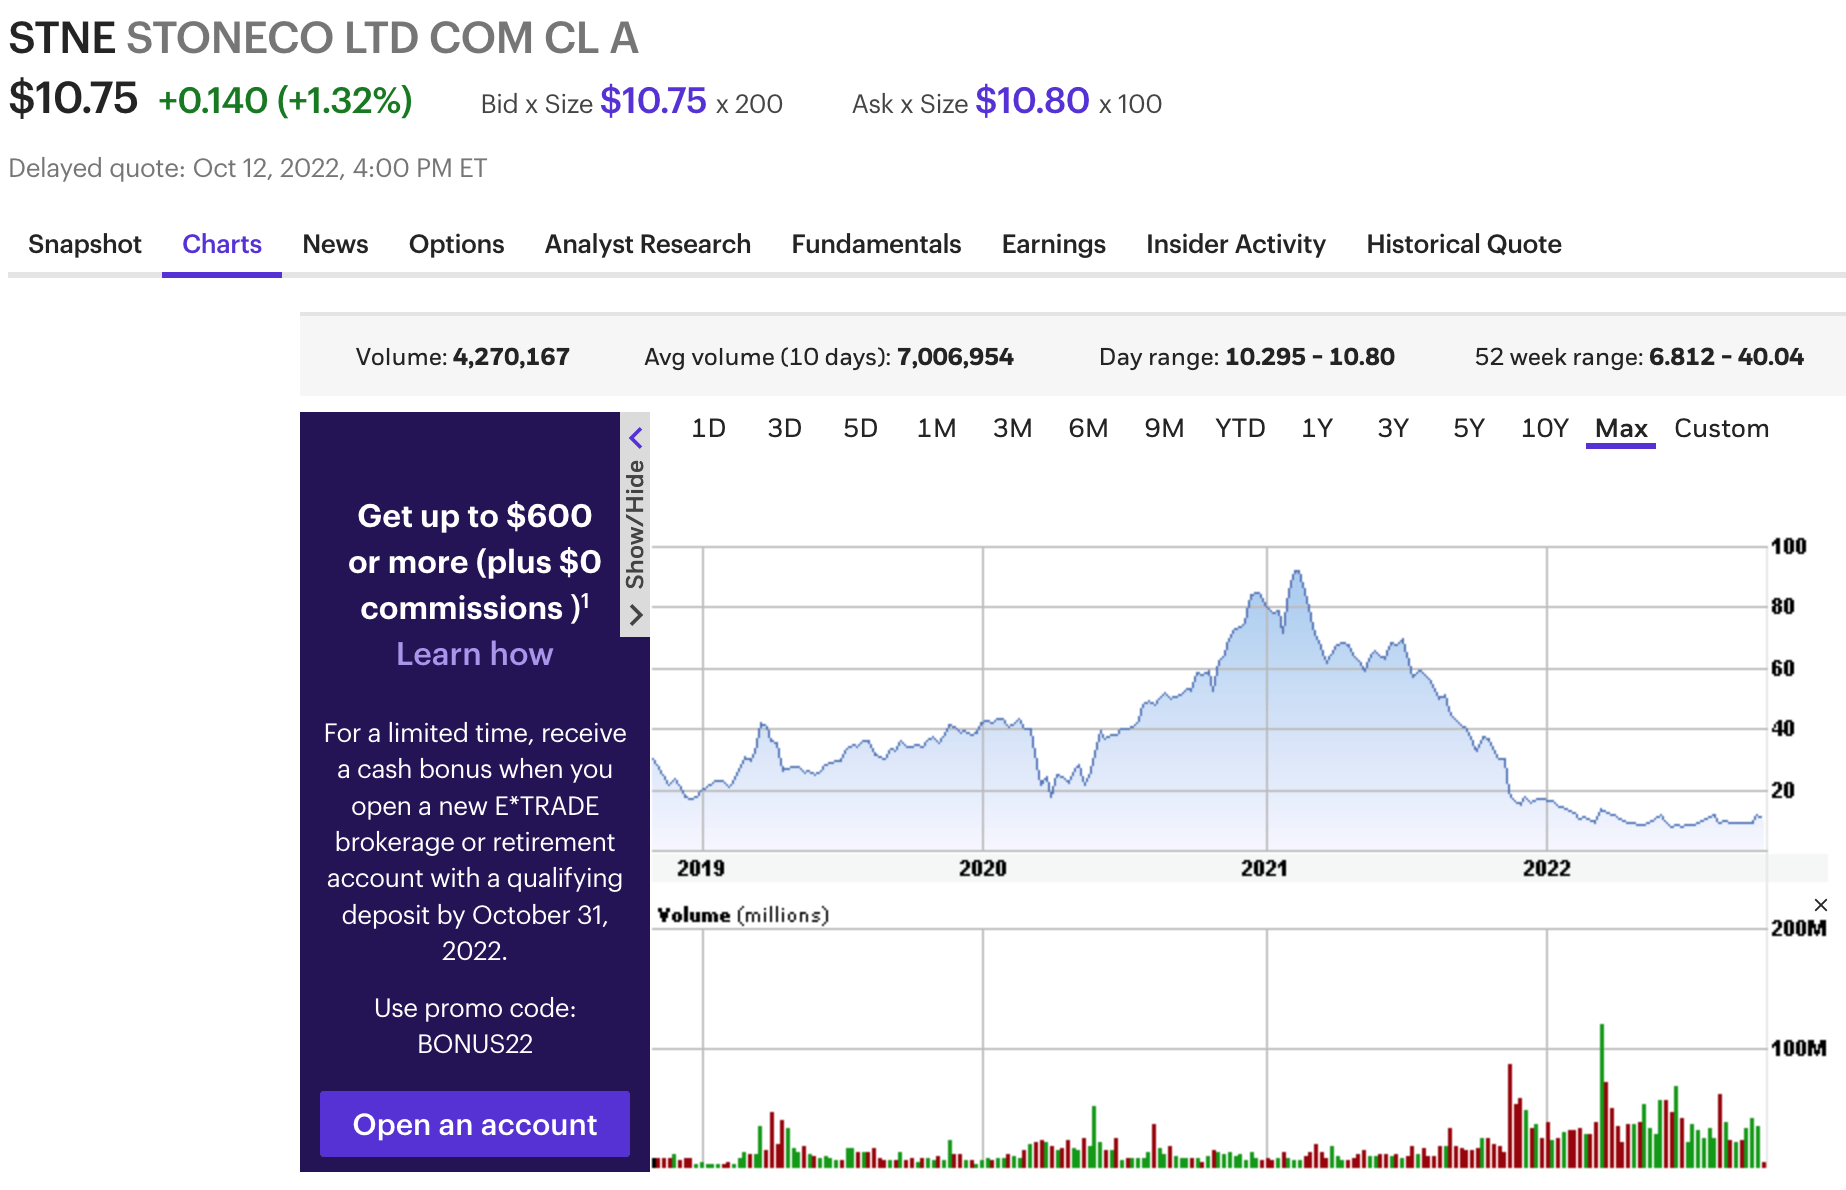
But please check out this second (weekly) stock chart for a snapshot of StoneCo’s recent technical trends:
Investor’s Business Daily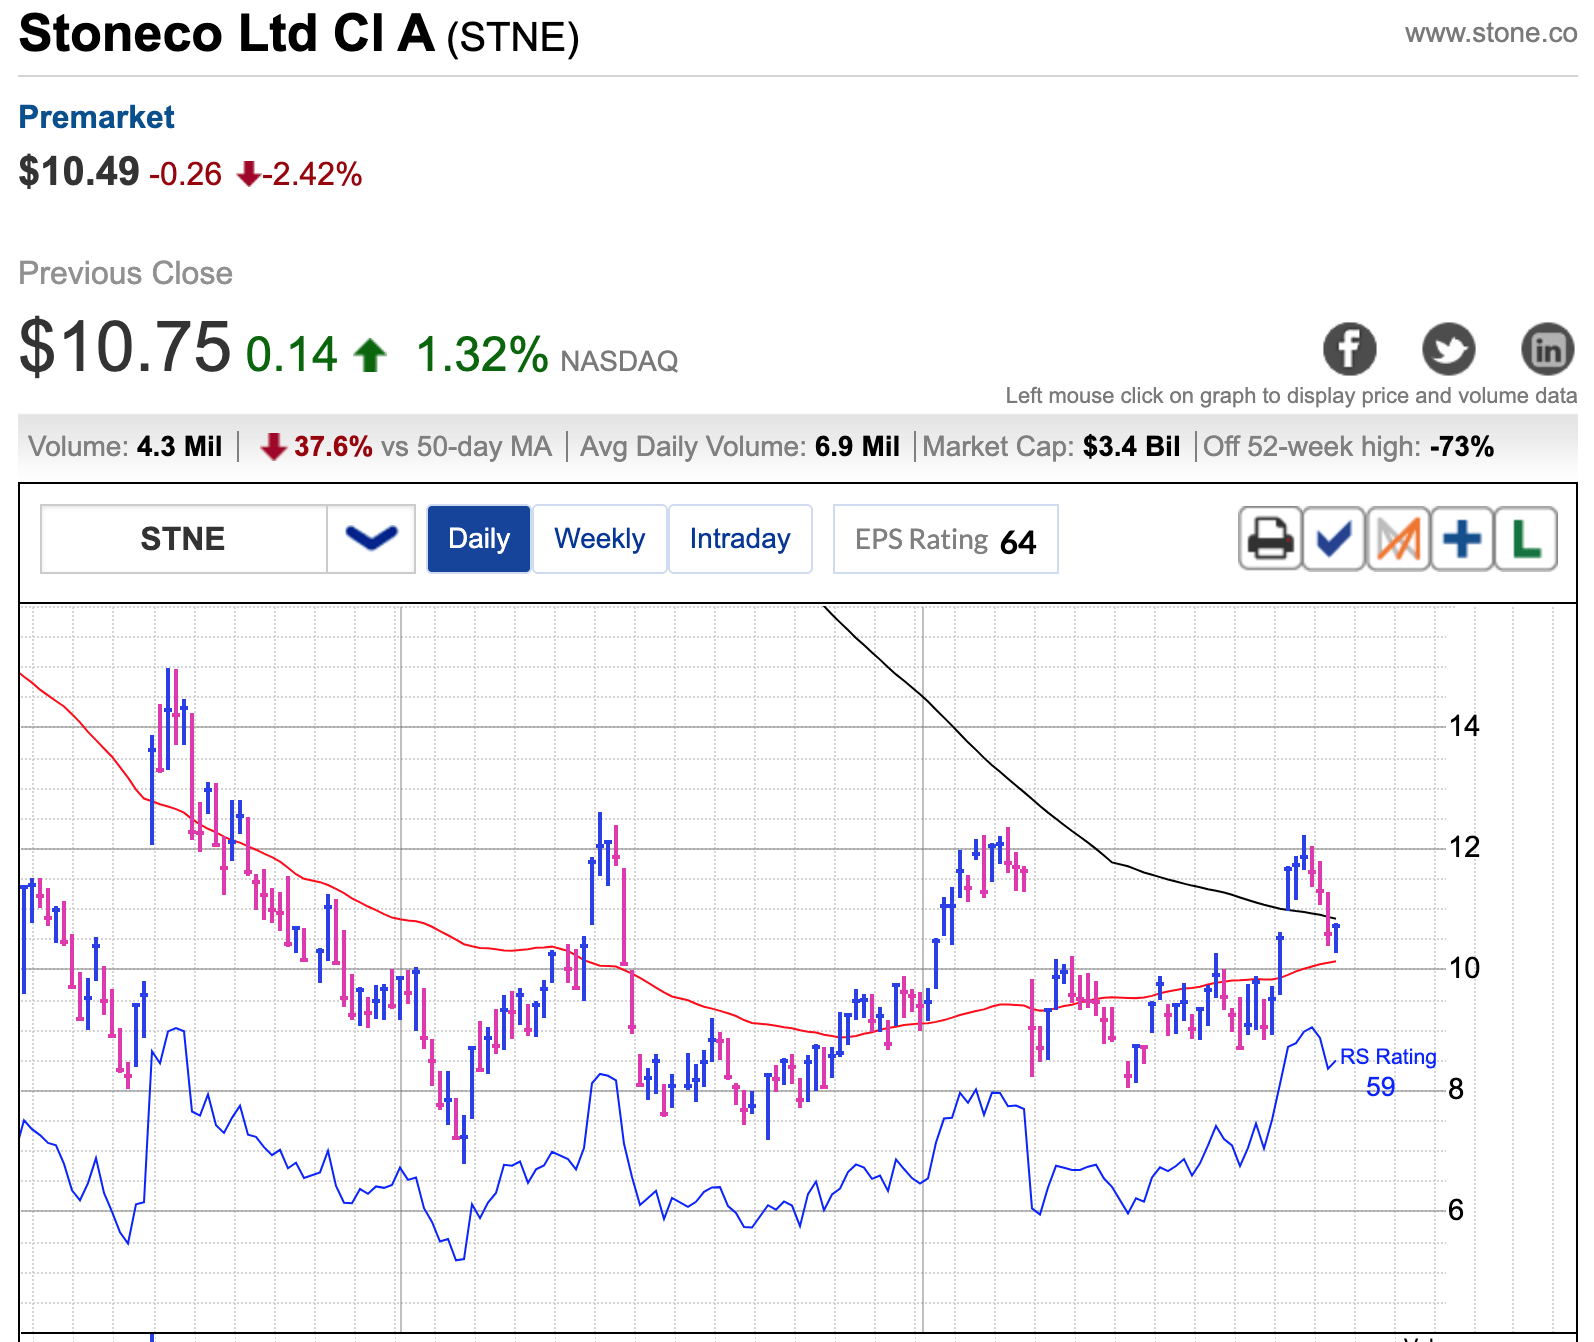
The stock seems to be bottoming. It managed to power up through both the SMA (50) and SMA (200) 10 days ago and is now retreating in lower volume. A move made that much more impressive because the overall stock market remains challenging, to say the least.
The regained positive momentum (rated A+) shows in the following tables, as well:
Seeking Alpha – Momentum
The stock still shows a poor 1-year price performance, but the 9-month and specially 6-month and 3-month performances delineate a clear pattern of outperformance, also apparent in the graph charting StoneCo’s Price Return vs S&P 500, as follows:
Seeking Alpha
Put another way, the stock is going through a clear case of trend reversal. The question is, is this sustainable? Can the shares keep their upward momentum? We believe that indeed, StoneCo’s business is turning around and the shares are at the very inception of a new bull.
StoneCo Retains a High-Growth Profile
It’s not just the momentum, of course. Something else is going on. A cursory look at factor grades for the stock seems to indicate that StoneCo rates quite high (a nice A average) on all three key metrics: growth, profitability, and valuation.
Seeking Alpha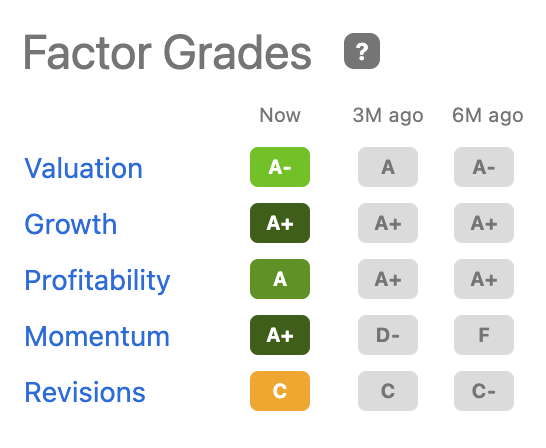
We could have a winner. Let’s dig in.
Start with growth. The Company shows a strong track record of top line growth. Revenue growth, EBITDA growth, and operating cash flow growth, are all straight A’s.
Seeking Alpha – Growth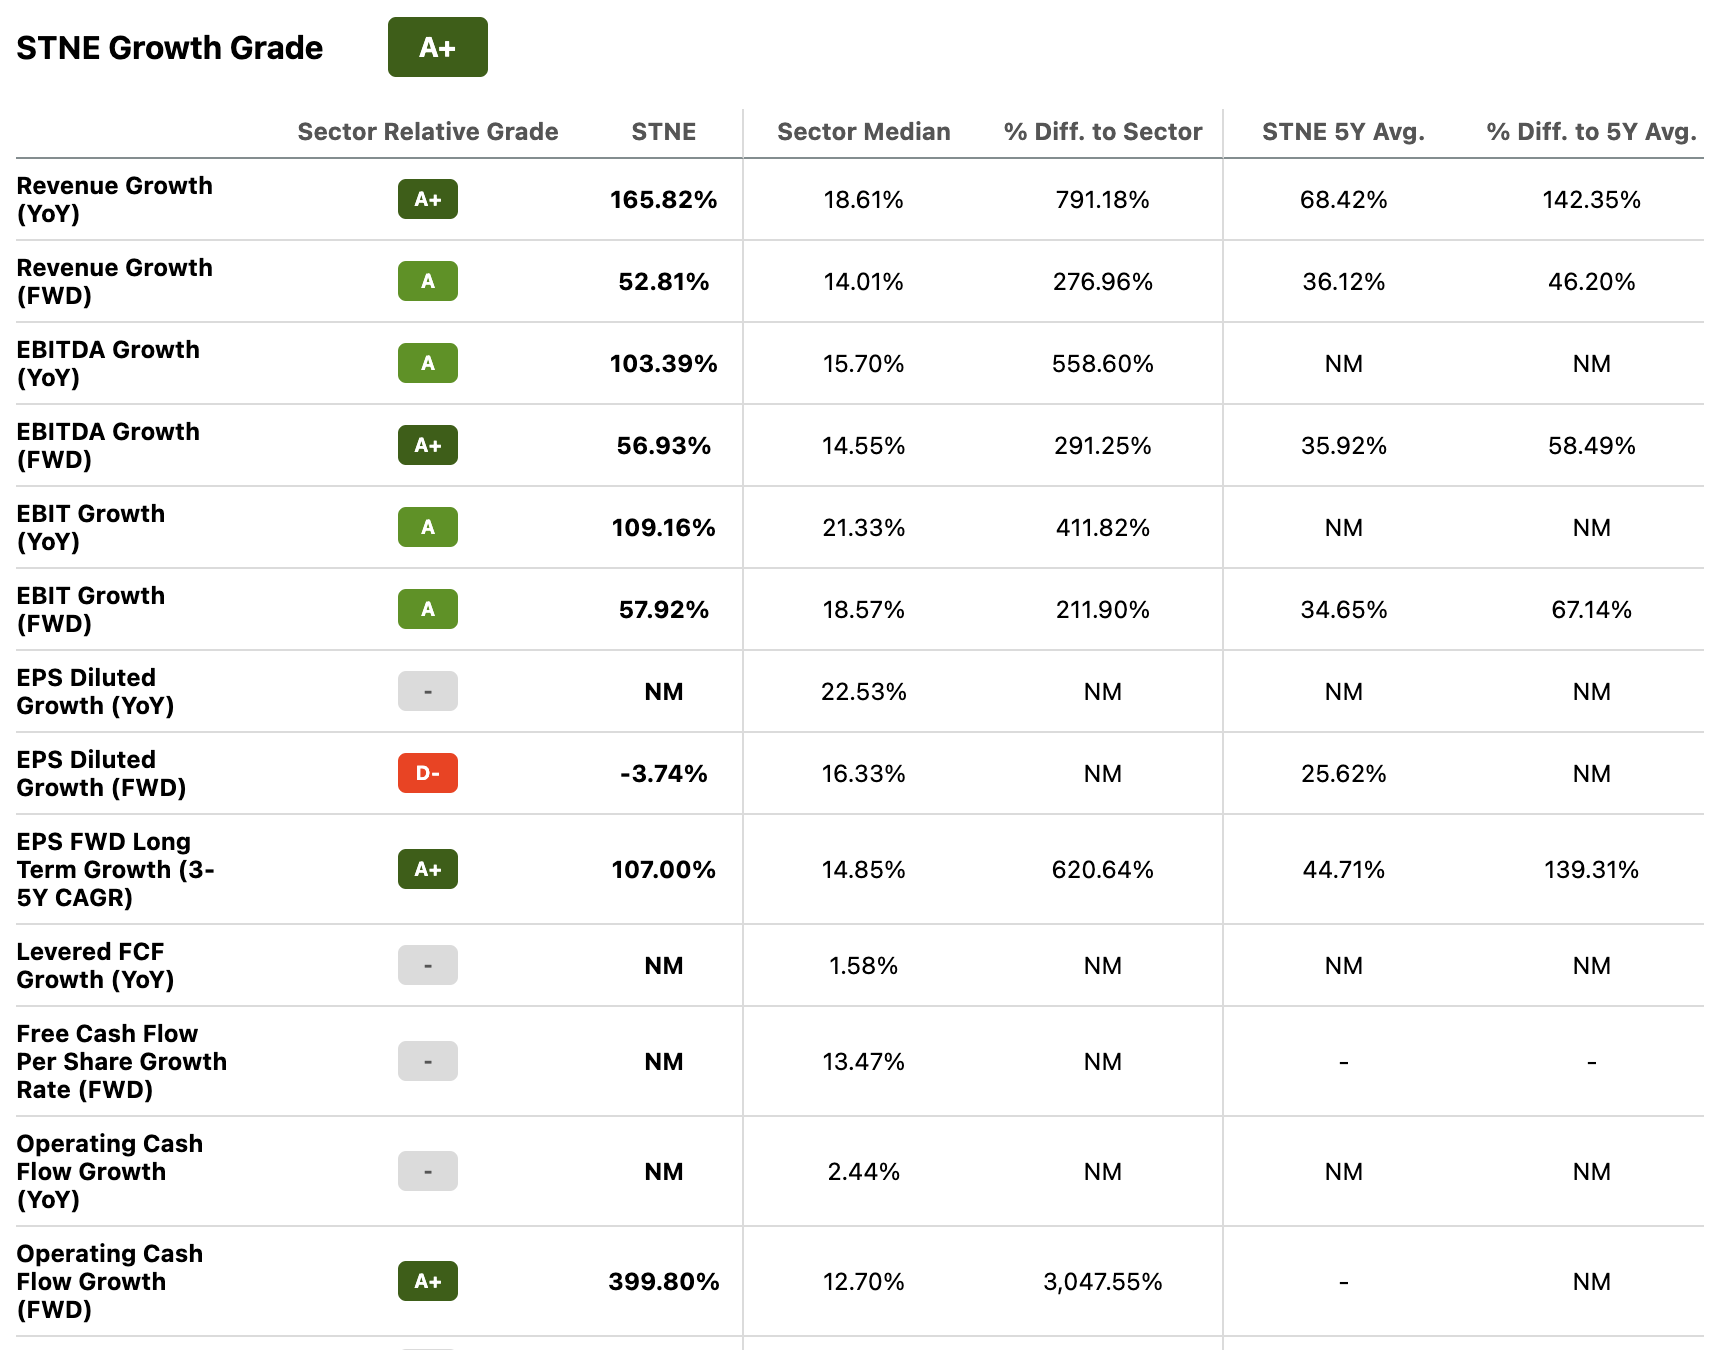
Recent developments confirm this positive outlook. StoneCo reported revenue growth of 275.6% year over year in 2Q22 (82.8% ex-credit and pro-forma for Linx) to R$2.30 billion, 4.7% above the upper end of StoneCo’s guidance.
Our business is performing very well. We are winning new clients faster than last quarter and are producing strong revenue growth while improving profitability.
We achieved a record TPV (Total Payment Volume) of R$90.7 billion during the second quarter and R$173.9 billion year-to-date. Our Total Revenue of R$2.30 billion exceeded our expectations (and the upper end of our guidance) and we were able to increase our take rates in the second quarter over the first quarter of 2022.
Management proceeds to provide more granularity, as follows:
The increase in revenues was mainly a result of (i) 242.5% growth in our financial services platform revenues (101.5% ex-credit), that reached R$1,932.6 million and (ii) 8.2x growth in our software platform revenues (23.3% pro-forma for Linx), that reached R$350.7 million. (…) Financial services revenue growth was mostly a result of our performance in the MSMB segment, with strong TPV growth combined with increasing take rates, as we keep adjusting our pricing policy amid a higher interest rate environment in Brazil. Our year-over-year software revenue growth was driven mostly by the consolidation of Linx and our software Core business revenue growth.
There are several key trends worth factoring in here. First, the company’s numbers are strong. Second, both the financial services (via a mix of TPV growth and take rates increases) and the software platform revenue exhibit high growth. Third, the company is agile and able to adjust pricing policy amid a higher interest rate environment (thus preserving margins).
Check out the top line of the (annual) income statement for a more accurate picture of long-term revenue trends:
Seeking Alpha – Financials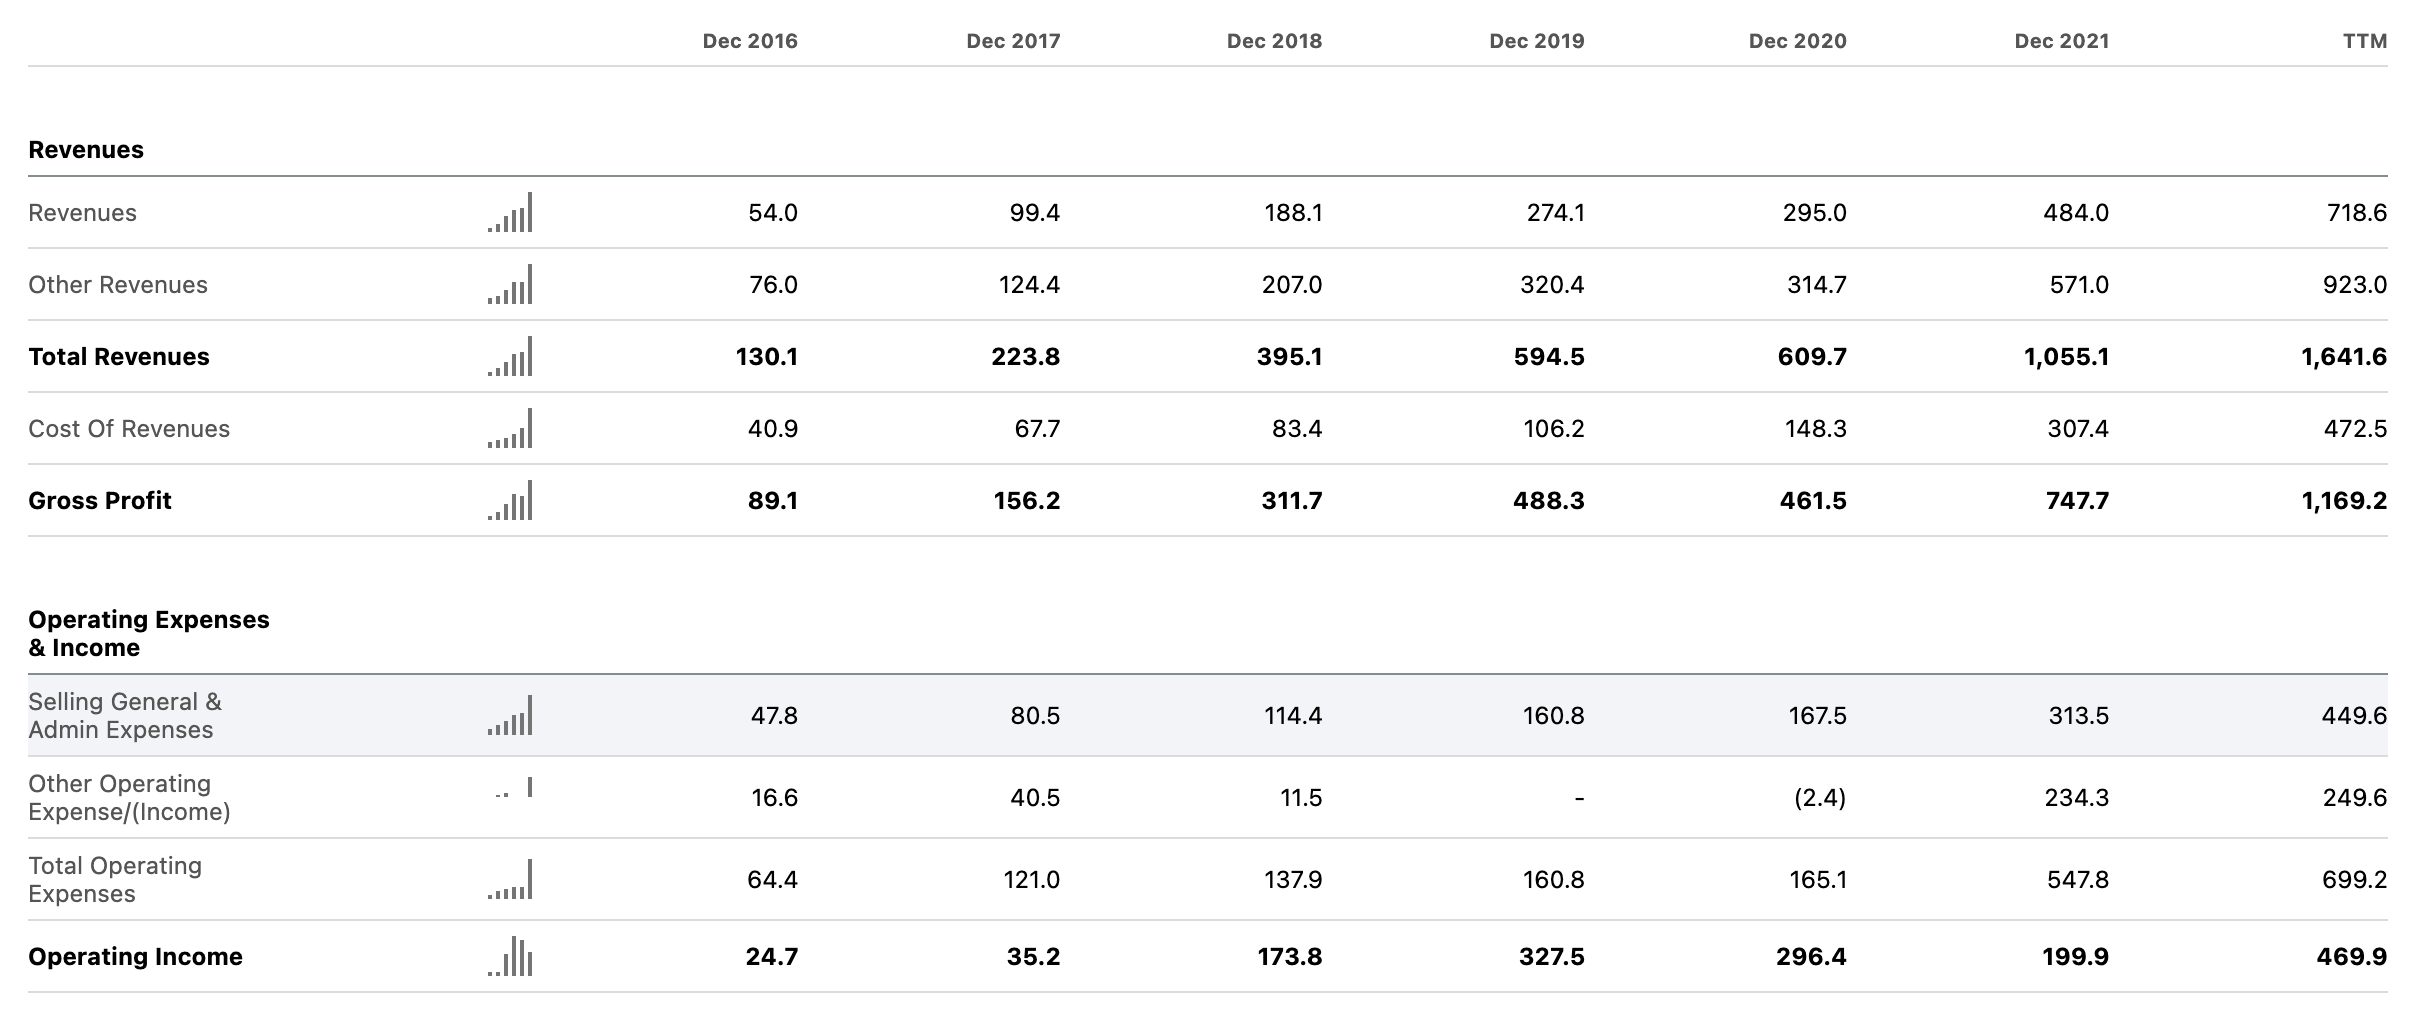
Clearly, StoneCo is growing revenue at a fast clip.
It is also profitable.
StoneCo’s Bottom Line Also Holds Promise
StoneCo’s profitability grade and underlying metrics (see below) reveal a healthy gross profit margin above 70%, a solid EBTDA margin and levered Free Cash Flow margin, and a decent return on capital.
Seeking Alpha – Profitability
The Cash Flow Statement indicates very significant improvement on the cash from operations front over the past 4 years, as follows:
Seeking Alpha – Financials for Stone (STNE)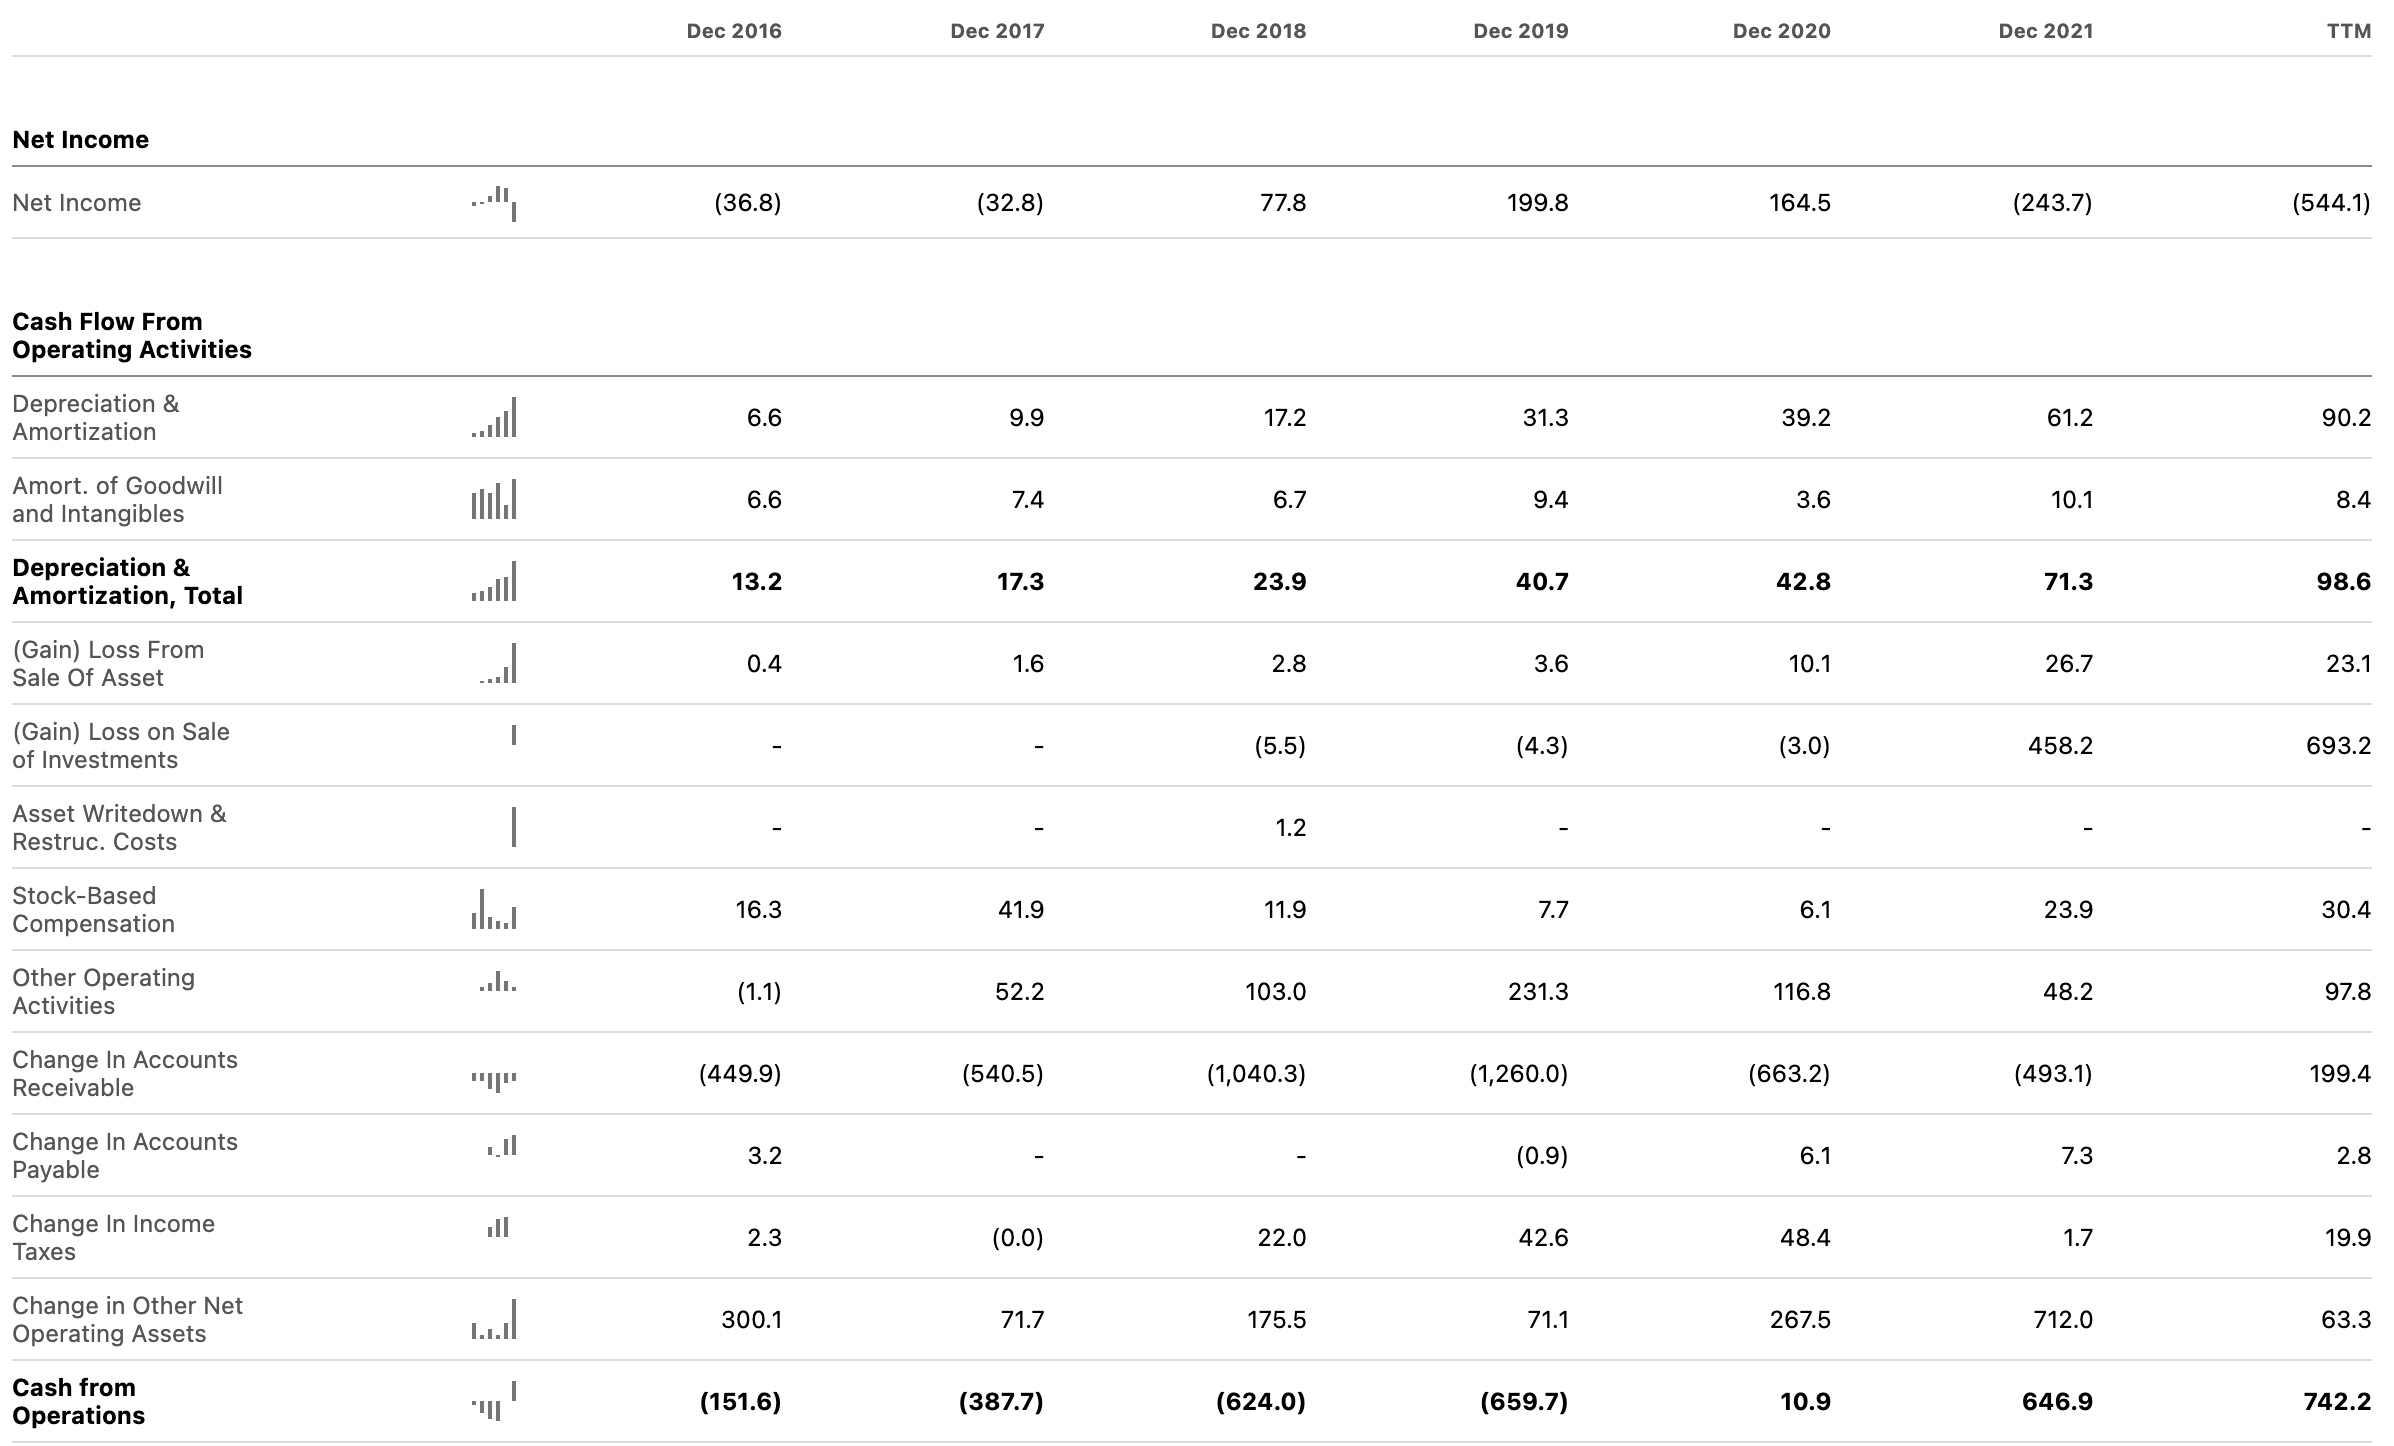
Since 2019, cash from operations has turned from heavy negative to heavy positive.
Recent developments of the bottom line (Q2, ’22) are no exception. To quote Management again:
Our strong performance flowed through to our bottom line. Our margins and profitability continued to improve in the quarter, producing Adjusted EBT of R$107 million, above our R$90+ million guidance.
We are encouraged by the trends we have seen in our business in the first half of the year and believe the outlook for continued growth and margin expansion reflect this view.
We see the second half of the year as an opportunity to build on our first half successes, demonstrate that our recovery is in full swing and position Stone favorably for the longer term.
Adjusted EBITDA in 2Q22 was R$1,057.4 million, up from -R$17.9 million in 2Q21 and 29.4% higher quarter over quarter. EBITDA Margin increased 6.4% sequentially to 45.9%, mainly due to lower marketing expenses and efficiency gains in costs and expenses.
Adjusted Net Income in 2Q22 was R$76.5 million, compared with R$51.7 million in 1Q22 (not adjusting for bond expenses). Adjusted net margin increased from 2.5% in 1Q22 to 3.3% in 2Q22. The successful implementation of new pricing policies and efficiency gains in costs and expenses helped.
As Management puts it:
We continue to actively manage our pricing policy, with focus on balancing growth and profitability in our core MSMB payments operation.
Breaking down the main financial metrics into StoneCo’s two reportable segments (financial services and software) shows both businesses are delivering good results.
Table 2: Financial metrics by segment
StoneCo’s Website – Press Release – Results Reported for Q2 ’22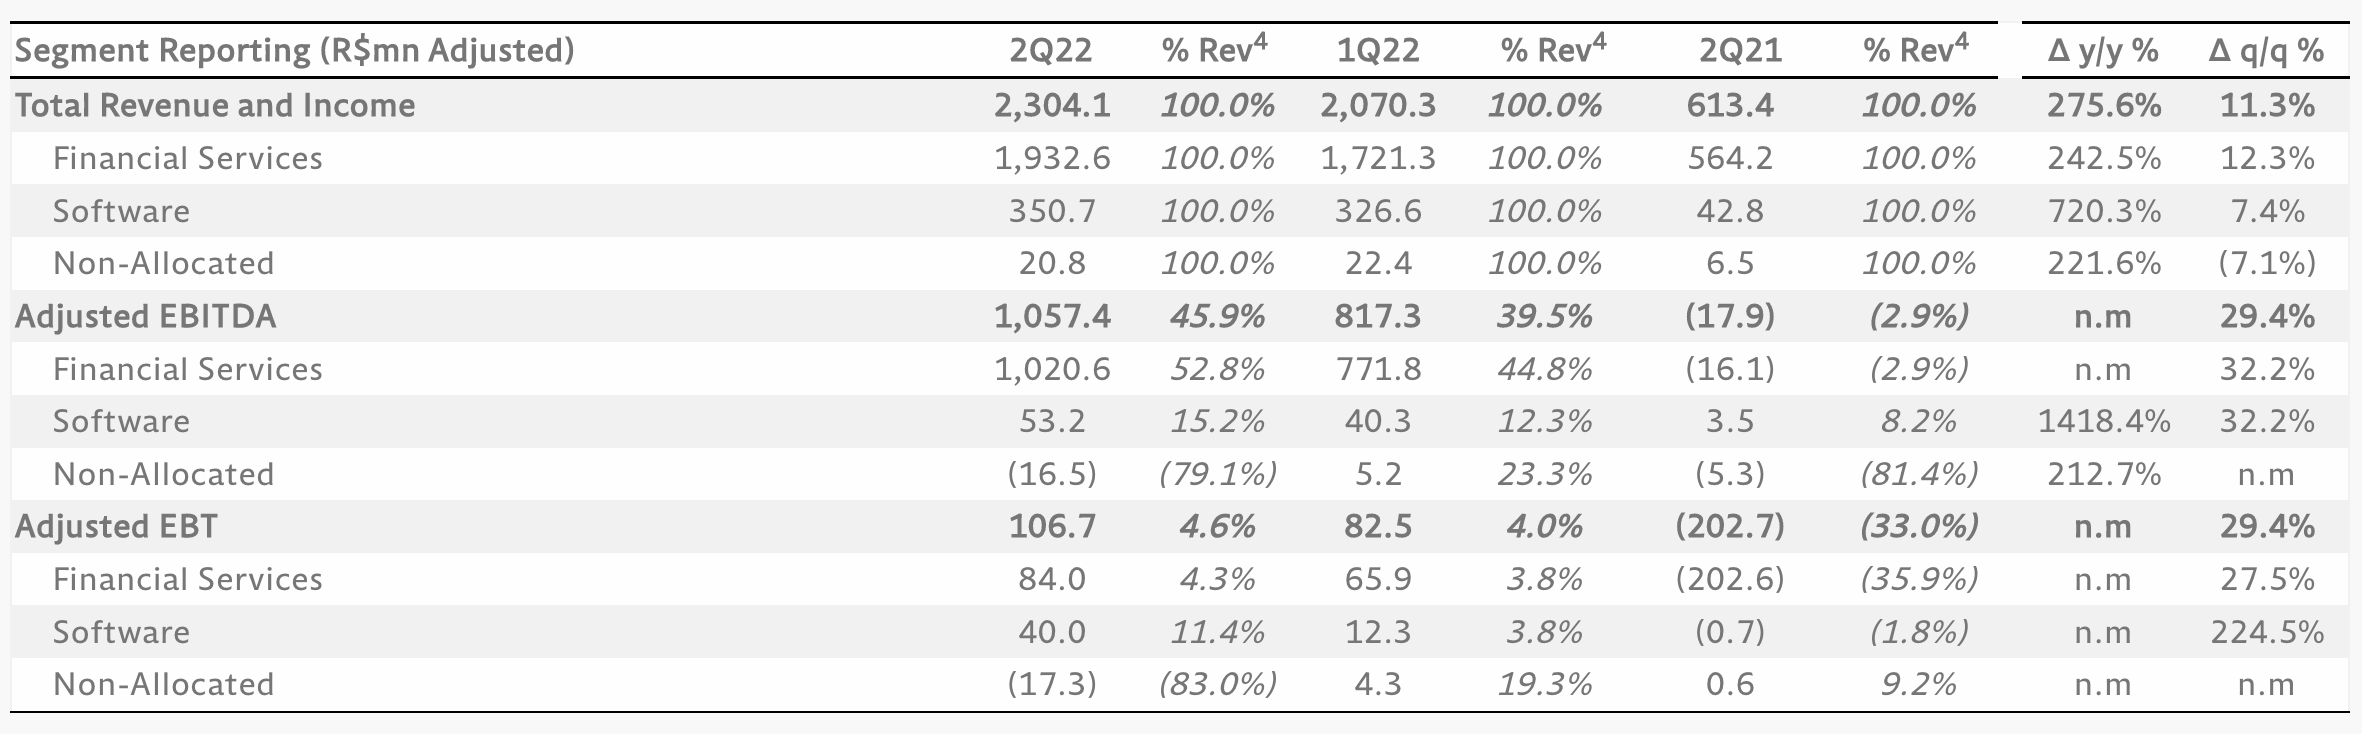
The following Financial Services Main Operating and Financial Metrics also provides perspective and denotes strength.
StoneCo’s Website – Press Release – Results Reported Q2 ’22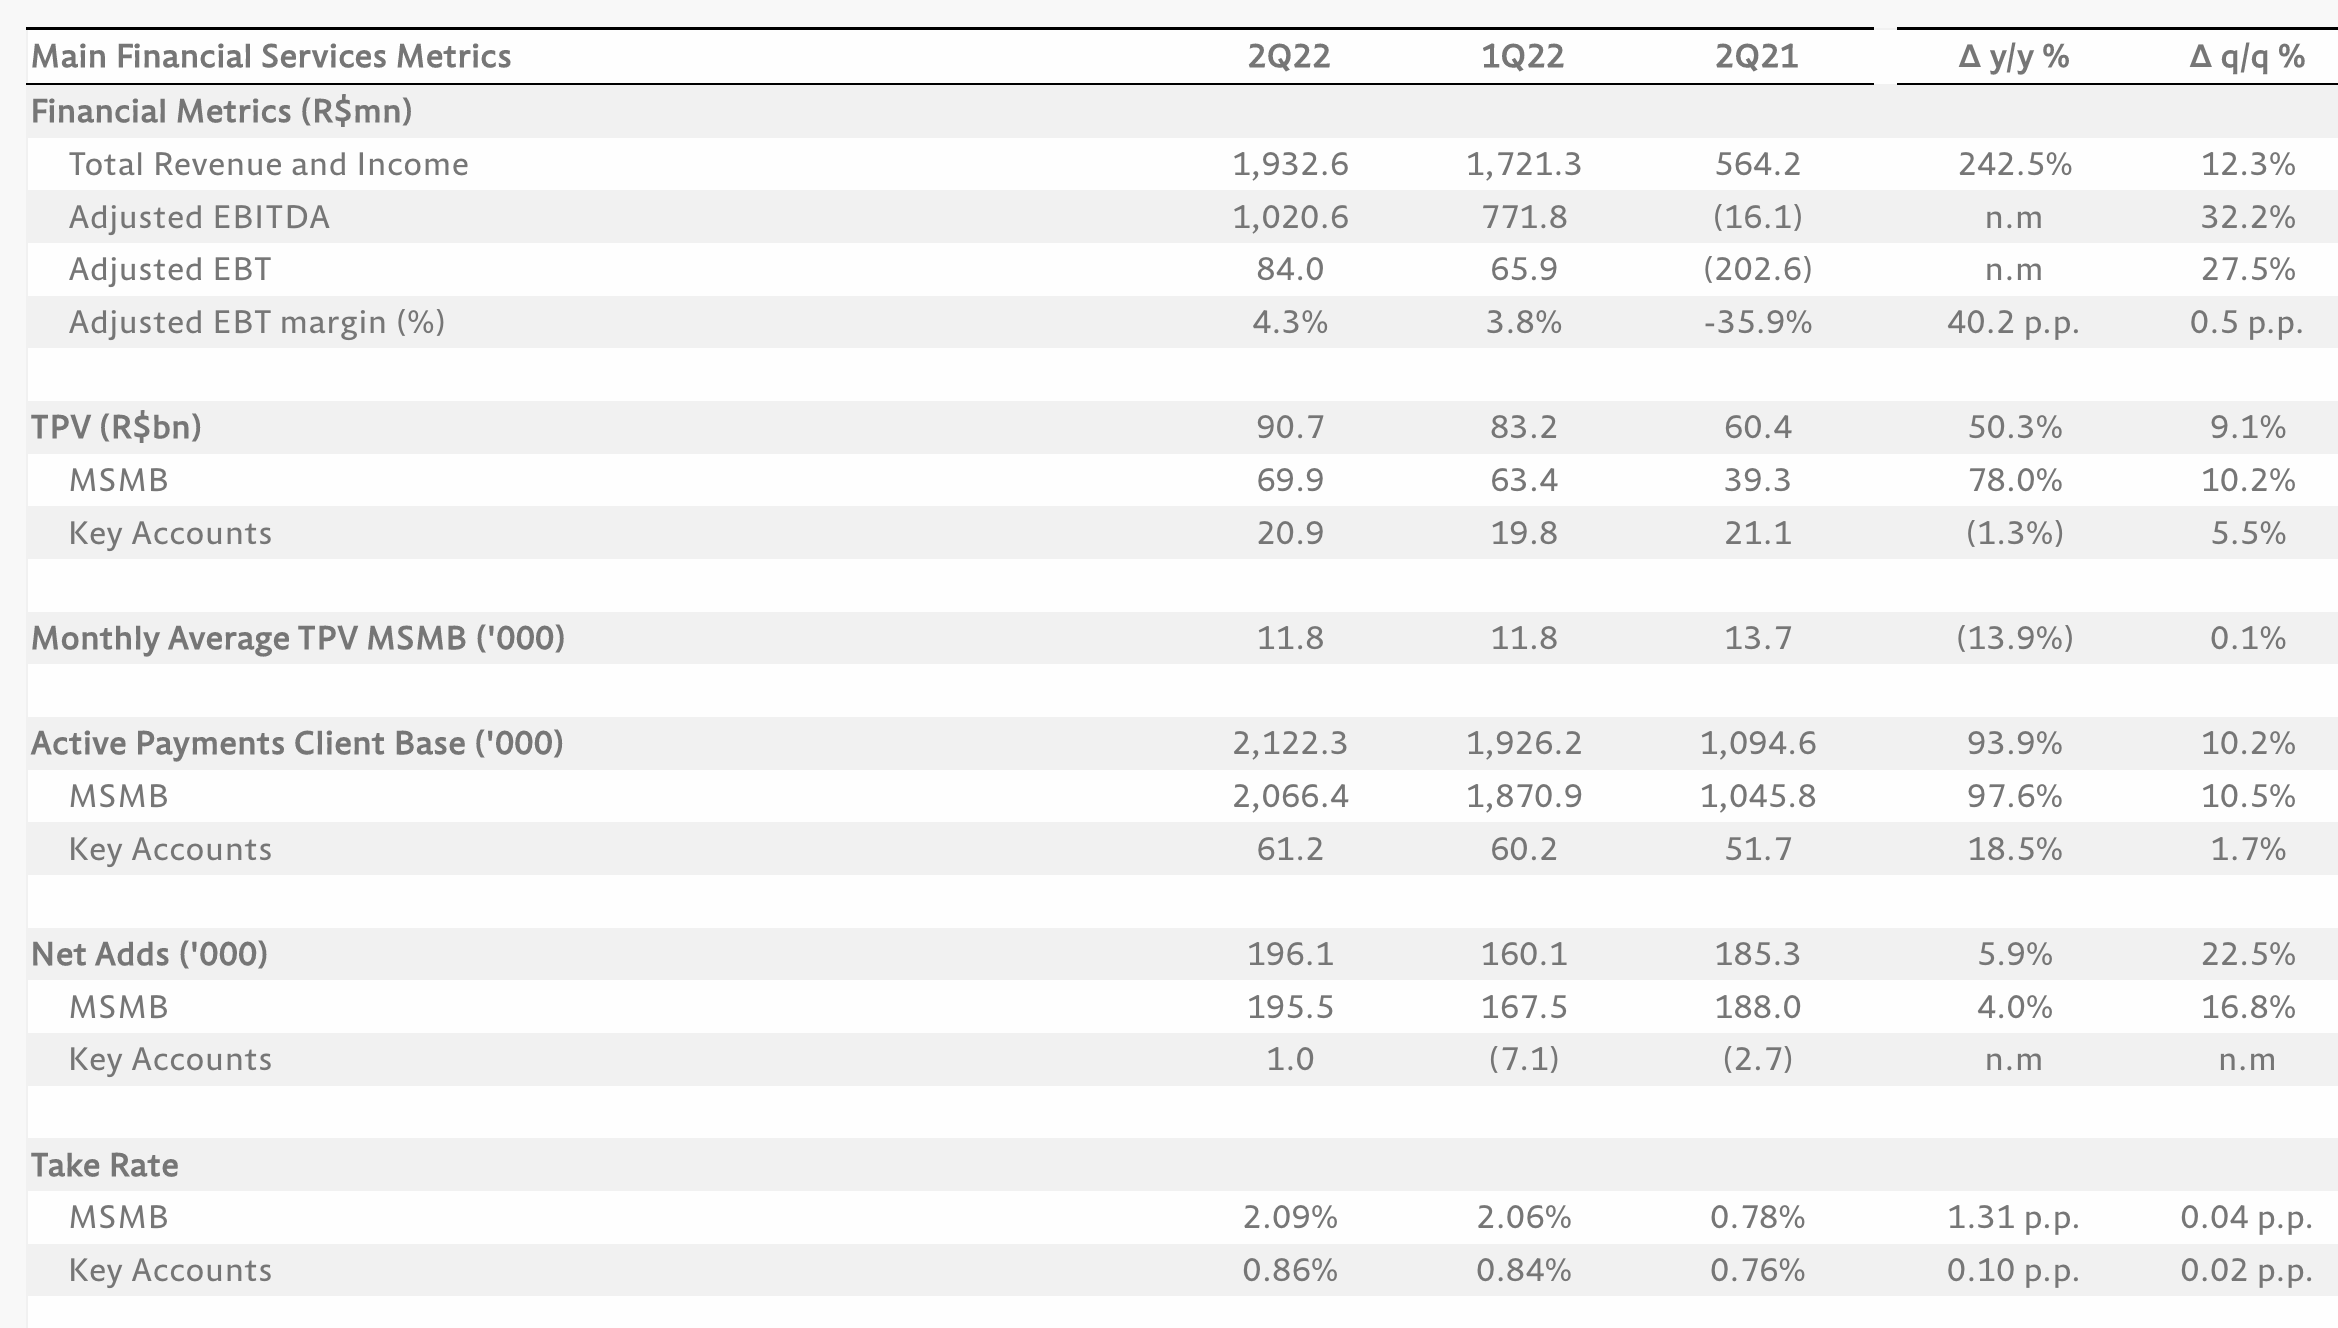
Consolidated TPV shows a 50.3% increase year over year, mainly related to growth in the MSMB segment. Note the strong net adds, both for MSBS and key accounts, as well.
Now for the (very bottom of) the income statement proper, which is where results turn negative. Let’s examine what’s going on.
StoneCo’s Website – Press Release – Q2 ’22 Financial Results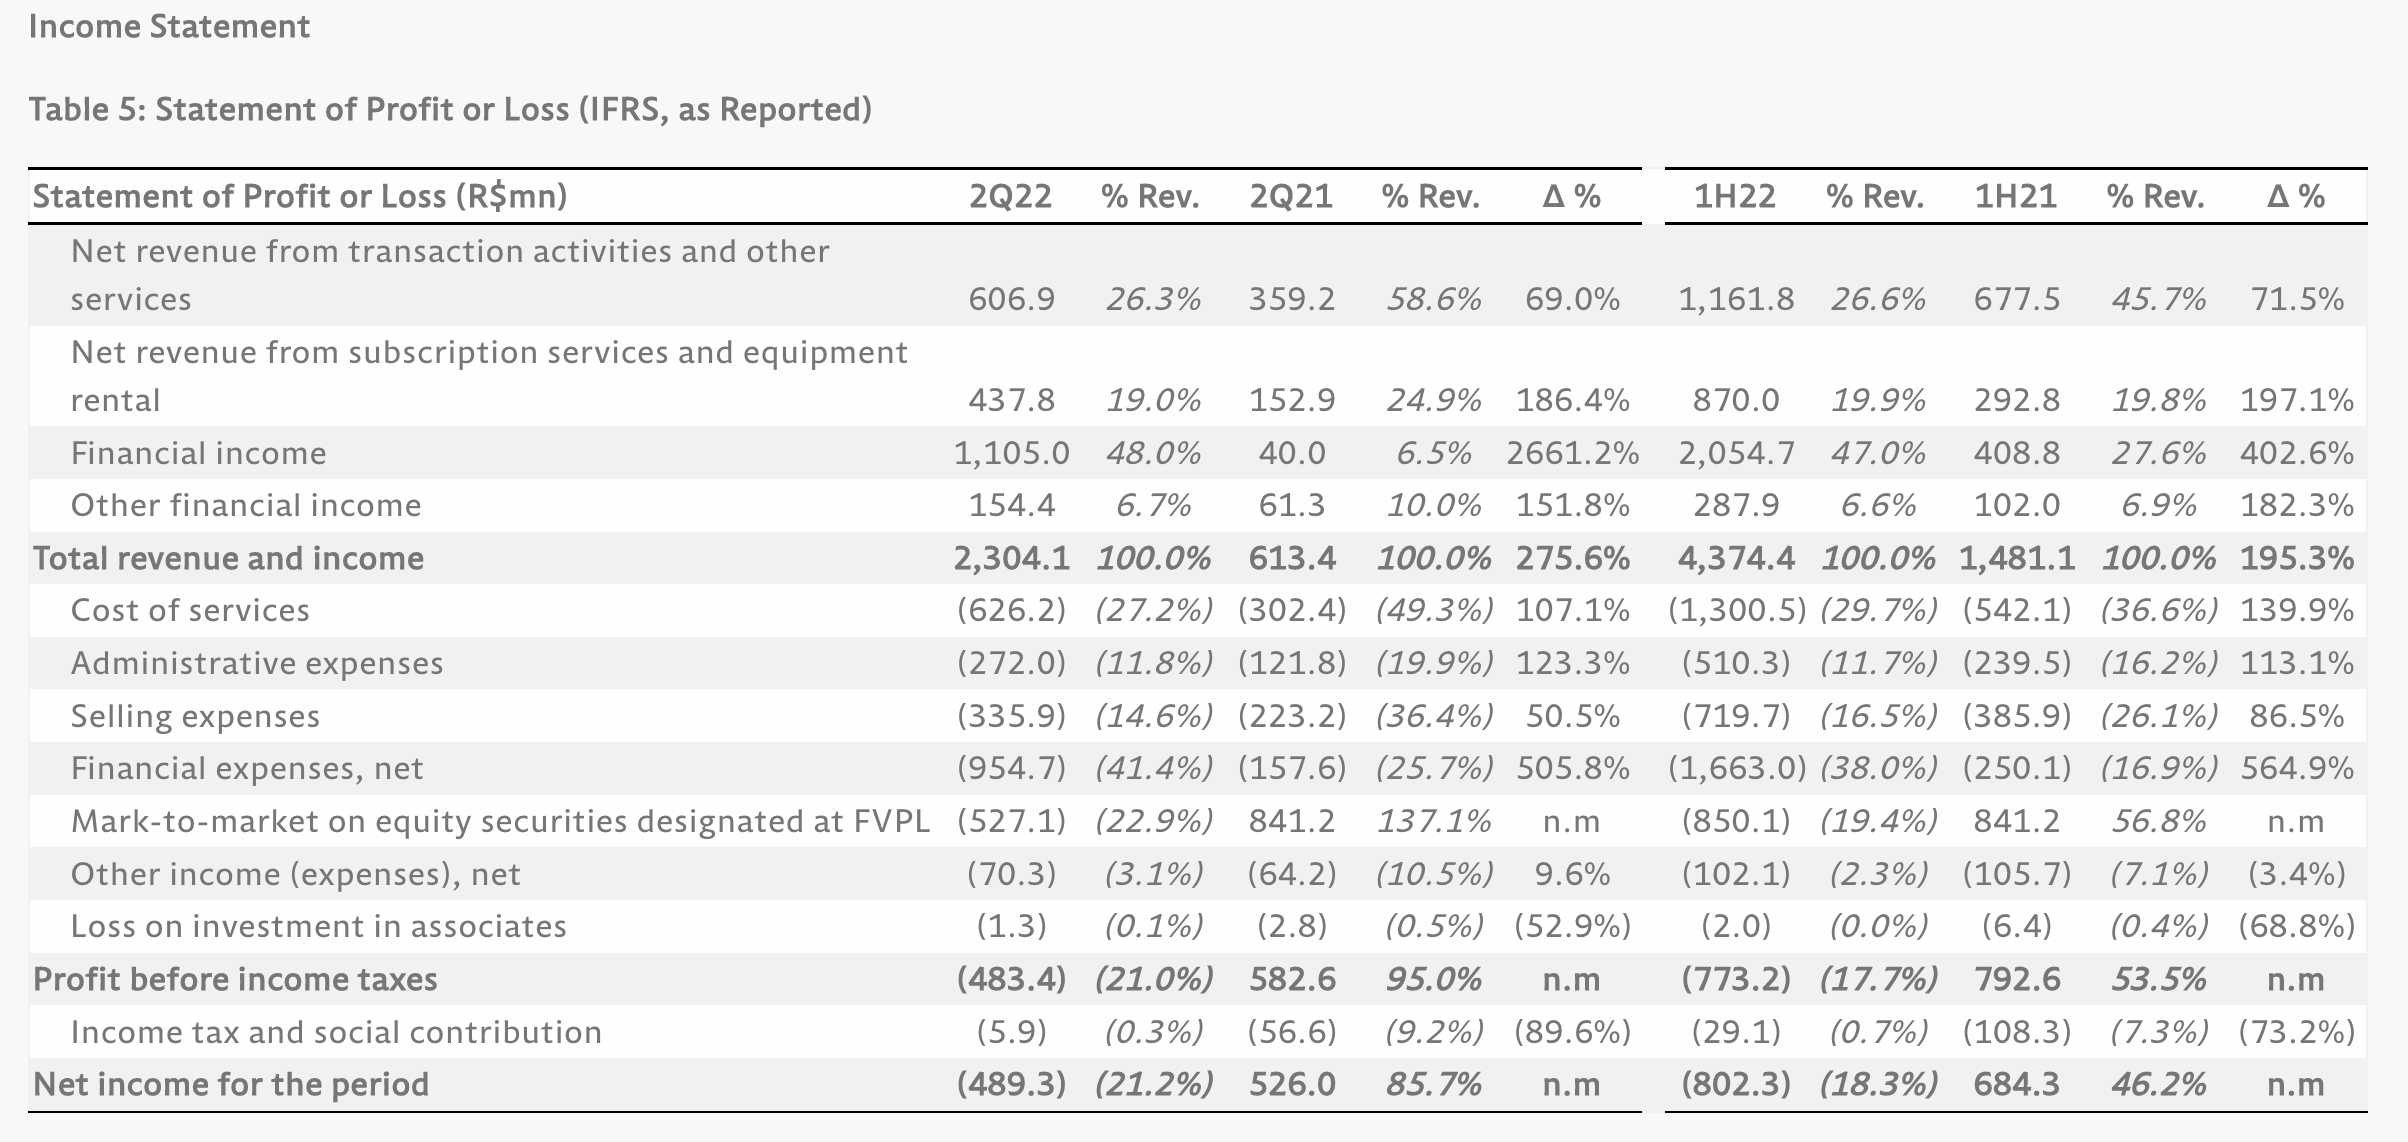
Cost of services, administrative services, and selling expenses, look quite reasonable as a percentage of revenue. Financial Expenses above 40% of revenue and the mark-to-market on equity securities designated at Fair Value thru Profit and Loss together constitute nearly two-third of revenue and seem to weigh on net margins, thus fueling the main problem areas.
Financial Expenses, Net were R$954.7 million, >500% higher compared with Q2 ’21 or 450% pro-forma for Linx (but 34.8% higher than Q1 ’22). Increased cost of funds, mainly due to the higher interest rate in Brazil, which increased from an average of 3.23% in Q2 ’21 to 12.38% in Q2 ’22 (as well as higher prepayment volumes and financial expenses related to StoneCo’s bond) were the main culprits.
In Q2 ’22, the Company recognized R$527.1 million in mark-to-market losses in reference to its investment in Banco Inter.
It is key to understand that both interest rates and principal losses in Banco Inter investment are circumstantial and largely unrelated to StoneCo’s fundamentals, business operations, and overall financial health. If interest rates stabilize or start to recede and INTR shares stop hitting equity owners, this part of the income statement may show spectacular recovery.
Macro Factors Weighing on Stock Performance May Dissipate
The prospects of stagflation have hit StoneCo shareholders hard. An inflation rate and core inflation in excess of 10% have the potential to inflict considerable hardship to both the Brazilian consumer and small businesses. StoneCo has a lending arm with huge exposure to Brazil’s small businesses and defaults have risen sharply as a result of rising borrowing costs, which have wrecked income statements. This cycle may finally come to an end. The Consumer Price Index for Brazil is 6388.87 for the month of August 2022. The inflation rate year over year is 8.73% (compared to 10.07% for the previous month). Inflation from July 2022 to August 2022 was -0.36%. FocusEconomics panelists project the SELIC rate to end 2022 at 13.88% but 2023 at a lower 10.81%. Some relief may thus be on the way. (Given the aggressive stance and Fed funds perched above the inflation rate, the currency should remain stable, unless a liquidity event hits and the US Dollar serves as a safe haven, but this does not seem to constitute a likely scenario at this juncture.)
If this is a tough company to own in an inflationary recession, the damage has largely been done. Both the share price and the Selic rate’s high posit relative to inflation convey the pain. Higher distressed debt and losses may begin to subside, as well. StoneCo should start to benefit from better economic prospects. The market will be quick to anticipate. The end of the bear for STNE may thus be near, if the stock has not bottomed already. Now is a good time to consider going long. The challenging Brazilian economy has put intense pressure on the stock; its recovery may trigger a bull of similarly impressive magnitude.
(Note that inflation is not that fateful to StoneCo’s business; it directly feeds into revenue and the Company again shows a clear aptitude at modulating prices moving forward; this said, its impact on both consumers and MSMBs and rate hikes obviously offset some of those dynamics.)
Brazil growth and fintech Total Addressable Market Also Favor StoneCo and Longs
StoneCo operates in Brazil, which is a large and fast-growing market for financial technology solutions. Prior to the global pandemic, the country was largely a cash-based economy, with consumers reluctant to use digital payments when making transactions. The pandemic has accelerated digital payment adoption.
Per StoneCo’s 10k:
According to IBGE, Brazil nominal GDP and Private Consumption Expenditures in 2021 were R$8.7 trillion and R$5.3 trillion, respectively, up from R$7.5 trillion and R$4.7 trillion, respectively, in 2020. According to Statista Global Consumer Survey, retail e-commerce sales in Brazil (…) are expected to reach US$49.2 billion in 2022 and are expected to post a compound annual growth of 20.7% from 2022 to 2025. The payments market has continued to grow and demonstrated resilience to macroeconomic fluctuations in Brazil. During Brazil’s most recent economic recession from 2014 to 2017, nominal GDP grew at a compound growth of 4.3%, according to the World Bank. During the same period, electronic payments volume grew at a compound annual growth rate of 8.1%, according to ABECS. More recently, with the COVID-19 crisis and lockdowns among different cities in Brazil, the acquiring market still posted an 11.1% growth in 2020 (…). In 2021, total volume of card transactions increased 30.0% (…).
Electronic payments penetration in Brazilian household consumption has been increasing significantly throughout the years as consumers adoption increases. As a result, card’s TPV as a percentage of household consumption has increased from 32% in the end of 2016 to 49% in 2020 and is estimated to have reached 54% by the end of 2021. According to ABECS, penetration of electronic payments in household consumption in Brazil is estimated to reach 60% by the end of 2022. As a result, we believe there is a big opportunity to continue to grow and increase our presence in this market. (….) As we expand our capabilities to serve merchants with additional financial solutions, we enter new markets in Brazil such as banking services, credit solutions and insurance.
The software market shows similar potential for StoneCo. The low penetration of management software in Brazil compared to more mature markets such as North America, is a key tailwind.
There is thus a long runway ahead for StoneCo’s business. To quote the 10k again:
According to ABECS data, the Brazilian merchant acquiring industry processed R$2.7 trillion in TPV during 2021, resulting in a market share for Stone for the fourth quarter of 2021 of 11.2%, growing from 10.3% in the fourth quarter of 2020. Still, StoneCo has not yet reached scale on new solutions, with less than 1% market share in digital banking, credit and insurance.
The same goes for StoneCo’s Software Market Share.
After the acquisition of Linx in 2021, we are the leading retail management software company in Brazil according to the 2020 IDC Survey. We are also the second largest player for e-commerce solutions in Brazil according to the 2020 IDC Survey. We estimate that we have approximately 13% penetration of the software SAM in Brazil, which totals R$9 billion in revenue.
StoneCo estimates that there are approximately 13.5 million total businesses in Brazil in segments that the firm believes delineate a material market opportunity for electronic payments. The number of active payments clients reached approximately 1,766,100 at the end of 2021, meaning there is a long runway of growth potential over the coming years.
Meanwhile, the regulatory environment for the payments industry in Brazil has recently undergone significant changes due to a concerted effort by the Central Bank and the Brazilian government to stimulate innovation and promote competition. Per the 10k:
In 2010, the Central Bank and antitrust authorities initiated a series of measures that eliminated the exclusivity of certain vendors and opened up the market to new entrants. Since then, a new regulatory framework has been developed and government authorities have been fostering competition. We believe this has created an attractive environment for innovative financial technology providers, such as us, to continue to disrupt the market, bring better solutions to clients, and grow our market share.
More financial services are being provided outside of legacy bank branches, such as at the point-of-sale or online, as well. Non-bank firms like StoneCo are using technology (PoS, mobile, cloud, etc.) to deliver these services more efficiently.
Valuation Measures Show the Risk/Reward Now Favors Long
Check out the Valuation Grade and Underlying Metrics for StoneCo, as figures below:
Seeking Alpha – Valuation
A number of key gauges including PEG ratio (non-GAAP, forward, well under the sector median of 1.32), enterprise value over EBITDA (forward, which, at 4.36, is not even half the sector median of 11.33), enterprise value over sales, price per sales, and price per cash flow, rate quite high, meaning they compare quite favorably with the sector median.
Stone has a track record of growing its top line at a CAGR of 30% (or well above, see annual income statement above for detail) and maintaining high operating margin (above 20%). US merchant acquiring companies like FISV and FIS have operating margins in the 30%-50% range. They have more scale but a similar margin profile for StoneCo seems reasonable within 3-5 years. The firm’s leadership in a market that is still well-underserved means it may very well be able to reach similar (both top and bottom line) performance levels over the next five years. An exit multiple (P/E) of 20 will allow the share to double within 3-5 years; the more aggressive the growth, the faster the rerating of shares, of course.
Currently, consensus estimates for 2023 EPS are a very high (see earnings summary below).
E*Trade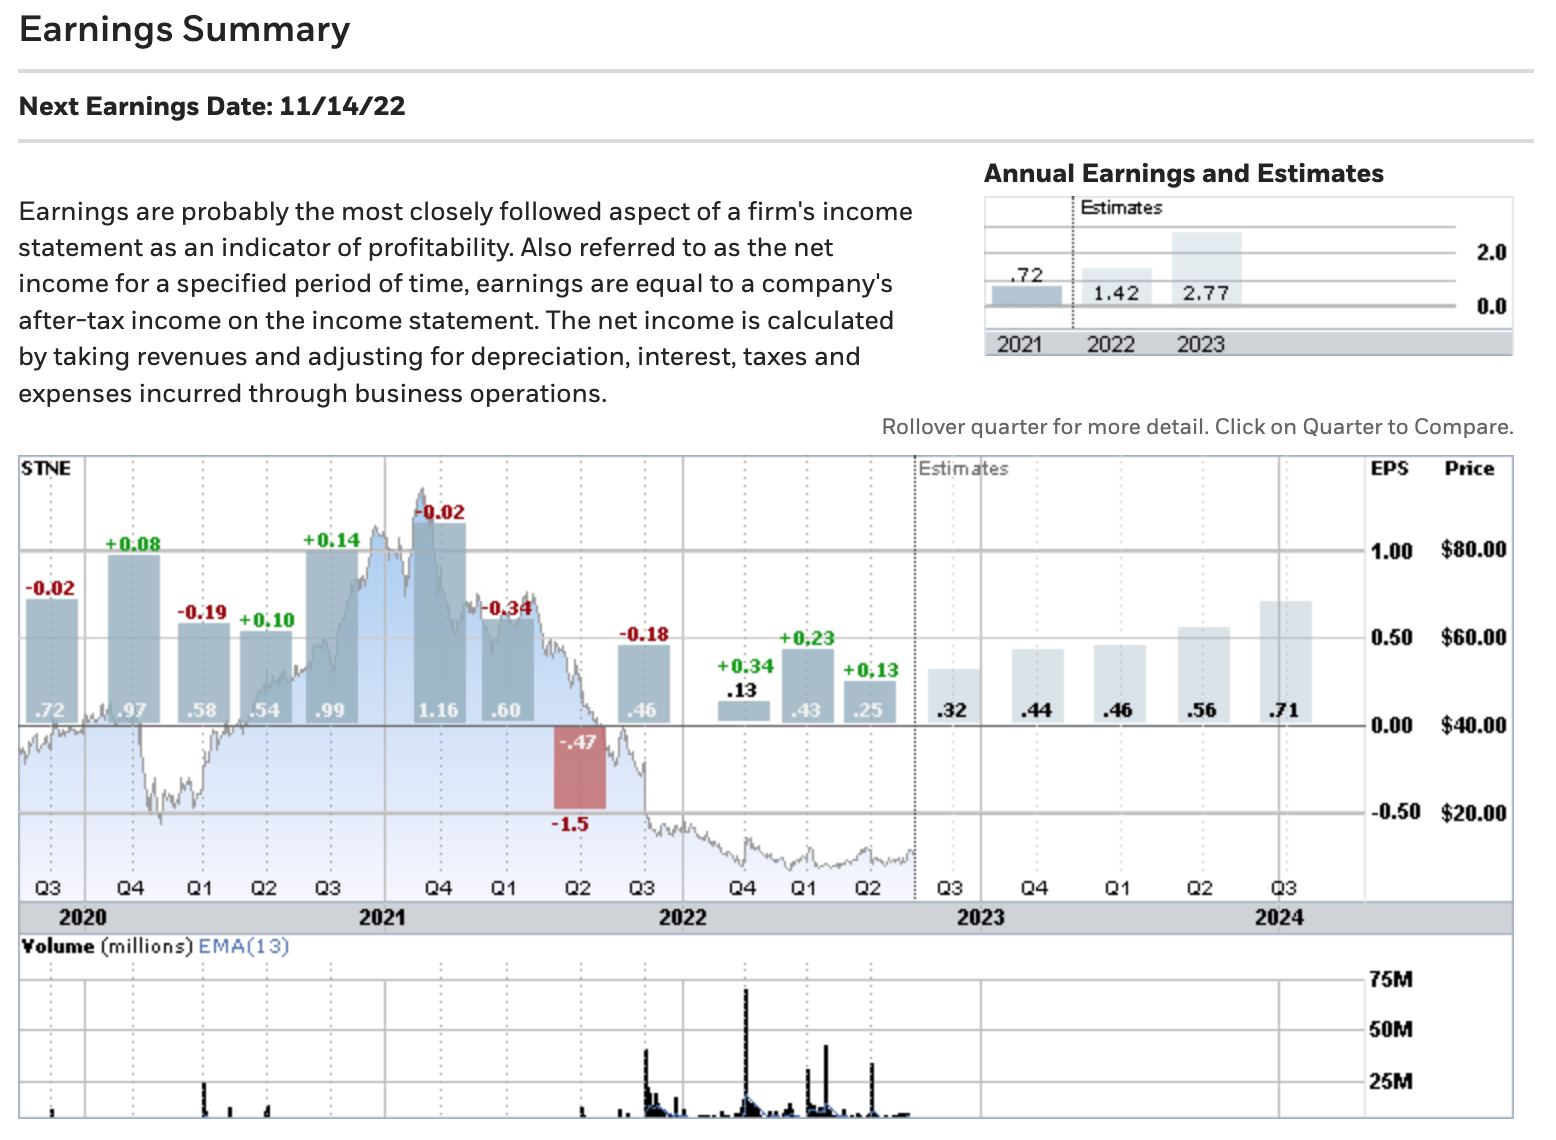
If you assign a forward P/E ratio of 16 (somewhat conservative if you use the following PE Ratio by Sector (US) table as a guide and historical averages) and envisage earnings of $1.5, then, you arrive at (1.5 x 16) a share price closer to 24, not too far from double the current price. Various possible scenarios apply, of course, but given strong revenue momentum and management’s focus on improving profitability (as is made clear above), it’s quite clear that valuation is still very cheap and a powerful rerating of shares could be in order within a couple of years.
A number of analysts have a current price objective just above current share price derived from a target P/E of 20-22x on very conservative ’23 non-GAAP EPS estimate well below $1 and even closer to $.5. A 1.2-1.5 standard deviation below historical average essentially reflects the risks a higher rate environment inoculates. StoneCo’s ability to reprice its services in the face of uncertainties, as evidenced since the beginning of the year, likely argues for a less conservative valuation stance.
The Risks, While Real, Seem Well-Priced in
Investors should refer to the 10k for a comprehensive list of risks they may incur.
Alas, most investors have had to record loss of capital, if they stayed STNE long enough. Despite recent upward momentum, the stock still trades rather close to its bottom ($6.81, reached on May 12, 2022).
The highest risk to the share price remains the continued challenging macroeconomic factors. They are out of the company’s control, but any further deterioration would, of course, have share price ramifications. High inflation, in particular, could cause consumer spending to slow down, negatively impacting both top and bottom lines.
Add to economic uncertainty and political instability in Brazil and elsewhere exchange rate instability, which may have adverse effects on the Brazilian economy, as well. Currency impacts shouldn’t be too detrimental, though, unless a massive devaluation event occurs like a sovereign default of Brazil or uncontrollable inflation (unlikely at this juncture).
Other key factors that could harm the firm’s business, reputation, and financials, include intensifying competition, both within the industry and from other payments methods, which could limit growth in top line and TPV, and lead to lower profitability.
The Brazilian federal government exercises significant influence over the Brazilian economy. This involvement, as well as Brazil’s political, regulatory, legal and economic conditions, could harm both business and the price of StoneCo’s Class A common shares.
The company’s founder shareholders own, in the aggregate, 100.0% of outstanding Class B common shares and control all matters requiring shareholder approval. This concentration of ownership limits public shareholders’ ability to impact the decision-making process.
Finally, the Linx Transaction may result in significant charges or liabilities that could adversely affect the financial results of the combined company. StoneCo has recorded a significant amount of goodwill and other intangible assets on its consolidated financial statements, which could be subject to impairment if the merger does not deliver.
Conclusion
StoneCo may constitute a significant wealth creation opportunity for long-term investors. The firm qualifies as:
- A market and fintech leader in an expanding space,
- Endowed with solid financials including a growing top line and mostly healthy profitability and cash flow generation gauges,
- Negative market sentiment has punished the stock, presenting bargain hunters with an opportunity.
- Did we forget to mention that Warren Buffett’s Berkshire Hathaway (BRK.A) (BRK.B) still owns shares of StoneCo? He, after all, has quite a track record.
Solid appreciation potential exists within the next five years. Bullish investors should start accumulating decisively. The more cautious ones – i.e., those waiting for the next bull market in growth stocks and/or greater visibility into StoneCo’s future sales, cash flow, and earnings – might prefer to dollar average.
Be the first to comment