

Mimadeo/iStock via Getty Images
Another Fed meeting has come and gone, and this meeting has undoubtedly delivered a clear message to the markets. It is not going to back off raising rates until the inflation rates drop, and what may be worse is that Fed appears to be playing chess while the market has been playing checkers. All of this as the US economy heads towards a recession.
Perhaps the most surprising piece of information is that Jay Powell focuses on headline inflation, not core inflation. This little intricacy matters a great deal because headline inflation is running much hotter than core inflation. Not only that, headline inflation includes oil, gasoline, and commodity prices, which the Fed has very little control over.
That may suggest that the Fed has to raise much further than what the market priced between the Fed’s dot plots. Yes, the Fed did raise its interest rate forecast for 2022 to 3.4% from 1.9% and 3.8% in 2023 from 2.8%. The only problem is that 3.8% is where the Fed sees rates in December 2023, which leaves a lot of room for rates to go much higher between December 2022 to December 2023.
Fed
The day after the Fed meeting, we see Fed Fund Futures are pricing much higher rates than it had projected before the meeting. Those futures are now pricing a peak rate of 4.1% by May 2023, up from 4% on June 14.
Bloomberg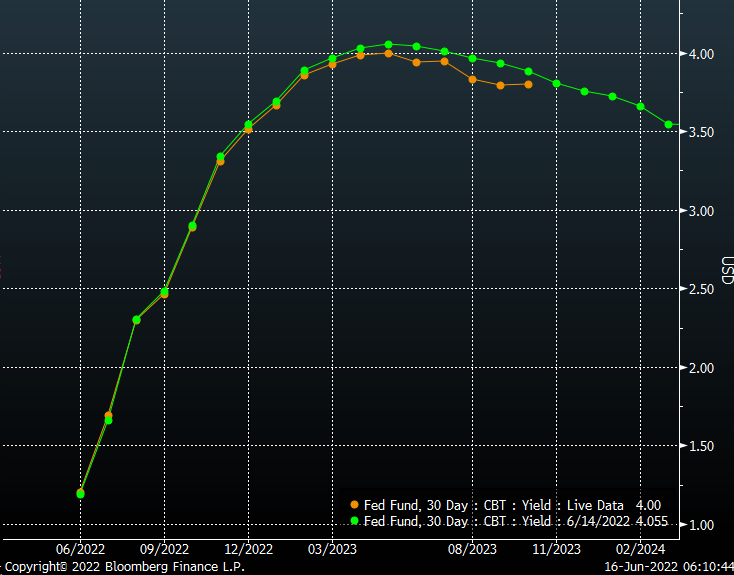
What makes matters worse is that if the Fed targets headline inflation rates, it may be the Fed is even further behind the curve than most investors believed, because many investors had been focused on core inflation. Because core inflation doesn’t have things like food and energy, that inflation rate tends to run lower than headline inflation.
The Fed Funds rate typically runs higher than the year-over-year CPI rate. So everyone will need to hope that inflation starts coming down soon; otherwise, overnight rates will need to go much higher than what the markets are even pricing in.
Bloomberg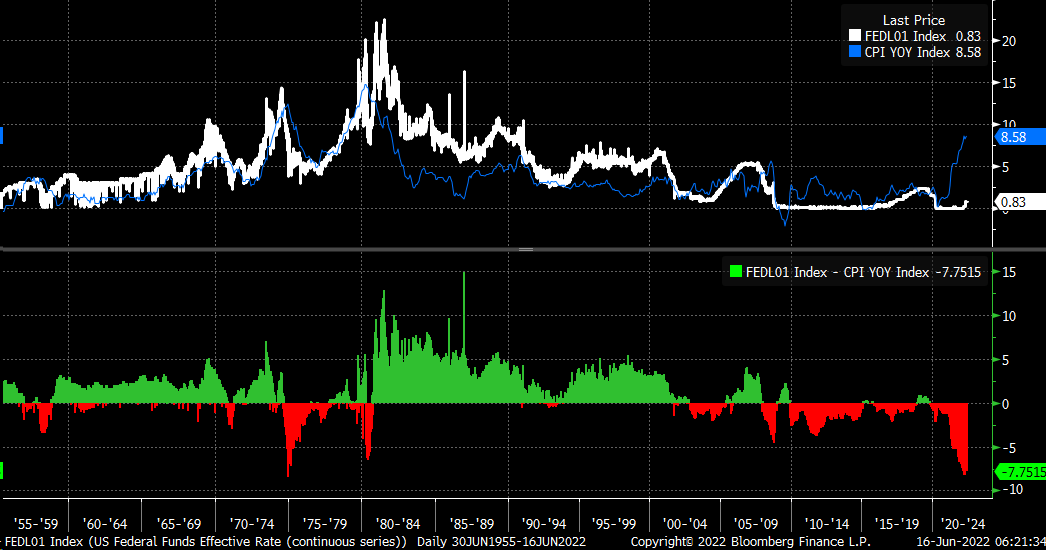
What makes all of this worse is that the Fed is planning to slow the economy into a potential economic storm. The Atlanta Fed GDPNow model is currently projecting a 0.0% second-quarter growth rate. It follows a negative GDP print for the first quarter, which would be two negative quarters of real GDP, what used to be considered a recession.
Bloomberg
This means stocks will suffer as investors try to feel their way through just how high the Fed will need to raise rates to bring down inflation. That will drive the valuation of stocks down as the risk of a recession increases. That means that the equity risk premium, in simplest terms, will need to rise further for the S&P 500. The spread between the index’s earnings yield and the 10-year rate is too low at 2.6%, and the S&P 500 current PE ratio of 16.6 is too high.
Bloomberg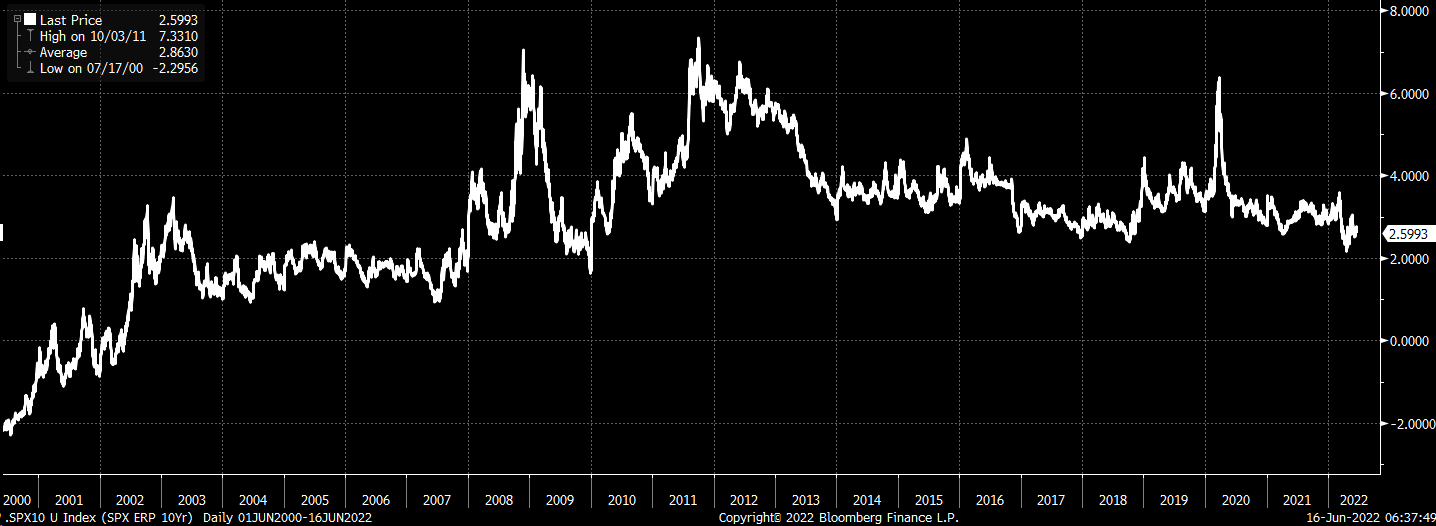
The problem is that the higher the 10-Yr rate rises, the lower the PE ratio of the index will need to fall. If the 10-yr, for example, were to rise to 4%, to maintain the current spread of 2.6%, the S&P 500 earnings yield would need to increase to 6.6%, or a PE ratio of roughly 15.1. For the equity risk premium to rise back its spread seen in 2015, 2016, 2018, and 2019, of around 4 to 4.5%, the earnings yield would need to rise to about 8%, giving the S&P 500 a PE ratio of 12.5, assuming a 4% 10-Yr rate.
While it is yet to be seen just how far the 10-yr rate may rise, assuming the current 10-yr rate is around 3.5% and an equity risk premium of 4%, the S&P 500 earnings yield would increase to approximately 7.5%, or a PE ratio of roughly 13.3, valuing the index at 3,100.
If this sounds outlandish, look at where the PE ratio has bottomed out over the last decade during periods of this much economic uncertainty. In 2011, the bottom was around 12; in 2014, that bottom was around 14. In 2015 and 2016, that bottom was around 15.5. In 2018, it came to approximately 14, and in 2020, it was around 13.5.
Bloomberg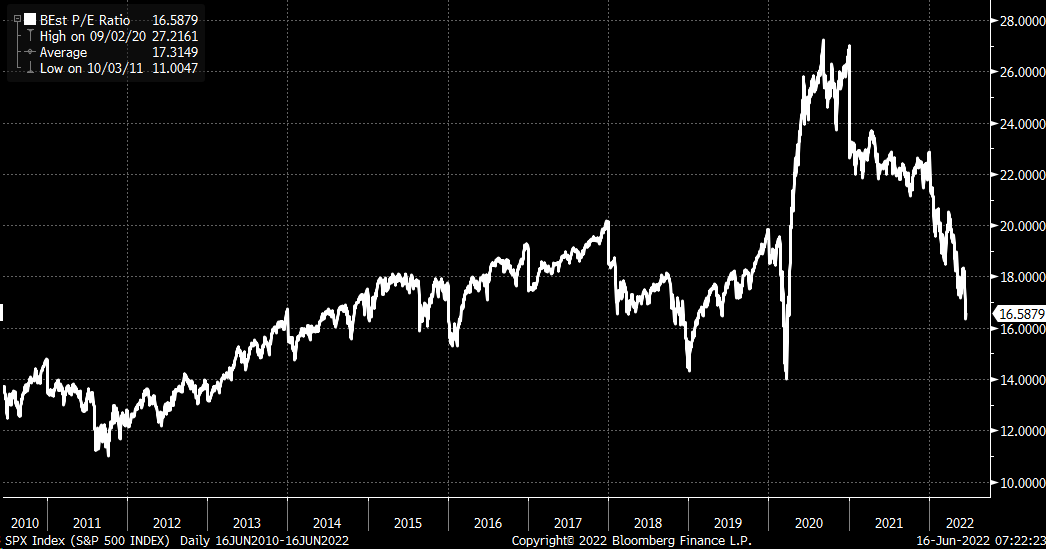
A base case of the S&P 500 bottoming its PE ratio around 14 seems feasible, placing the index in a range of 3,200 to 3,300.
The Fed’s job to bring inflation rates down will be very challenging, meaning the Fed will not be coming to the stock market’s rescue anytime soon. Doing such goes against what the Fed is trying to accomplish: tighten financial conditions and restrict the economy.
Historically, the stock market does not rise while financial conditions are tightening, and the tighter financial conditions get, the more the market will fall. Unfortunately, the Chicago Fed National Financial Conditions Index still shows easy conditions and needs to get above 0 to indicate that conditions are restrictive, which means they still need to get much tighter.
Bloomberg
Of course, this doesn’t mean we go down in a straight line. There will be plenty of rally attempts as markets go from oversold to overbought conditions along the way. It will be a bumpy ride, and ultimately how far stock prices drop along the way will be dependent on how high the Fed pushes rates.
Be the first to comment