

kupicoo/E+ via Getty Images Stitch Fix 
In this analysis of Stitch Fix (NASDAQ:SFIX), we analyzed its business in the fashion subscription market and the competitive rivalry. We estimated its market share based on the fashion subscription market size and projected its client base growth. We also analyzed its growth by revenue per client and projected it to forecast the company’s total revenue and determined its decelerating growth. Lastly, we examined its profitability and compared its SG&A spending to competitors as a % of sales. We find the company in a precarious position given its moderating growth and negative margins.
Deteriorating Active Client Base Growth as Competition Intensifies
Compared to the traditional apparel e-commerce retailer, Stitch Fix provides personalized outfit recommendations based on the use of personal stylists, machine learning and deep learning according to SEOAves. According to Coresight Research, the US apparel subscription e-commerce segment represents about 1% of the total U.S. apparel and footwear market in 2021. Based on the US apparel market size of $303 bln, the apparel subscription e-commerce market is valued at $3.03 bln based on the share of apparel subscription e-commerce of the total apparel market share of 1%. Based on the market size, we calculated Stitch Fix’s market share at 69% as the market leader and ahead of competitors including Rent the Runway, Wantable, Le Tote, and Dia & Co.
Stitch Fix’s client base has been increasing by an average of 20% from 2016 until 2021. However, its active clients’ growth was at a decreasing rate from 31% in 2017 to 9% in 2020 before recovering to 18% in 2021. Though, as of Q2 2022, its active client base had declined by 4%.
|
Stitch Fix Clients |
2016 |
2017 |
2018 |
2019 |
2020 |
2021 |
Q2 2022 |
|
Active clients ($ mln) |
1.67 |
2.19 |
2.74 |
3.24 |
3.52 |
4.17 |
4.02 |
|
Growth % |
31% |
25% |
18% |
9% |
18% |
-4% |
Source: Stitch Fix, Khaveen Investments
In its latest earnings briefing, the company’s management explained the growth of its client base was affected by the conversion of new visitors below expectations and changes to Apple’s iOS.
There were two factors that largely impacted gross adds: First, conversion of new visitors as for Fix and Freestyle is not where we want it to be; second, given changes in iOS 14, marketing channels that have historically been effective for us are presenting challenges and effectively targeting clients. – Elizabeth Spaulding, CEO
Also, this as competition intensifies as traditional retailers such as Amazon (AMZN) launched its Prime Wardrobe services in 2018. More than 150 mln Prime members could enjoy the benefits of Prime Wardrobe and nearly 80% of Prime members shop for apparel according to Retail Dive. Amazon’s Personal Shopper provides access to all Amazon’s stock which consists of wide selections for customers to find relevant clothes.
Stitch Fix has initiated a pilot program targeting to increase interaction between stylists and clients via video call and provides flexibility for clients to select their choices of clothing or accessories. In September 2021, Stitch Fix has also launched Stitch Fix Freestyle, which differentiates clients’ shopping experience by enabling clients to instantly buy items curated for them based on personal styling preferences without going through the usual Fix ordering. We believe this could further enhance the client base’s loyalty without specific subscription plans required from the clients.
Based on the increased competition in the market over the past few years, we expect the active clients to continue growing through 2024 at a decreasing rate. We projected its active clients in 2022 based on its Q2 2022 as a conservative assumption following its decline from 2021. Beyond 2022, we based our forecast on its average 3-year customer base increase of 0.26 mln per year.
Stitch Fix, Khaveen Investments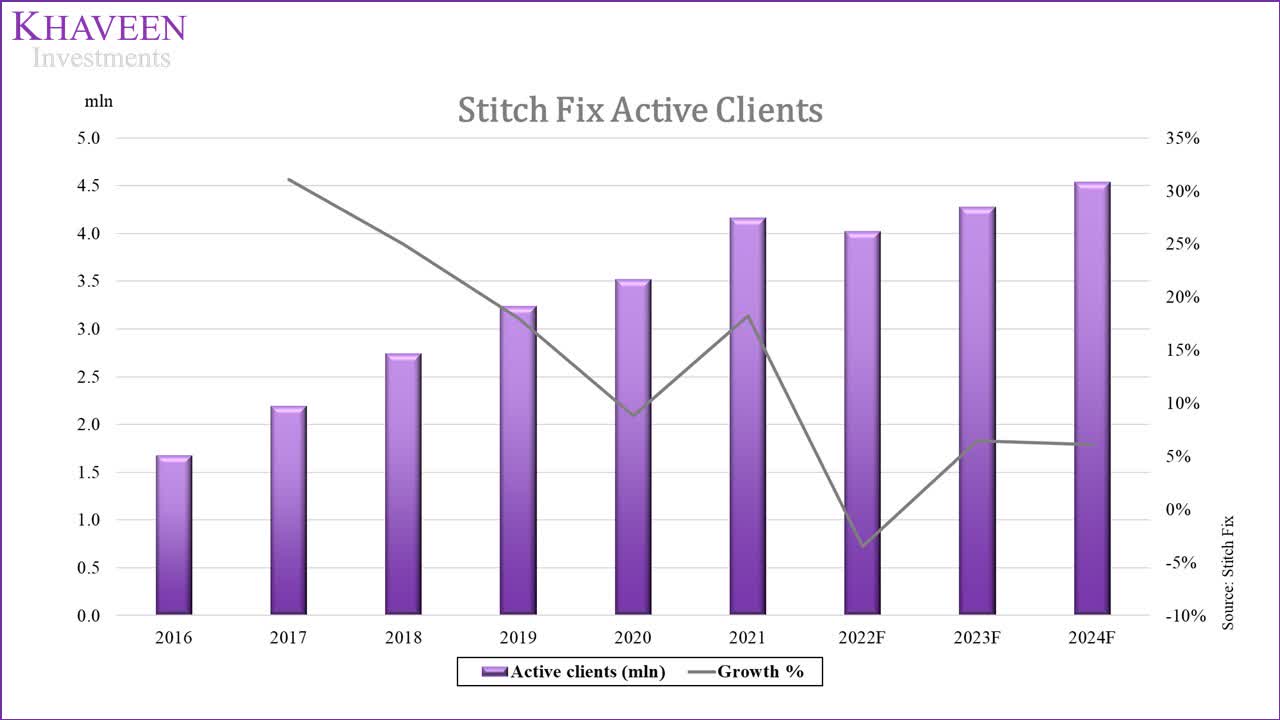
Low ARPU Growth
While Stitch Fix’s client base had grown robustly in the past 5 years, the company’s revenue per client had been flattish. Although its client base had grown at a 5-year average of 20%, its revenue per client had only grown at a fraction of that at a 5-year average of 3%.
|
Stitch Fix Clients |
2016 |
2017 |
2018 |
2019 |
2020 |
2021 |
|
Active clients (‘mln’) (‘a’) |
1.67 |
2.19 |
2.74 |
3.24 |
3.52 |
4.17 |
|
Growth % |
31% |
25% |
18% |
9% |
18% |
|
|
Revenue ($ mln) (‘b’) |
436.26 |
445.35 |
447.30 |
487.52 |
486.00 |
504.51 |
|
Growth % |
2% |
0% |
9% |
0% |
4% |
|
|
Revenue per client (‘c’) |
730.30 |
977 |
1,227 |
1,578 |
1,712 |
2,101 |
|
Growth % |
34% |
26% |
29% |
9% |
23% |
*c = a x b
Source: Stitch Fix, Khaveen Investments
Furthermore, comparing its product offerings, Stitch Fix has a relatively wider range of product categories from Women’s, Plus, Petite, Maternity, Men’s, and its Private labels. Besides that,
Stitch Fix also has a wider range of sizes compared to its top competitor Trunk Club according to CNET. Besides that, Stitch Fix has more flexible pricing options based on customers’ budgets compared to Trunk Club which provides 3 pricing options. Additionally, Stitch Fix clients could return products via mail, but Trunk Club only allows returns via UPS and Nordstrom stores.
To compare the range of brands available through Stitch Fix and Trunk Club, we identified some of the brands offered by the companies in the table below. While Stitch Fix provide its clients with a variety of brands based on the price range, Trunk Club offers more high-end fashion brands that benefitted from Nordstrom’s (JWN) inventory. Trunk Club’s products portfolio has 31 brands under the Top 50 Apparel Brands by Brand Value compared to Stitch Fix’s 10 brands.
Popular Apparel Brands in Stitch Fix & Trunk Club
|
Stitch Fix |
Trunk Club |
|
Nike (NKE) |
Nike |
|
Under Armor (UA) |
Gucci |
|
Calvin Klein |
Adidas |
|
Levi’s (LEVI) |
Chanel |
|
The North Face |
Cartier |
|
Adidas (OTCQX:ADDYY) |
Hermes |
|
Ralph Lauren (RL) |
Tiffany & Co. |
|
Tommy Hilfiger |
Coach |
|
New Balance |
The North Face |
|
Puma (OTCPK:PMMAF) |
|
|
Burberry (OTCPK:BURBY) |
|
|
Ralph Lauren |
|
|
Ray-Ban |
|
|
Levi’s |
|
|
Prada (OTCPK:PRDSY) |
|
|
Under Armour |
|
|
Moncler (OTCPK:MONRF) |
|
|
Michael Kors |
|
|
Saint Laurent |
|
|
Fila |
|
|
Tommy Hilfiger |
|
|
Pandora |
|
|
Calvin Klein |
|
|
Armani |
|
|
Givenchy |
|
|
Skechers (SKX) |
|
|
New Balance |
|
|
Valentino |
|
|
Converse |
|
|
Timberland |
|
|
Loewe |
Source: Stitch Fix, My Favorite Hello, Trunk Club
Additionally, based on the customer reviews on Facebook (FB), Stitch Fix has the lowest customer reviews compared to Trunk Club and Wantable. Certain customers were sending items back to Stitch Fix because they did not fit their expectations on personalization. Also, some reviews mentioned the clothes delivered were sub-par quality and shrink after a few wears. Others were providing negative feedback on Stitch Fix’s delivery services. The table below shows its average customer reviews which we believe highlights a disadvantage for Stitch Fix against its competitors having the lowest reviews.
Facebook Customer Reviews
|
Stitch Fix |
Trunk Club |
Wantable |
|
3 |
3.9 |
3.3 |
Source: Facebook
Overall, while we view the company’s wide product offerings across genders and sizes and flexible pricing range with low stylist fees positively, we believe Stitch Fix’s competitors including Trunk Club could have a stronger advantage in terms of its brand selection and popularity and better customer reviews. Thus, we maintain a neutral outlook for the company and expect its revenue per client growth to remain stable and projected its revenue per client based on its 5-year average growth of 3% through 2024.
|
Stitch Fix Clients |
2016 |
2017 |
2018 |
2019 |
2020 |
2021 |
2022F |
2023F |
2024F |
|
Revenue per client |
436.26 |
445.35 |
447.30 |
487.52 |
486.00 |
504.51 |
519.66 |
535.26 |
551.33 |
|
Growth % |
2% |
0% |
9% |
0% |
4% |
3% |
3% |
3% |
Source: Stitch Fix, Khaveen Investments
Profitability Weighed Down by High SG&A Expenses
While Stitch Fix has high revenue growth, its profitability had been poor with a 5-year average net margin of 0.32%. One of the factors is due to the relatively high SG&A expenses in % of its revenue. Compared to other fashion e-commerce companies including Asos, Zalando, Revolve and Global Fashion Group, Stitch Fix has the highest SG&A % of Revenue compared to the average of 43%.
|
Fashion E-commerce Companies |
SG&A |
Revenue |
SG&A % of Revenue |
|
Stitch Fix |
1,011 |
2,101 |
48% |
|
Asos |
2,178 |
5,377 |
41% |
|
Zalando |
3,708 |
9,751 |
38% |
|
Revolve |
244 |
581 |
42% |
|
Global Fashion Group |
785 |
1,661 |
47% |
|
Average |
1,585 |
3,894 |
43% |
Source: Company Data, Khaveen Investments
In the previous points, we highlighted the increasing completive rivalry for the company such as with the entry of Amazon competing against Stitch Fix which we believe to be a strong competitive threat to the company. Furthermore, Nordstrom has acquired Trunk Club in 2014 to provide personalized apparel recommendations by using Amazon’s AWS platform and partnering with TrueFit to recommend personal sizing for its clients.
From the Q2 2022 Earnings Briefing, management explained it expects to continue focusing on marketing activities and to support Freestyle in the following quote.
As we previously mentioned, we expect to increase marketing as our conversion improves and as we test into newer marketing channels. – Dan Jedda, CFO
According to CSA, retail e-commerce companies incur SG&A expenses for managing online orders and returns, digital marketing and supply chain improvements. We expect Stitch Fix to continue incurring high expenses in order to maintain its competitiveness and market share. We projected its margins in the chart below with an SG&A as a % of revenue assumption based on its 2021 figure of 48%.
Stitch Fix, Khaveen Investments
|
SG&A % of Revenue |
2016 |
2017 |
2018 |
2019 |
2020 |
2021 |
2022F |
2023F |
2024F |
|
SG&A Expenses |
259 |
403 |
493 |
680 |
806 |
1,011 |
1,005 |
1,102 |
1,205 |
|
Growth % |
56% |
22% |
38% |
19% |
25% |
-1% |
10% |
9% |
|
|
Revenue |
730 |
977 |
1,227 |
1,578 |
1,712 |
2,101 |
2,089 |
2,291 |
2,504 |
|
Growth % |
34% |
26% |
29% |
9% |
23% |
-1% |
10% |
9% |
|
|
SG&A % of Revenue |
35% |
41% |
40% |
43% |
47% |
48% |
48% |
48% |
48% |
Source: Stitch Fix, Khaveen Investments
All in all, the company’s revenues had been growing strongly but had to remain unprofitable. We expect the company to remain unprofitable going forward due to the intensifying competitive landscape with competitors such as Amazon and Trunk Club. To defend its market share, the company had incurred high SG&A expenses and we believe it could continue incurring high expenses to defend its market share from competitors.
Risk: Growth Dependent on Client Base Expansion
Although Stitch Fix had a high revenue growth at an average of 24%, its growth had been driven by the growth of its client base at an average of 20%. Whereas its revenue per client had been stagnant at only 3% average growth. We believe this highlights a disadvantage as the company’s growth had been dependent on client acquisition rather than through the increasing monetization of its existing client base. Should its client base growth slow down, we believe this could be a risk to its overall growth should it fail to increase its client base monetization abilities. Though, the company had launched Freestyle, according to Stitch Fix which we believe could increase user engagement as it allows shoppers to purchase items directly from the platform without ordering a Fix.
|
Stitch Fix Growth |
Average 5-year Growth |
|
Active Clients |
20% |
|
Revenue Per Client |
3% |
|
Revenue |
24% |
Source: Stitch Fix, Khaveen Investments
Valuation
The company’s 5-year revenue growth is 23.84% with average gross and net margins of 44.4% and 0.32%. Despite having high gross margins, its net margin was weighed down by high SG&A expenses.
Stitch Fix, Khaveen Investments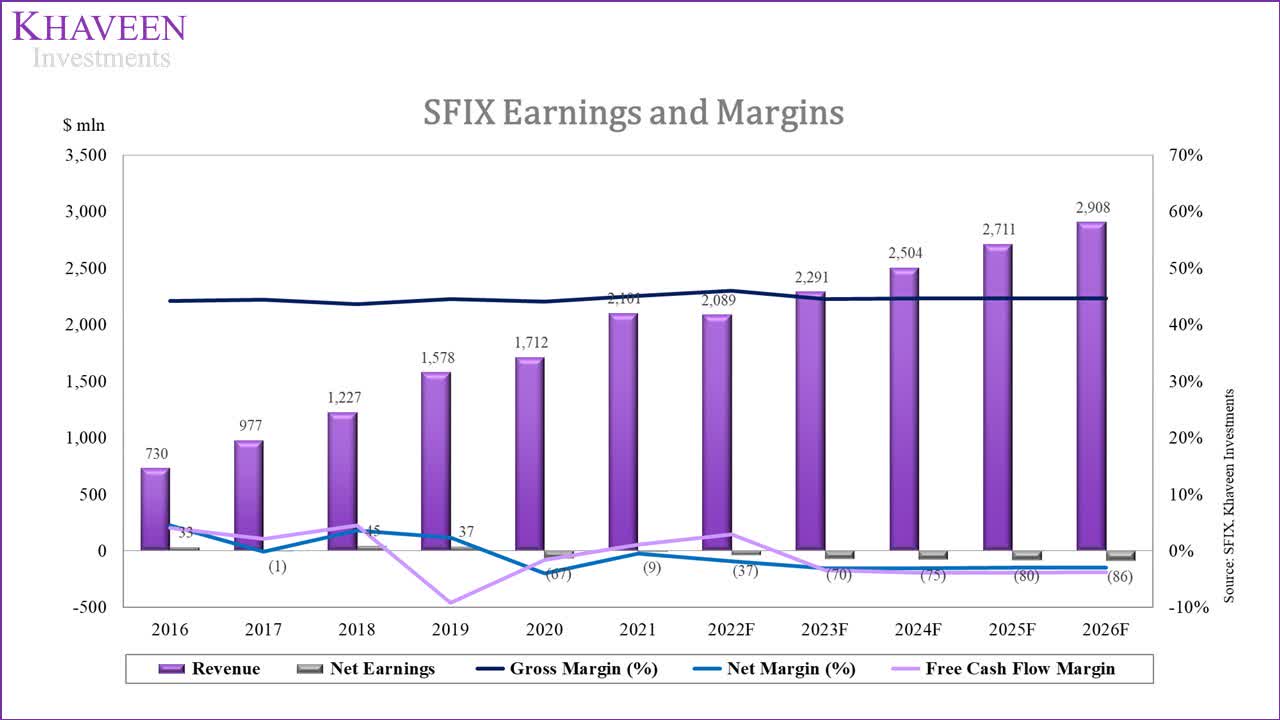
The company’s FCF margins have remained volatile with an average of -0.6%. In 2019 and 2020, the company had investments in marketable and equity securities which contributed to the negative free cash flow.
Stitch Fix, Khaveen Investments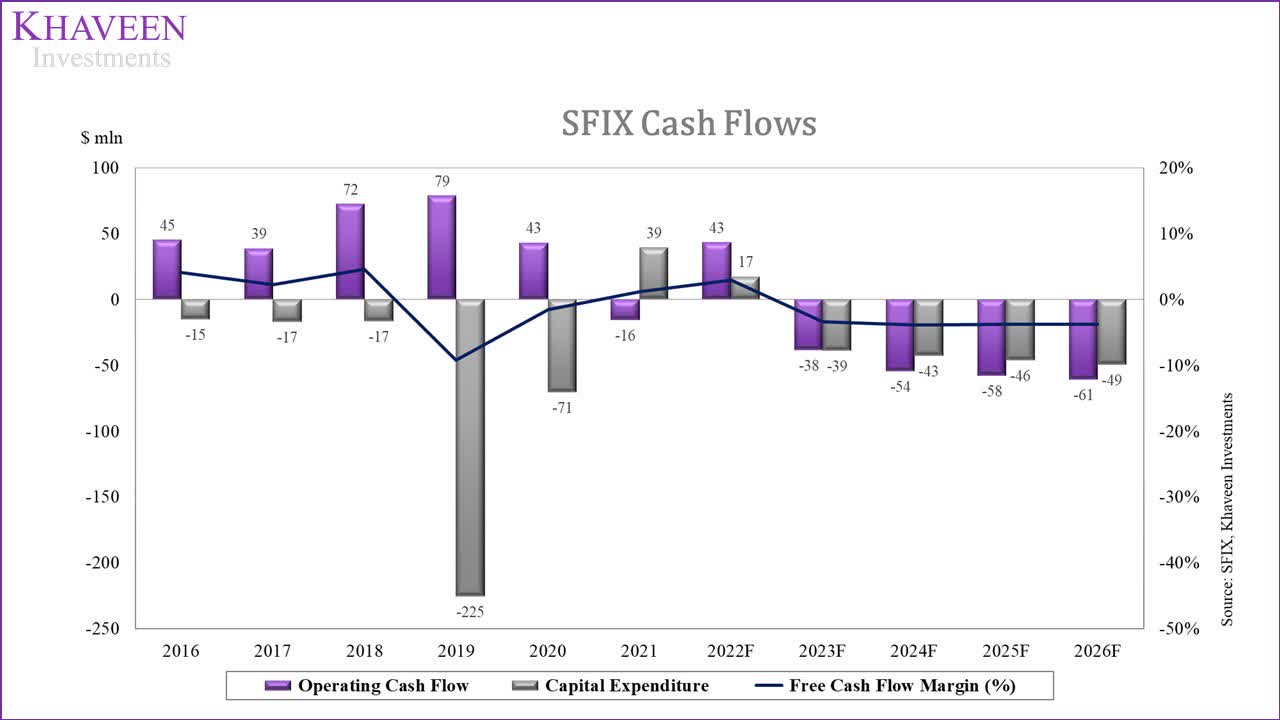
As we expect the company to remain unprofitable in the near future, we used a P/S valuation with an average based on selected fashion e-commerce retailers at an average of 0.51x.
Seeking Alpha, Khaveen Investments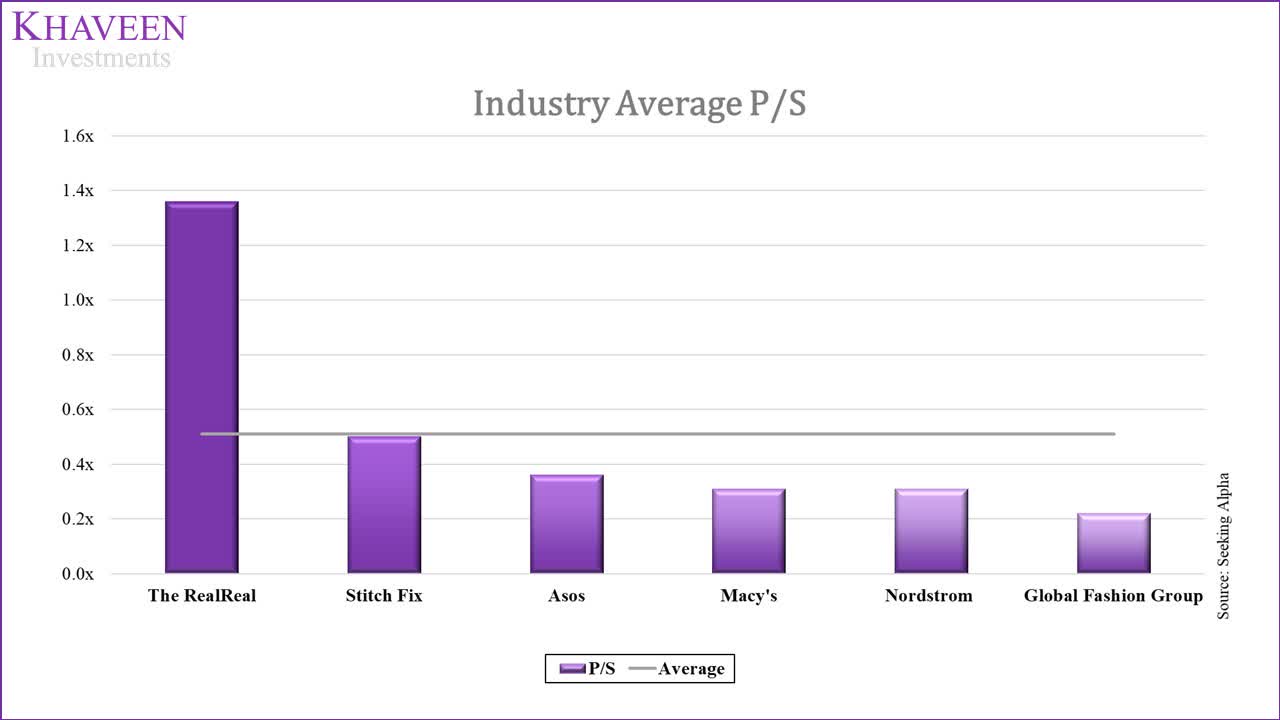
Based on our projections for its active client base and revenue per client in the points above, we derived our forecast for its total revenue through 2024 as shown in the table below.
|
Stitch Fix Revenue Projections |
2017 |
2018 |
2019 |
2020 |
2021 |
2022F |
2023F |
2024F |
|
Active clients (‘mln’) (‘a’) |
2.19 |
2.74 |
3.24 |
3.52 |
4.17 |
4.02 |
4.28 |
4.54 |
|
Growth % |
31% |
25% |
18% |
9% |
18% |
-4% |
6% |
6% |
|
Revenue per client (‘b’) |
445.35 |
447.30 |
487.52 |
486.00 |
504.51 |
519.66 |
535.26 |
551.33 |
|
Growth % |
2% |
0% |
9% |
0% |
4% |
3% |
3% |
3% |
|
Revenue ($ mln) (‘c’) |
977 |
1,227 |
1,578 |
1,712 |
2,101 |
2,089 |
2,291 |
2,504 |
|
Growth % |
33.8% |
25.5% |
28.6% |
8.5% |
22.8% |
-0.6% |
9.7% |
9.3% |
*c = a x b
Source: Stitch Fix, Khaveen Investments
Based on an average P/S ratio of 0.51x for our revenue projection in 2024, we obtained an upside of 22% for the company. Based on our 2024 price target, we derived our 2022 price target of just $10.34.
|
P/S Valuation |
2022F |
2023F |
2024F |
|
Revenue ($ mln) |
2,089 |
2,291 |
2,504 |
|
Growth % |
-0.61% |
9.69% |
9.28% |
|
Industry Average P/S |
0.54x |
0.52x |
0.51x |
|
Valuation ($ mln) |
1,121 |
1,197 |
1,277 |
|
Shares Outstanding (‘mln’) |
108.46 |
108.46 |
108.46 |
|
Target Price |
$10.34 |
$11.03 |
$11.77 |
|
Current Price |
$9.69 |
$9.69 |
$9.69 |
|
Upside |
6.7% |
13.9% |
21.5% |
Source: Khaveen Investments
Verdict
To conclude, Stitch Fix is the market leader in the fashion subscription market with an estimated market share of 69%. However, with the increasing competition from companies such as Amazon and Trunk Club, we projected its client base growth to continue slowing down after growing strongly at a 5-year average of 20%. Moreover, we believe the company’s dependency on client base growth could pose a risk to its revenue growth as we projected its revenue per user growth based on its 5-year average at only 3%. Additionally, we expect the company to remain unprofitable through 2026 with a net margin forecast of -0.4%, weighed down by high SG&A expenses at 48% of total sales. Overall, we rate the company as a Hold with a target price of $10.34.
Be the first to comment