

Torsten Asmus/iStock via Getty Images
Warnings Have Become Reality
In January of 2021, when inflation was 1.4%, we started to warn about the risks of high inflation. At that time, we stated that big money supply policies may lead to a surge in demand and increase the risks of inflation. Our warnings of high inflation became louder and louder through the summer of 2021, as signs of inflation became more and more apparent. Yet, most dismissed these concerns as extreme, while the U.S. Federal Reserve (“the Fed”) dismissed any inflationary pressures as transitory. Here we are now, with inflation running at 7.9% and, at the risk of appearing smug, our warnings have become the reality.
We are now warning that inflation may accelerate even further, based on the events in Ukraine, before eventually falling to a “new normal” inflation rate. This new normal rate of inflation may be significantly higher than the 1.8% average inflation rate realized over the past decade.
As we have suggested, inflation has a tendency to snowball. Roll a snowball down a hill. It starts small, but gets bigger and more destructive, quickly. Once that happens, it becomes very hard to control.
That snowball really is rolling now. Massive coordinated and expansionary monetary and fiscal policies, together with supply chain issues, have caused the largest bout of inflation that many investors have ever experienced. Russia’s invasion of Ukraine only adds to the inflation woes. Corporations are sounding their alarms on inflation. McDonald’s announced that it expects the rate of cost increases for food, paper and other materials in the U.S. to double in 2022 compared to 2021. McDonald’s (MCD) is not alone. According to data from FactSet, as of late 2021, 305 companies in the S&P 500 Index cited “inflation” on earnings calls. This is a new record since this data has been tracked.
Sounding the Alarm: Earnings Calls of S&P 500 Companies Where Inflation Mentioned
Data as of January 2022. Past performance is no guarantee of future results (Bloomberg)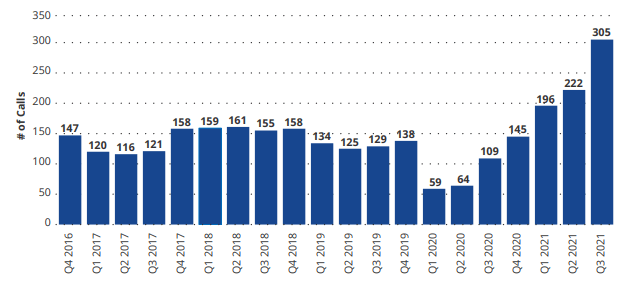
With the current inflation rate of 7.9%, it looks very much like the current bout of inflation now rivals what we experienced in the 1970s. However, unlike in the 1970s, it did not take a decade to get to this point. The inflation rate was 2% in 1965 and then gradually increased and did not reach 7.9% until 1973. This time around, it took one-year to go from 2% to 7.9%.
The Fed and many market observers have been consistently behind the pricing curve. At first, many believed that any inflationary forces would be mild and that we would not have high inflation. Then, the case against inflation pivoted from “high inflation will not occur” to “high inflation is here, but is only temporary”-a significant pivot. Now, based on the overwhelming evidence, Fed Reserve Chairman Jerome Powell stated that it is time to retire the word “transitory.” The only thing that has been transitory thus far on inflation has been the Fed’s, and subsequently the market’s, view on inflation.
It is time to start taking the risk of an extended period of high inflation seriously by adjusting portfolio exposures to include assets that protect against inflation.
The Fed vs. Inflation
Former Fed Chairman Paul Volcker was able to stomp out inflation in 1979 by aggressively raising interest rates. However, at the time, the U.S. debt-to-GDP ratio was around 30%, today it is nearly 140%! The U.S. has been able to keep its soaring debt burden manageable through low interest rates. That will reverse when we pivot into inflation-fighting mode and it will wreak havoc on the economy. A recent study by The Economist estimates that households, companies, financial firms and governments worldwide paid $10.2 trillion in interest in 2021. A 2% increase in rates would increase that interest expense to $20 trillion by 2026 and account for nearly a fifth of global GDP.
The last time that the Fed attempted to “normalize” interest rates was the period from 2015 to 2018. At that time, the Fed had the benefit of raising interest rates at the same time that President Trump was enacting the Tax Cuts and Jobs Act. As you can see in the chart below, short-term interest rates reached a high of 2.5% in 2018 as economic activity, as measured by the ISM Manufacturing Purchasing Managers’ Index, began to fall. The S&P 500 Index experienced a 20% decline and the Fed reacted by reversing course and lowering interest rates.
Rise and Decline: High in Short-Term Rates Coincided with Downturn in Economic Activity
Data as of January 2022. Past performance is no guarantee of future results. ( Bloomberg)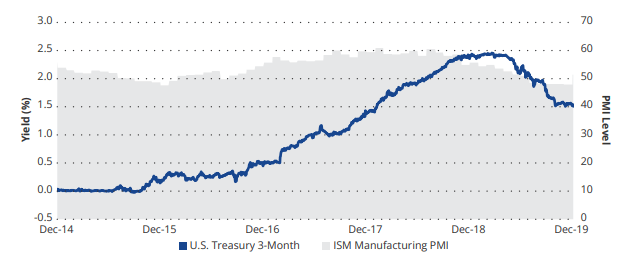
Entrenched Inflation
We believe, based on the tight labor market, that we are in the early stages of a wage-price spiral. The latest Labor Department Job Openings and Labor Turnover Survey, or JOLTS, showed that employers are having trouble luring new workers. 4.3 million Americans left their jobs in January and there are now 11.3 million available positions in the U.S.
Just Starting to Spin: The Wage-Price Spiral in Early Stages
Data as of January 2022. Past performance is no guarantee of future results ( Bureau of Labor Statistics, Bloomberg)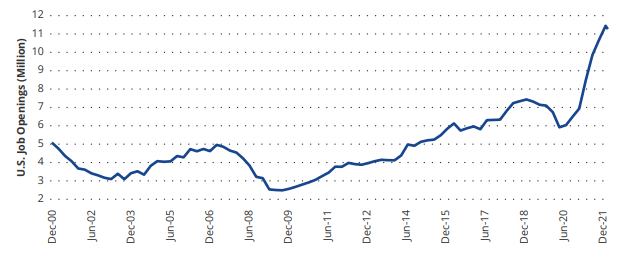
This is the reoccurring and inflation perpetuating cycle of employees demanding higher wages to maintain their standard of living and companies passing these costs to consumers. The charts below show that employment costs (wages + benefits) are rising, yet real wages (after inflation) are falling.
More but Less: Wage Pressures Could Persist Leading to Prolonged Inflation Pressure
Data as of February 2022. Past performance is no guarantee of future results (Bureau of Labor Statistics, Federal Reserve Economic Data (FRED))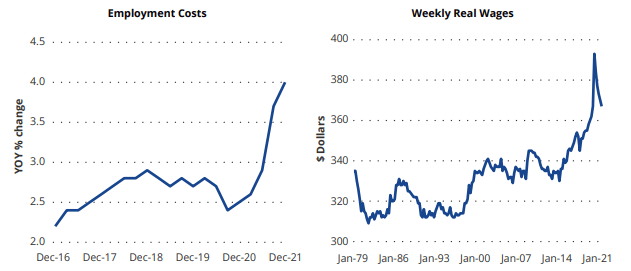
The following chart demonstrates the strong relationship between wages and inflation, especially during periods of high inflation-such as the 1970s, late 1980s and mid-2000s. Correlations are once again spiking and we believe that this trend will last for an extended period of time and continue to put upward pressure on inflation.
Movin’ on Up: Rising Correlation between Wages and Inflation Signals High Regime
Rolling 3-year correlations of the 3-year averages of U.S CPI Urban Consumers to U.S. Unit Labor Costs Non-Farm Business Sector. Data as of January 2022. Past performance is no guarantee of future results (Bloomberg)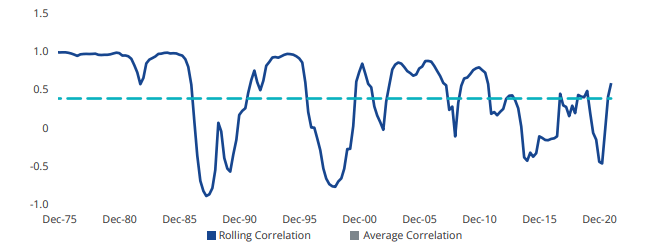
Economist and former U.K. central banker Charles Goodhart, in his 2020 book, “The Great Demographic Reversal,” predicts that the labor shortages will fuel higher inflation for decades as the working-age population shrinks for the first time globally since World War II and nationalist agendas bring back local, more expensive manufacturing.
Demand has surged thanks to the flood of liquidity. However, the supply side continues to be constrained, globally, across many industries, with the prospect of further constraints to come. It can take only one break in a supply chain to completely derail production, imbalance supply and demand and send prices higher. And the chains are breaking. The chart below demonstrates the supply chain pressures. The supply chains will eventually heal, but “eventually” does not resolve the inflation problem of today.
Only As Strong As The Weakest Link: Breaking Supply Chains Add Inflation Pressure
The Global Supply Chain Pressure Index is normalized such that a zero indicates that the index is at its average value with positive values representing how many standard deviations the index is above this average value (and negative values representing the opposite). Data as of February 2022. Past performance is no guarantee of future results (Bloomberg)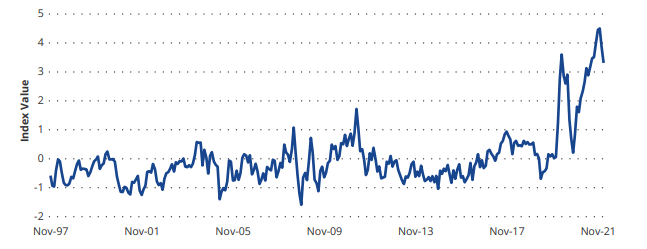
Another notable inflation risk is in the cost of housing. The U.S. underinvested in new housing following the burst of the housing bubble in 2006 and current prices reflect the mismatch of supply and demand. As of December 31, 2021 the S&P CoreLogic Case-Shiller U.S. National Home Price Index, which measures home prices across the U.S., reported a year-over- year gain of 18.56%. The CPI report measures shelter costs based on rents and rent equivalents (estimates). This is key because the January 2022 CPI report has only measured the rise in housing costs to be 4.7% on a year-over-year basis.
Anyone who has looked for shelter lately can tell you that a 4.7% rise in costs from last year just doesn’t pass the “sniff test.” The chart below demonstrates that rental rates typically lag home sales prices by 12-18 months. Shelter is the largest component of the CPI with a weighting of one third and is expected to create a tailwind for future inflation.
Largest and Lagging: U.S. Existing Home Sales Median Price vs. CPI Shelter Component
Data as of January 2022. Past performance is no guarantee of future results (Bureau of Labor Statistics, Bloomberg)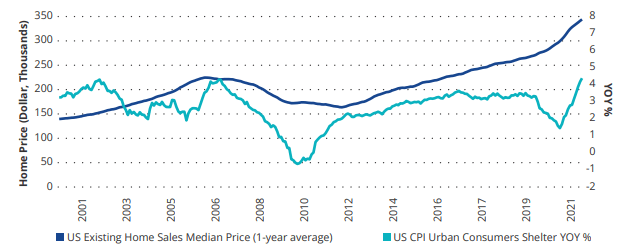
Russia Invades Ukraine
Tragically, on February 24, Russia invaded Ukraine. The loss of life and destruction thus far have been devastating. Here are six points that make the economic consequences particularly dire:
- Wars are inflationary. The chart below demonstrates that, historically, wars have coincided with increases in inflation. The blue line is CPI YoY change and the shaded areas represent major conflicts.
Data as of January 2022. Past performance is no guarantee of future results (Bloomberg)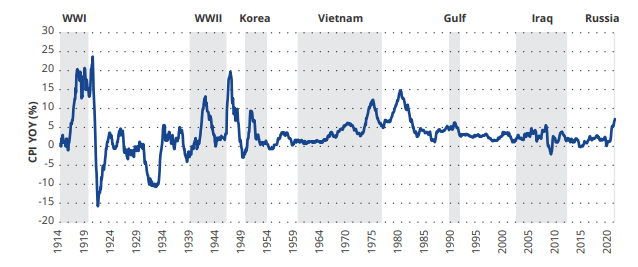
- Russia is a commodity powerhouse. Russia is a top three global supplier of energy, base metals, precious metals, bulk metals, fertilizers and soft commodities. Supply and demand imbalances were significant prior to the invasion and the problem has only worsened.
Data as of January 2022 (Bloomberg, Company Data, Goldman Sachs Global Investment Research, Argus, WoodMac, USDA, USGS)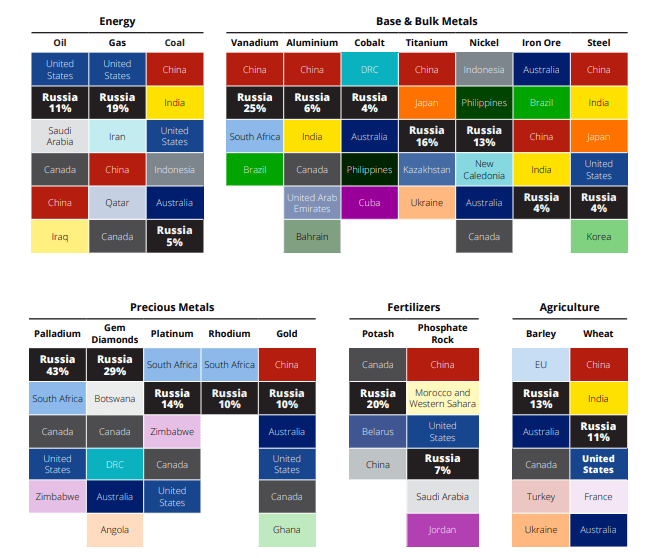
- Surges in oil prices contribute to recessions. The price of oil recently reached nearly $130 per barrel. Historically, there were material surges in oil prices prior to each of the last four recessions, with the exception of 2020, which was an exogenous event. From low to high, the price of oil increased by 167%, 227% and 188% in 1990, 2000 and 2008, respectively.
- Sanctions may be inflationary. The Western world has placed the most severe economic sanctions ever on a major economy. Due to Russia’s significance as a commodity producer, commodity prices are soaring respectively.
- The Fed’s ability to fight inflation has been significantly weakened. Russia is the world’s 11th largest economy and economic shockwaves, from higher commodity costs to supply chain disruptions, will be experienced worldwide.
- The weaponization of the U.S. dollar, through economic sanctions, may have lasting consequences. . Foreign nations, particularly China, may decide that it is not in their best interests to finance U.S. trade and current account deficits if it can be used against them in the future.
Inflation Beneficiaries
For most businesses, inflation erodes profit margins as they contend with rapidly increasing cost pressures. The chart below demonstrates that, for companies in the S&P 500 Index, profit margins peaked in the first quarter of 2021 and have been declining since. This has put downward pressure on stock valuations. We expect this to continue as the impacts of inflation become more apparent over time. Longer duration assets, such as growth stocks, are particularly vulnerable during periods of high inflation because future earnings are discounted more heavily.
Shrinking Margins: Inflation Erodes Earnings
Data as of January 2022. Past performance is no guarantee of future results (Bloomberg)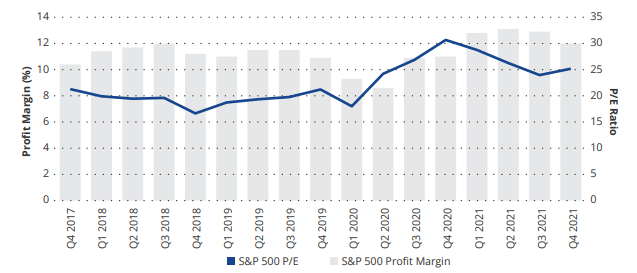
Typically, during high inflation, real assets, and the companies that benefit from higher real assets prices, outperform. During the inflation shock of the 1970s, gold and commodities significantly outperformed. Gold prices are de-linked from the inflationary pressures of fiat currencies and commodity prices respond quickly to changes in supply and demand.
Average 12-month real return when CPI is at or above certain levels (1969-1981)
Past performance is no guarantee of future results. Data as of December 1981 (Bloomberg)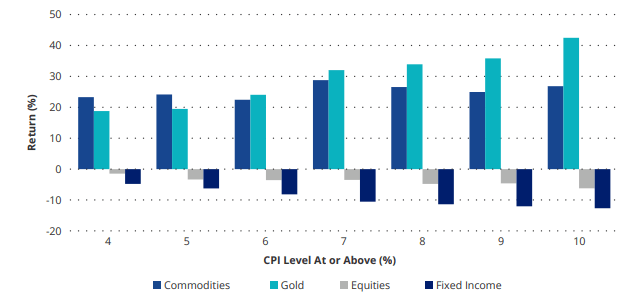
With the explosion in indexation over the past 20 years, we are able to expand our analysis to include a universe of real assets broader than just gold and commodities. Below are the real returns of assets, based on CPI levels, during the inflationary period of the 2000s. Natural resource equities outperformed the underlying commodities. Infrastructure and real estate companies also provided strong inflation protection because of their ability to “pass through” inflation to consumers.
Average 12-month real return when CPI is at or above certain levels (2003-2007)
Past performance is no guarantee of future results. Data as of December 2007. (Bloomberg)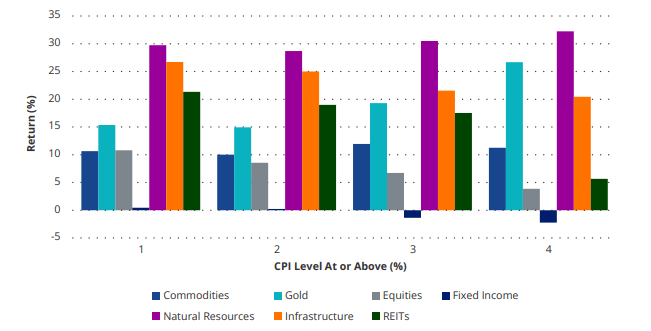
Gold: The “Second Half” Team
Commodity and gold prices rose together during the first halves of the high inflation regimes of both the 1970s and mid- 2000s. Commodity prices responded to the changing supply and demand dynamics, while gold responded to investors seeking a store of value asset.
Past performance is no guarantee of future results. Data as of December 1976 (top), November 2005 (bottom) (Bloomberg)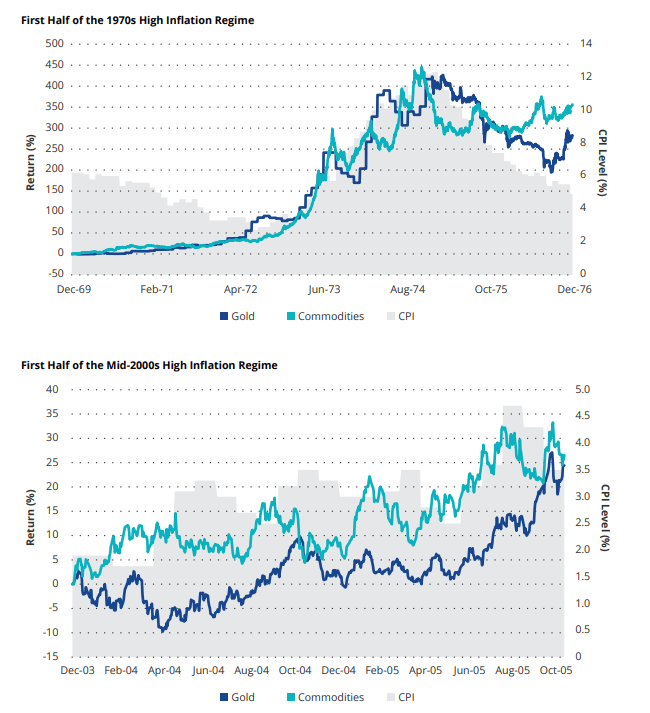
However, as concerns over inflation intensified in the second halves of these high inflation cycles, gold prices soared and outperformed commodities. The chart below demonstrates that gold was the clear winner in the second half of each high inflation regime.
Past performance is no guarantee of future results. Data as of December 1980 (top), December 2007 (bottom). (Bloomberg)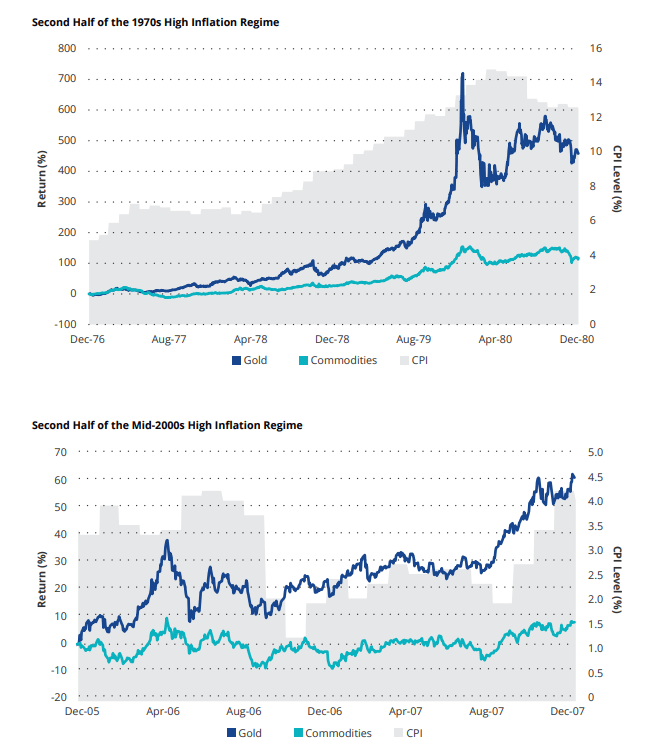
Inflation & Asset Prices Today
Commodities and other real assets have massively underperformed the stock market since the global financial crisis. Since the market bottom, in March 2009, the S&P 500 Index has returned a gain of nearly 700% versus a gain of 35% for the Bloomberg Commodity Index!
Commodity prices have finally awoken from their decade plus hibernation and are leading the markets higher. This lost period in commodities has created a situation where, relative to stocks, the prices of commodities and natural resource equities may still be cheap and have a lot more room to run.
Sizing a Portfolio Allocation for Inflation Protection
It has already been established that real assets protect against high inflation. The question now is, how much of a portfolio should be allocated to real assets in order to sustain purchasing power in a period of high inflation? Going back approximately 50 years, the average annualized real return (adjusting for inflation) of a 60/40 portfolio has been 6%.
However, the average annualized real return for a 60/40 portfolio during the high inflation periods of the 1970s and mid- 2000s was just 0.55%. For those same periods, the average annualized return for an inflation protection portfolio (set at 50% commodities and 50% gold – based on data availability and for the sake of simplicity) was 15.97%.
The chart below demonstrates the allocation targets per real return hurdle. This demonstrates that, during periods of high inflation, an allocation of 15% to an inflation protection portfolio is needed to achieve a reasonable real return, which we have defined as 3%. A more diversified inflation protection portfolio, which may include natural resource equities, infrastructure, REITs (and possibly even bitcoin), would likely provide even better results.
Allocation Targets Per Real Return Hurdle
Past performance is no guarantee of future result. Based on historical data of inflation periods of 1970s and 2000s (Bloomberg)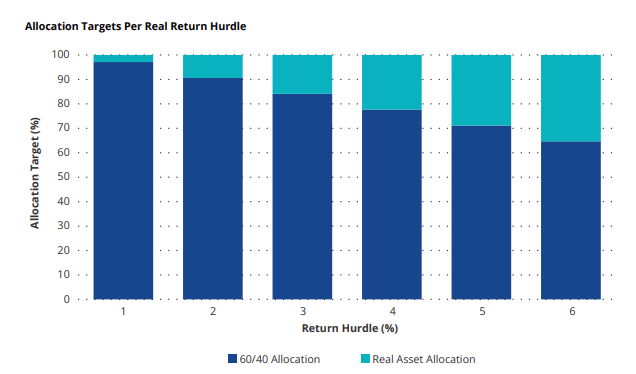
Conclusion
The inflation snowball really is rolling now. Inflation is proving to be higher and far stickier than most expected. The conflict between Russia and Ukraine only magnifies the issues.
Do not just hope that inflation will be temporary-protect your portfolio! We believe that, during a period of high inflation, an allocation of 15% to a diversified portfolio of real assets is needed to keep the portfolio generating the returns required of it.
Author
Disclosures
Please note that VanEck may offer investments products that invest in the asset class(es) or industries included in this commentary.
This is not an offer to buy or sell, or a recommendation to buy or sell any of the securities/financial instruments mentioned herein. The information presented does not involve the rendering of personalized investment, financial, legal, or tax advice. Certain statements contained herein may constitute projections, forecasts and other forward looking statements, which do not reflect actual results, are valid as of the date of this communication and subject to change without notice. Information provided by third party sources are believed to be reliable and have not been independently verified for accuracy or completeness and cannot be guaranteed. VanEck does not guarantee the accuracy of third party data. The information herein represents the opinion of the author(s), but not necessarily those of VanEck.
Investing in cryptocurrencies comes with a number of risks, including volatile market price swings or flash crashes, market manipulation, and cybersecurity risks. In addition, cryptocurrency markets and exchanges are not regulated with the same controls or customer protections available in equity, option, futures, or foreign exchange investing. There is no assurance that a person who accepts a cryptocurrency as payment today will continue to do so in the future.
VanEck Inflation Allocation ETF: An investment in the Fund may be subject to risks which include, among others, in fund of funds risk which may subject the Fund to investing in commodities, gold, natural resources companies, MLPs, real estate sector, infrastructure, equities securities, small- and medium-capitalization companies, foreign securities, emerging market issuers, foreign currency, credit, interest rate, call and concentration risks, derivatives, cryptocurrency, cryptocurrency tax, all of which may adversely affect the Fund. The Fund may also be subject to affiliated fund, U.S. Treasury Bills, subsidiary investment, commodity regulatory (with respect
to investments in the Subsidiary), tax (with respect to investments in the Subsidiary), risks of ETPs, liquidity, gap, cash transactions, high portfolio turnover, model and data, management, operational, authorized participant concentration, no guarantee of active trading market, trading issues, market, fund shares trading, premium/ discount and liquidity of fund shares, and non-diversified risks. Foreign investments are subject to risks, which include changes in economic and political conditions, foreign currency fluctuations, changes in foreign regulations, and changes in currency exchange rates which may negatively impact the Fund’s returns. Small- and medium-capitalization companies may be subject to elevated risks
Investing involves substantial risk and high volatility, including possible loss of principal. An investor should consider the investment objective, risks, charges and expenses of a Fund carefully before investing. To obtain a prospectus and summary prospectus, which contain this and other information, call 800.826.2333 or visit vaneck/etf.com. Please read the prospectus and summary prospectus carefully before investing.
Editor’s Note: The summary bullets for this article were chosen by Seeking Alpha editors.
Be the first to comment