

Tramino/iStock Unreleased via Getty Images
Introduction
My thesis is that Stellantis (NYSE:STLA) is using North American cash flows in order to fund the electrification push in Europe. At the March 2022 Dare Forward 2030 presentation, CEO Carlos Tavares said they are setting the course to have 100% battery electric vehicle (“BEV”) sales in Europe by 2030. Much of this will be paid for by North American cash flows from sales of internal combustion engine (“ICE”) vehicles but even U.S. sales should be half BEV by 2030. The reason North American ICE cash flows are paying for much of the future BEV investments is that BEV sales are not yet attractive for Stellantis without government subsidies. Cash needs to be invested in the form of capex and R&D in order to get to the point where BEVs sales are attractive for Stellantis on their own merit without subsidies.
Looking at the sales overview by region in the 2021 annual report, approximately 32% or 2 million of the worldwide 6.3 million vehicle sales excluding Maserati came from North America:
Sales Overview (2021 annual report)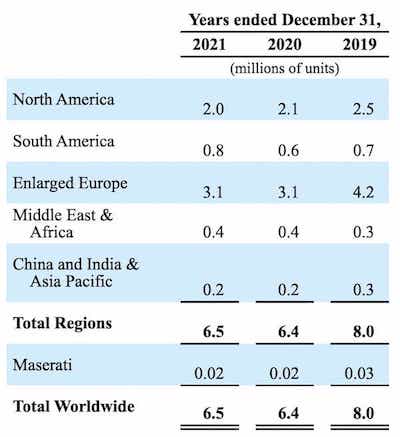
€11,356 million or 63% of the total €18,011 million adjusted operating income for 2021 came from North America. This is remarkable given what we saw above with respect to sales by region. In other words, almost 2/3rds of the 2021 adjusted operating income came from North America despite the fact that the region had less than 1/3rd of the unit sales.
We see the many iconic brands in the March 2022 Dare Forward 2030 presentation:
Stellantis brands (Dare Forward 2030 presentation)
BEV Progress
CEO Tavares talked about the need for BEV engineering investments in the 4Q20 call, saying BEVs are the focus over plug-in hybrid electric vehicles (“PHEVs”) and mild-hybrid electric vehicles (“mHEVs”):
The battle will be within the 3 to 4 years on to which extent did we remove the range anxiety factor from the BEV world, to which extent are we able to make that affordable in an attractive packaging inside of a car. So in a nutshell, the message I would like to convey to you is that we are full throttle on the BEV. That’s where we are. We are not thinking that we still have the PHEV or the mHEV. No, no. We just believe that is going to disappear because there will be a ban on ICEs.
The platform talk of 500 miles at the July 2021 EV Day was exciting:
500 mile platforms (July 2021 EV Day)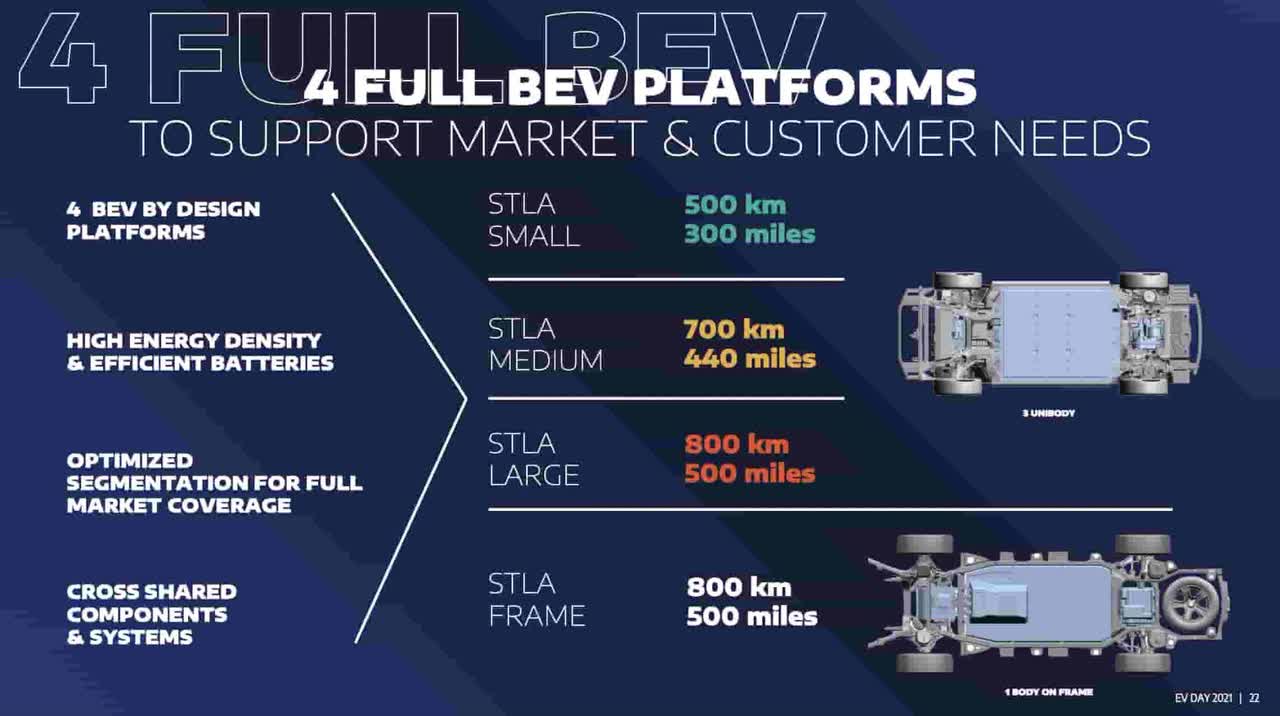
At the December 2021 Software Day, it was mentioned that revenue is expected to double to €300 billion by 2030 and that incremental costs related to electrification will be incurred for years as the shift is made. CEO Tavares talked about these cost shifts for BEVs:
We consider that for the industry to be able to digest the 50% additional cost of a BEV against the conventional vehicle, we need around 5 to 6 years, which means that we also assume that through the next 5 to 6 years, there will be some kind of support from the states as they are ramping up on their infrastructure investments for the charging units as an example. So we consider that there is a transition period over the next 5 years, where we need to do an important job in terms of productivity. And while we are doing this job on productivity and the volumes are scaling up, the governments need to continue to support, and we understand that they will reduce progressively their support because they cannot afford it. And the citizens will have to pay more taxes if they keep on doing it too much. So it’s a transient mode for the next 5 years where we need to digest the additional cost of electrification, including through additional volumes, while there is – there will be a progressive decrease of subsidies from the government.
The March 2022 Dare Forward 2030 presentation shows that Stellantis aims to sell a million BEVs per year by 2024:
BEV portfolio (Dare Forward 2030 presentation)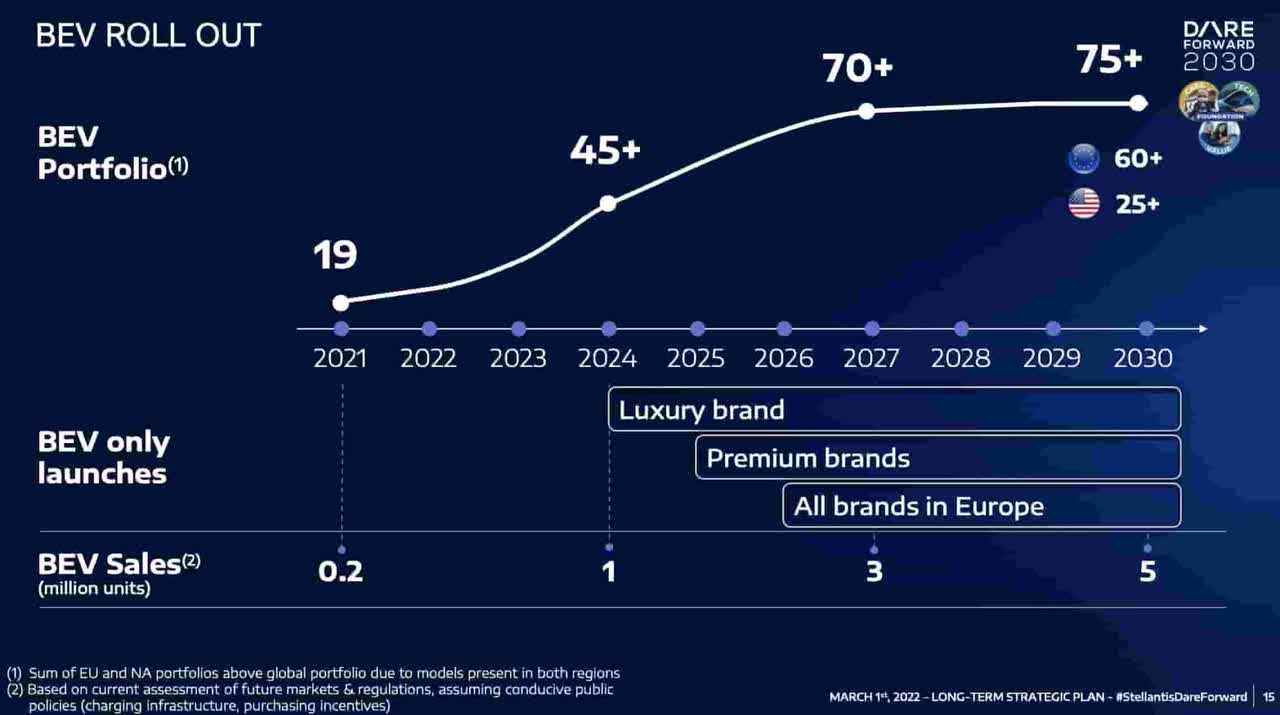
Per the 1H22 presentation, global BEV sales for 1H22 were 136 thousand units – up 50% year-over-year from 91 thousand in 1H21:
BEV sales (1H22 presentation)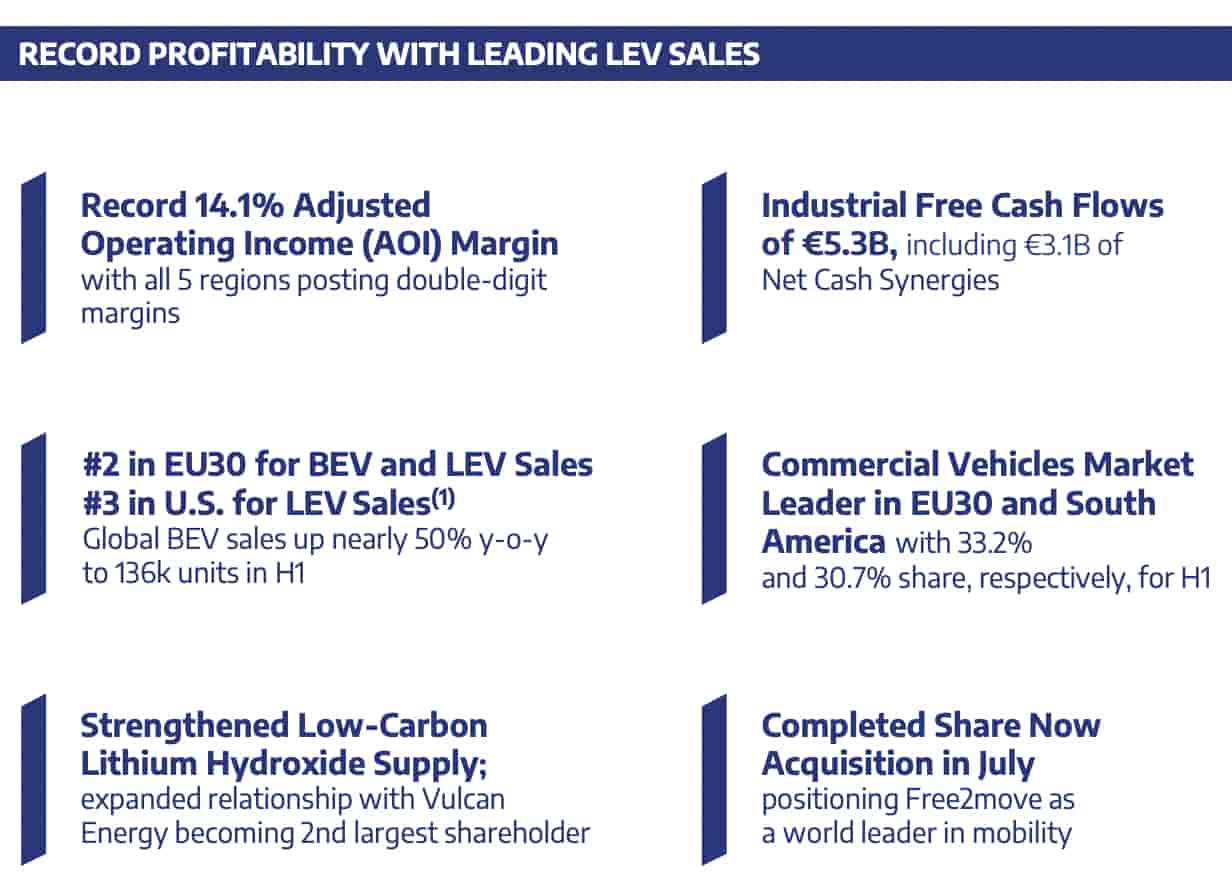
It is nice that BEV sales grew more than PHEV sales from 1H21 to 1H22. In 1H21, the low emission vehicle (“LEV”) sales were about 50-50 between BEV and PHEV but in 1H22, they were 55% BEV and 45% PHEV. At the July 2021 EV Day, CEO Tavares said the global LEV mix should be at least 80% BEV and no more than 20% PHEV by 2030:
BEV increases (1H22 presentation)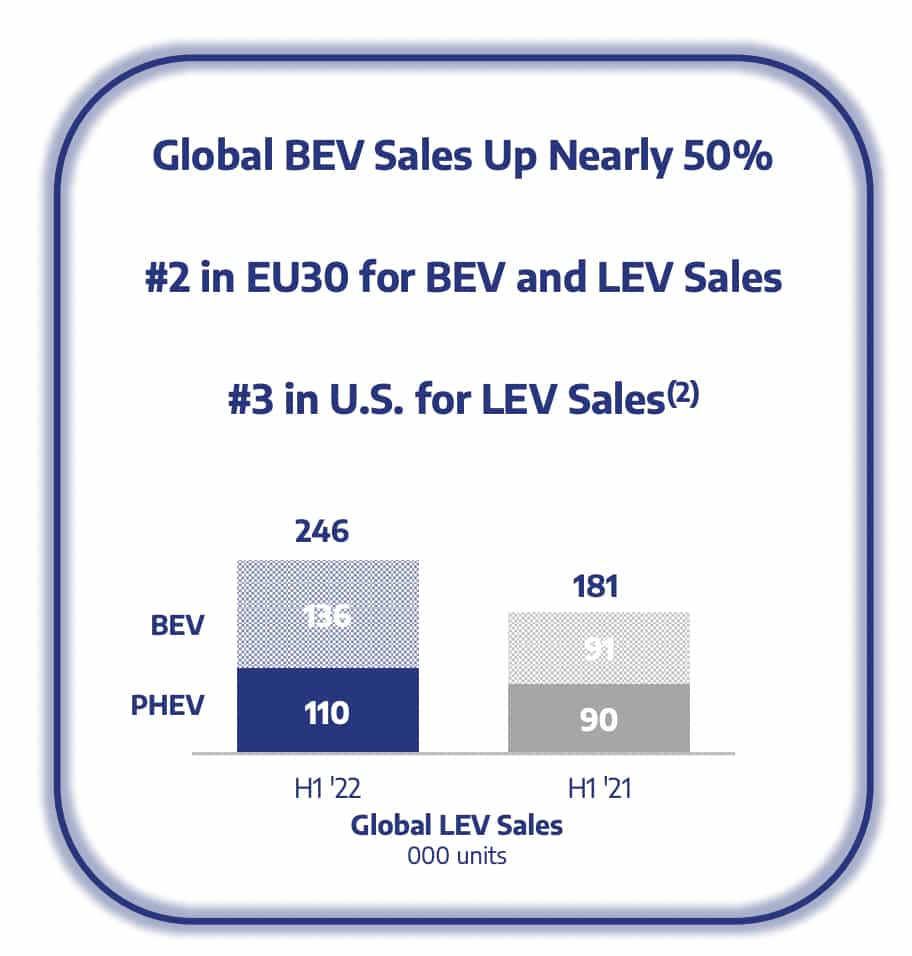
The 136 thousand unit sales above for the first half of 2022 aren’t far behind Hyundai/Kia registrations; we are also seeing good registration numbers from Geely-Volvo (OTCPK:GELYF) per InsideEVs:
BEV landscape (InsideEVs)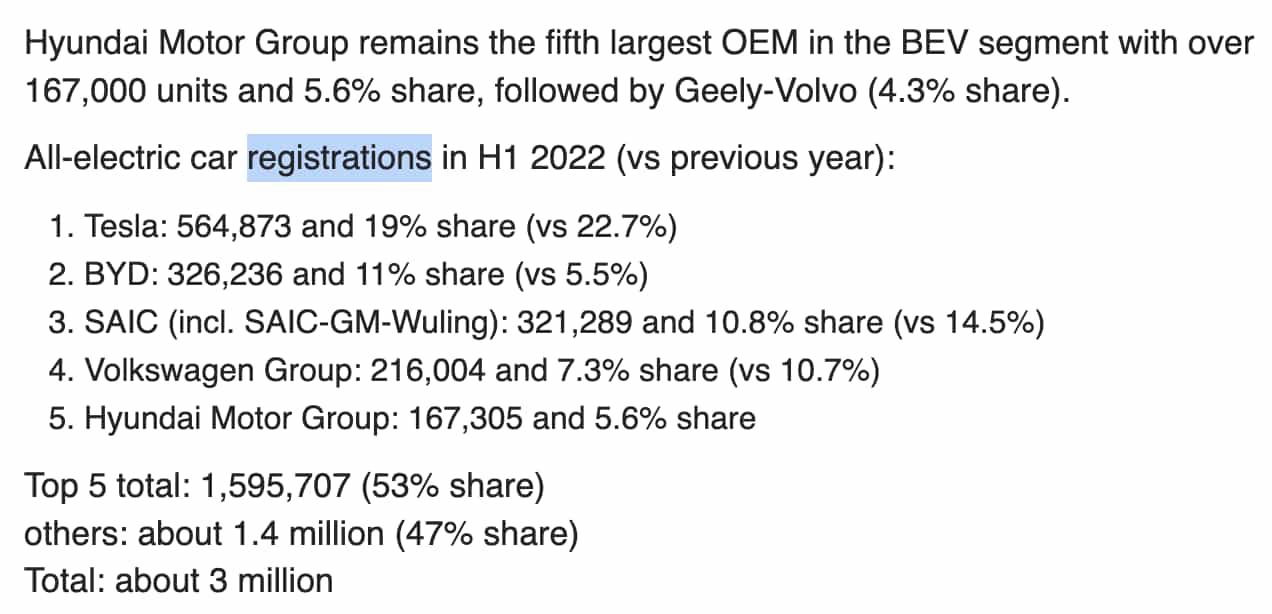
CEO Tavares discussed the BEV progress in Europe during the 2Q22 call:
The 50% BEV sales growth rate is demonstrating that our electrification strategy is working. As the example of Europe is showing, we are now breathing in the neck of our most respected competitors. We are head on fighting for the top spot in terms of BEV sales in the European market, demonstrating that our products are competitive, that our technology is well appreciated by our customers. So we are in the leading pack of the European market, and our BEV sales demonstrate a much better market share than the total market share of the company.
Valuation
Looking at the 2020 pro forma income statement, Peugeot S.A. (“PSA”) had operating income of €3,010 million on revenue of €47,656 million. Fiat Chrysler Automobiles (“FCA”) had operating income of €2,165 million on revenue of €86,676 million. The 2021 income statement shows that total operating income swelled to €15,299 million on revenue of €152,119 million. We need to figure out what components of the 2021 improvements over 2020 are sustainable for our long term valuation framework. It was helpful that pro forma revenue climbed 13.6% while the cost of revenues only went up 8.9%. SG&A actually went down by almost 1%! R&D on the income statement was flat between 2000 and 2021. North America was responsible for most of the adjusted operating income (“AOI”) jump from 2020 to 2021:
Adjusted operating income (2021 annual report)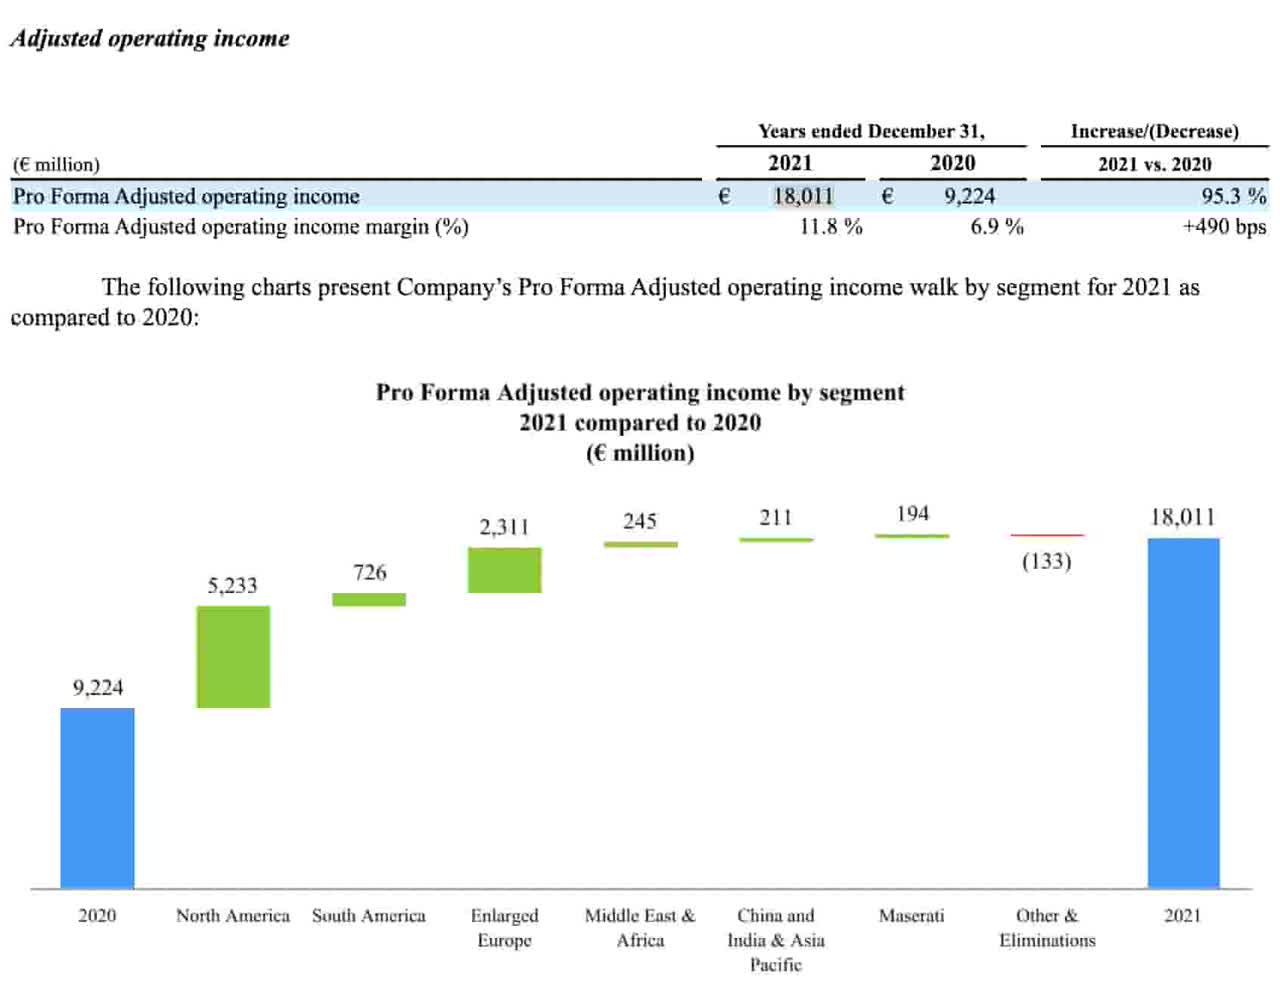
Here are the adjusted operating income and revenue numbers by segment for 2021. North America was responsible for €11.4 billion of the total €18 billion adjusted operating income:
Segments (2021 annual report)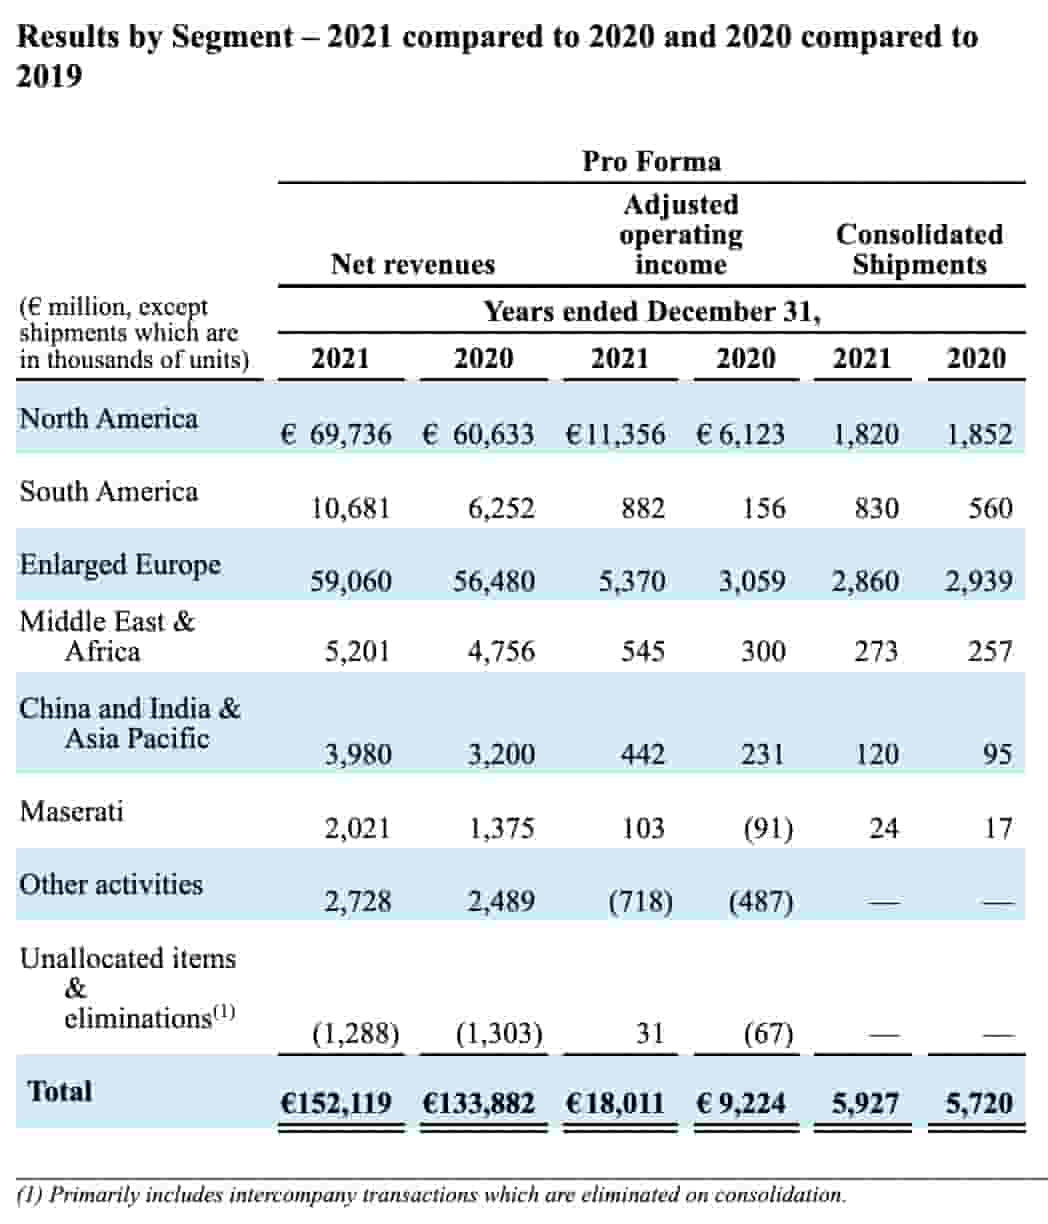
We continued to see strength from North America and the entire company from pro forma 1H21 to 1H22 with respect to adjusted operating income and revenue. Shipments decreased substantially in enlarged Europe but they increased in North America where the adjusted operating margin is better:
1H22 segments (1H22 report)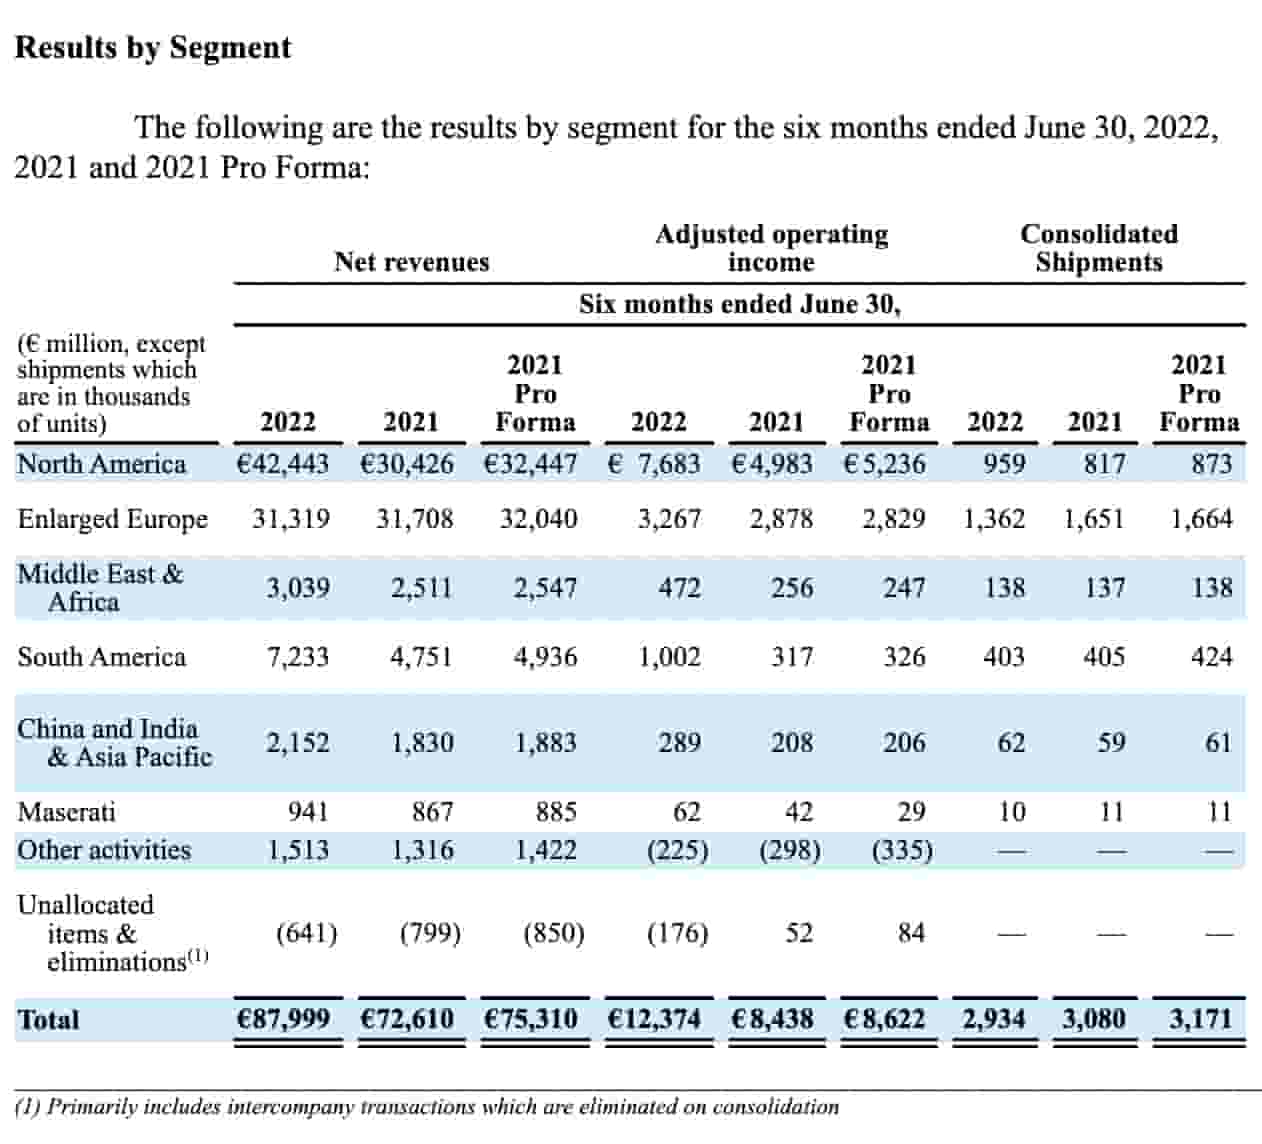
Right now Stellantis has an adjusted operating income margin of more than 18% in North America but there are questions as to its sustainability in the future. A question was asked about this in the 2Q22 call and the answer by CEO Tavares didn’t reveal much to me about future prospects. The automobile business is cyclical; interest rates and fuel prices have been going up and customers are highly sensitive to these considerations. This part of the 2021 annual report stood out to me:
As is typical in the automotive industry, Stellantis’ vehicle sales are highly sensitive to general economic conditions, availability of low interest rate vehicle financing for dealers and retail customers and other external factors, including fuel prices, and as a result could vary substantially from quarter to quarter and year to year. Retail consumers tend to delay the purchase of a new vehicle when disposable income and consumer confidence is low. Moreover, increases in inflation may lead to subsequent increases in the cost of borrowing and availability of affordable credit for vehicle financing, which may further influence retail consumers to delay the purchase of a new vehicle.
A company is worth the amount of cash that can be pulled out of it from now until judgment day. Adjusted operating income is noteworthy but industrial free cash flows are more important. We look at industrial free cash flows as opposed to overall FCF because it doesn’t make sense to look at financial services FCF. Management is hopeful that industrial free cash flows will be more than €12 billion in 2027 and more than €20 billion in 2030. However, little is known about prospects until that time. They were €6.1 billion for 2021 but the nebulous guidance I’ve seen for 2022 merely says they are expected to be positive. There are working capital considerations that will make the numbers take a hit such that in 2024, they could be as little as €6 billion despite the fact that revenues at that time are expected to be higher than today’s levels:
2030 financials (Dare Forward 2030 presentation)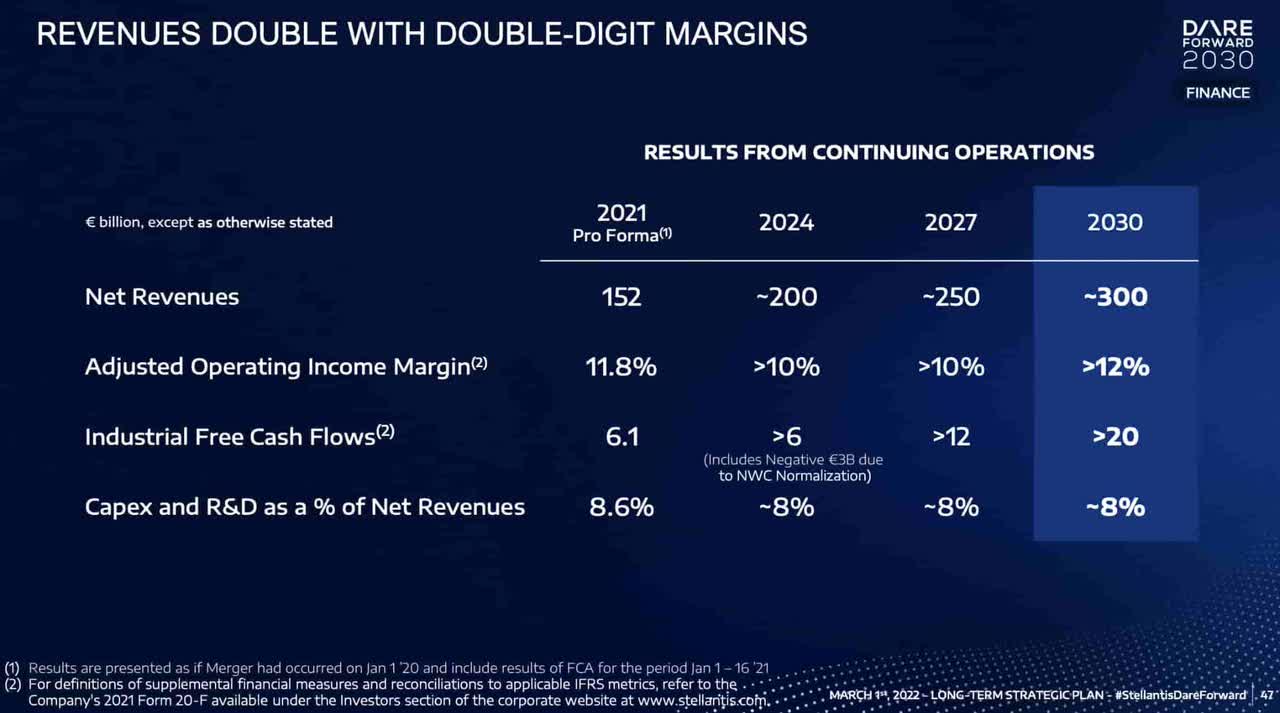
Given the many uncertainties ahead and the volatility of Industrial free cash flows from year to year, my valuation range is only 7 to 8 times the 2021 industrial free cash flows – roughly €43 to €49 billion.
The 1H22 report shows a weighted average share count of 3,228,051,000 for their diluted EPS calculations. Multiplying this by the October 12th share price of $11.77 gives us a market cap of $38 billion.
Per GuruFocus, the enterprise value is about €17,787 million less than the market cap due to the 2Q22 balance sheet considerations below:
€20,229 million long-term debt
€7,935 million short-term debt
€404 million non-controlling interests
€(46,355) million cash and equivalents
————————
€(17,787) million
One of the problems of the GuruFocus approach for the enterprise value above is that financial services balance sheet considerations are mixed with industrial services considerations and they are apples and oranges. In other words, the €20,229 million long-term debt plus the €7,935 million short-term debt comes to €28,164 million but only €25,850 million of this is from industrial activities while €2,314 million of it is from financial services. We have the same type of problem on the cash side; the €46,355 million cash is composed of €45,278 million from industrial activities and €1,077 million from financial services:
Industrial net financial position (1H22 report)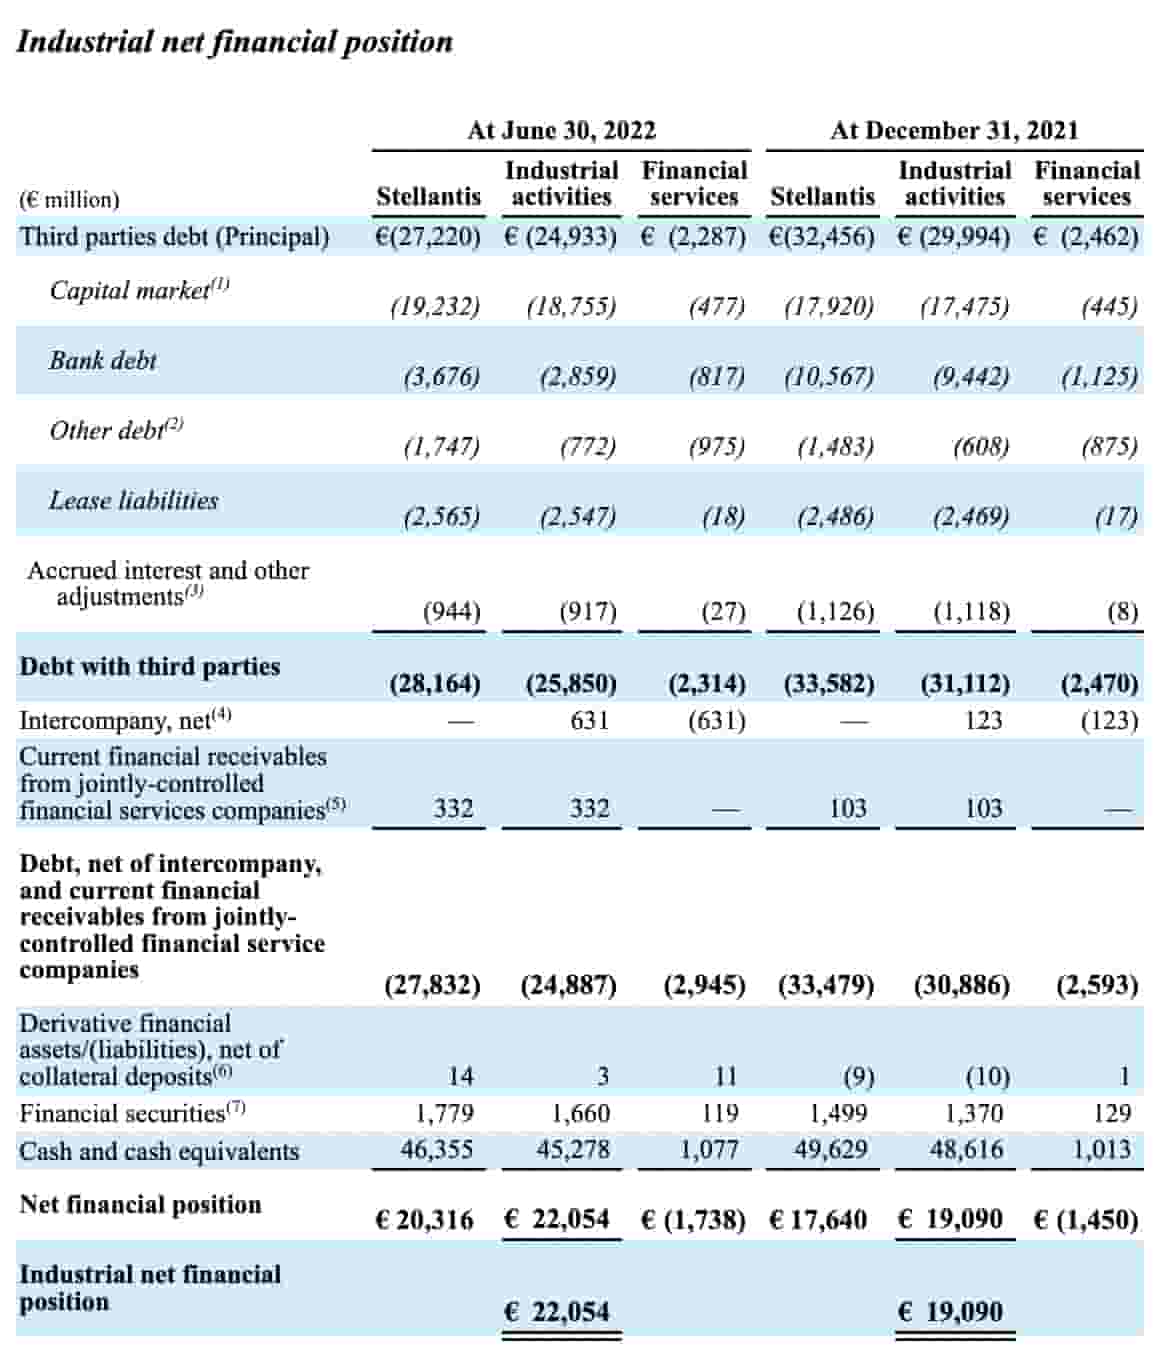
Given these considerations, I think it makes more sense from an enterprise value standpoint to use the positive industrial balance sheet figure above of €22,054 million which is partially offset by the negative €404 million non-controlling interests; these figures are less confusing to me with respect to enterprise value than the numbers where industrial and financial services are combined.
I like to include net post retirement liabilities in the enterprise value per this footnotes analyst statement:
The principle of enterprise value is to remove the effects of different financing policies from valuation metrics, thereby improving comparability and relevance in equity analysis. Only by including pension liabilities in EV can this be achieved.
This means I lower the enterprise value by €7,038 million from net long-term employee benefits liabilities and by €623 million from net short-term employee benefits liabilities.
There are other parts of the balance sheet like the trade receivables that give me pause; I can’t say with confidence that GuruFocus is correct about the enterprise value being significantly less than the market cap.
The market cap is lower than my valuation range, so I think STLA stock is undervalued.
Be the first to comment