


ktsimage/iStock via Getty Images
One of our favorite recent Wave Setups is PayPal Holdings (NASDAQ:PYPL). PYPL is also a recent favorite of Lyn Alden’s and she has shared some thoughts on its bullish Fundamentals in our Stock Waves services. Her March 24 “Where Fundamentals Meet Technicals” can be found here. And below is the FAST graph from that article.
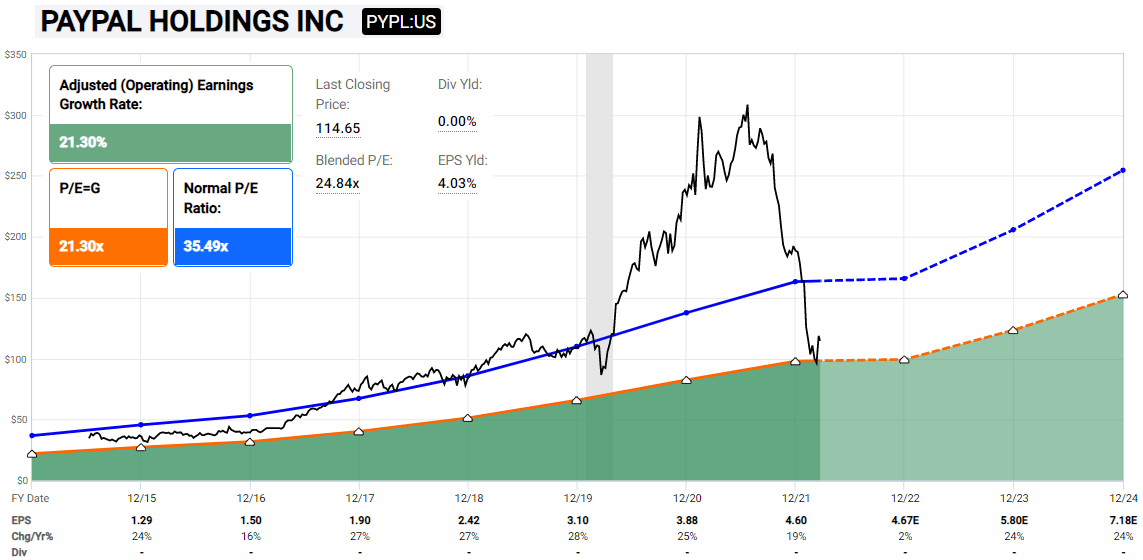
Lyn’s FAST graph on PYPL (Lyn/FAST)
PYPL has a very convincing looking five wave structure to the upside off of the March low, followed by a nice, corrective 3-wave flat off of the high that was made near the end of March. In this case, price is testing just the upper end of standard retracement support so far, the .382 retrace at 110.09. If price does need to reach a little bit deeper, there’s room for it with the .500 retrace at 106.44 as the next support, followed by the .618 at 102.91. If electing for a tighter stop, place it below the .786 retrace at 98.08. Otherwise, to give the setup more room up to full invalidation, place the stop below the March low. If a 1-2 off of the March low, the rough estimated target for wave 3 is in the upper 150 to upper 160 region. Even if just filling out a measured move c-wave, that should take price up to at least 140.
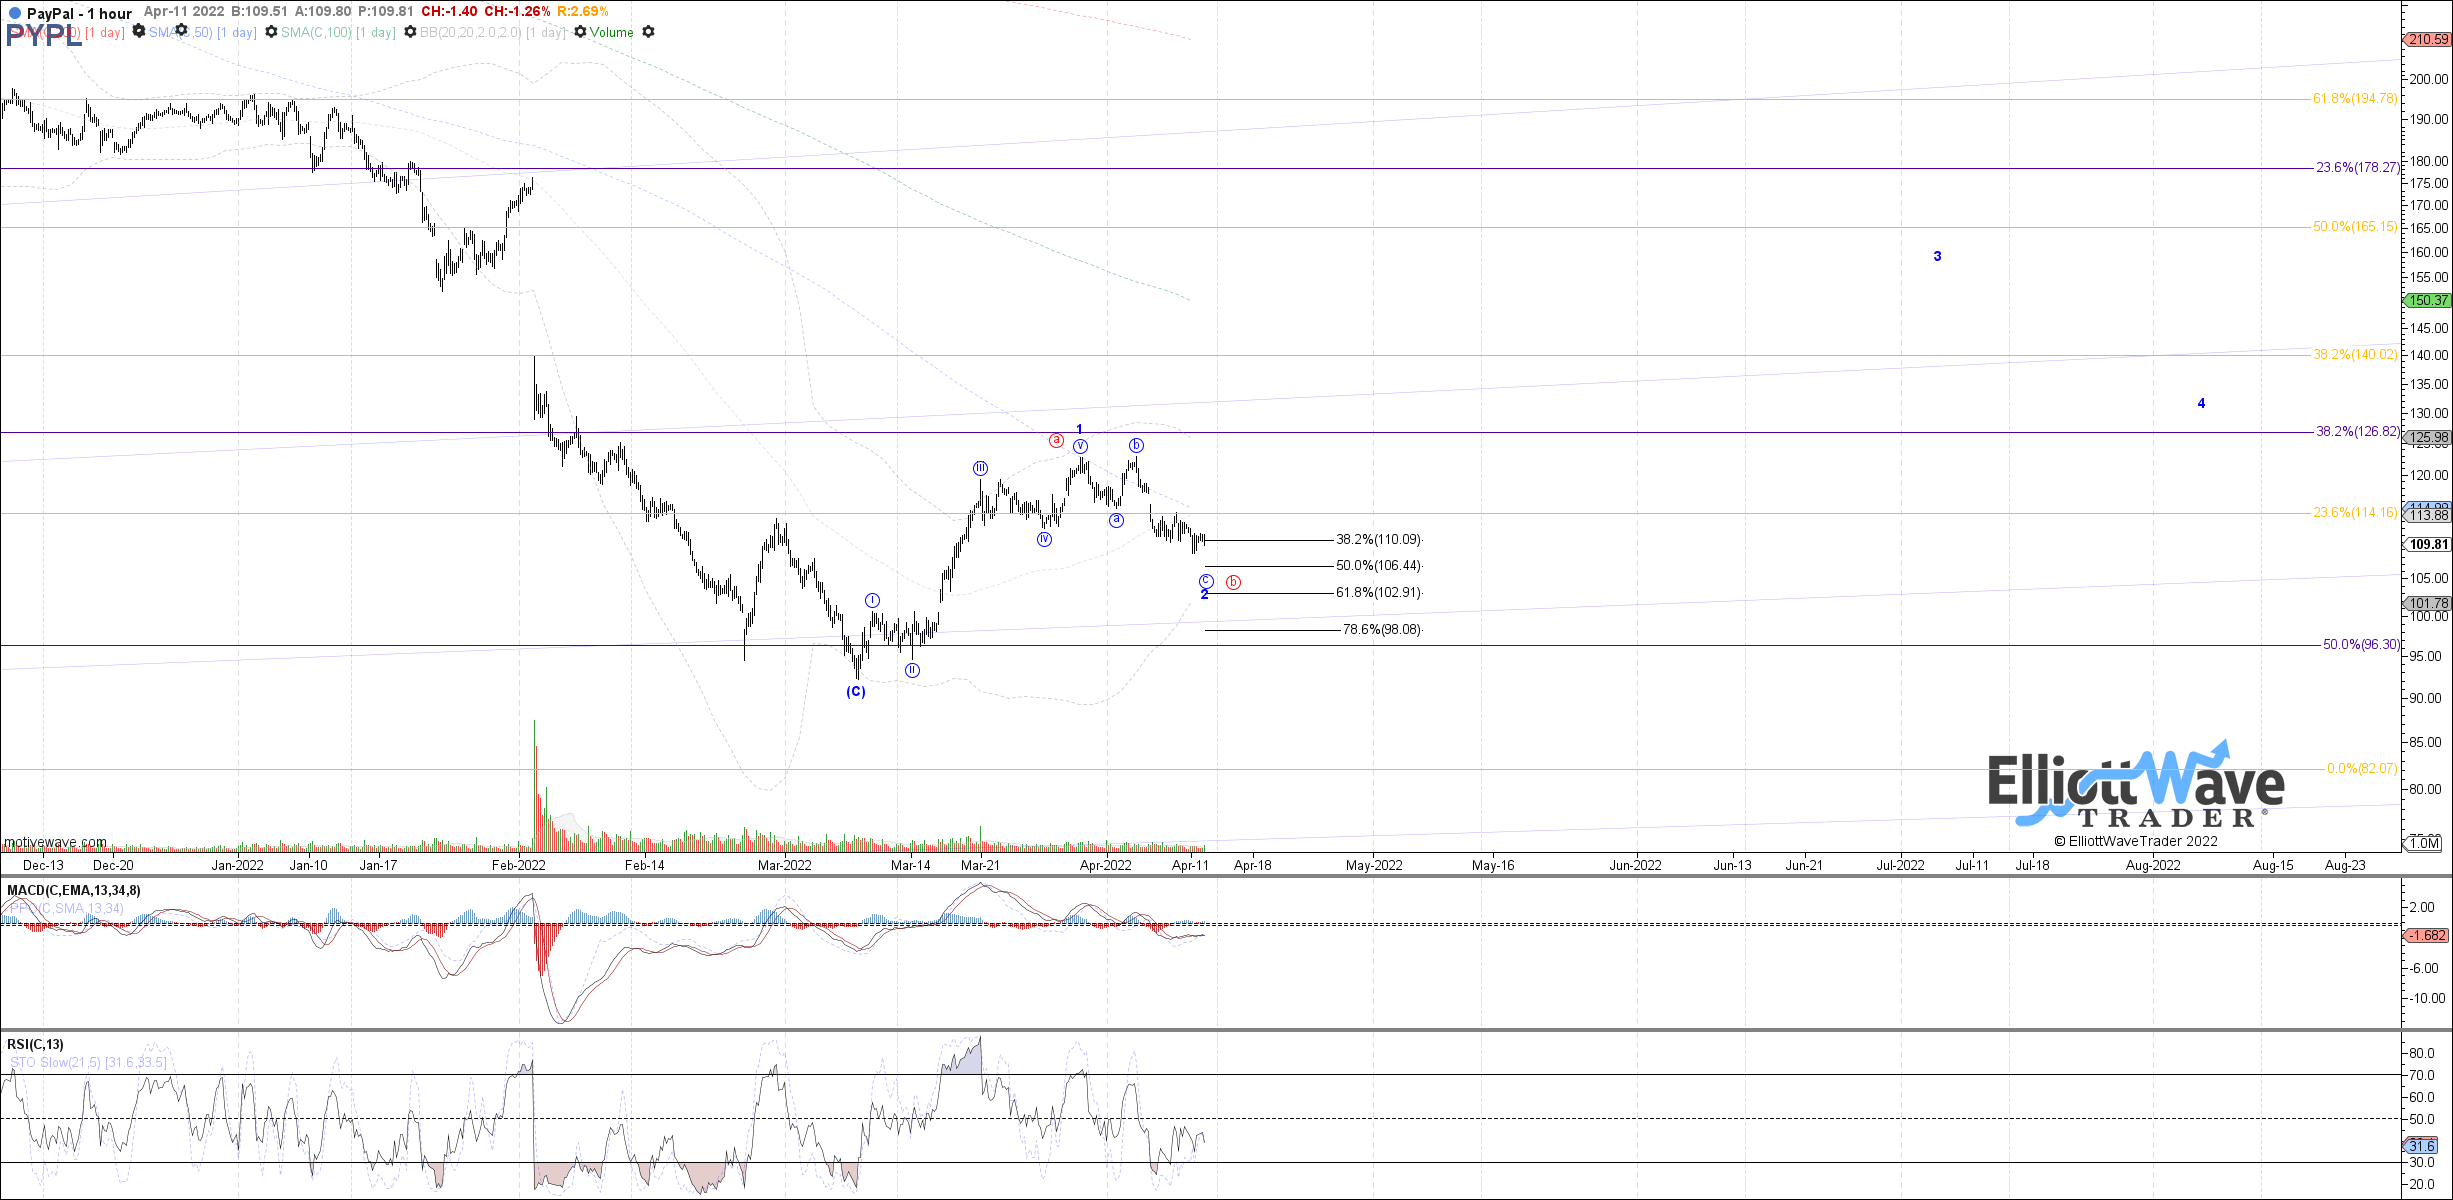
PYPL 4-11-22 1hr (EWT)
Emergent BioSolutions Inc (EBS) was part of the Stock Waves webinar that we did two weeks ago covering biotech companies. It looks like a decent setup for a measured move c-wave to the upside off of the March low, targeting 63.34. There is a (i)-(ii) start to the c-wave developing, with room to reach a little bit lower in wave (ii). Price is currently testing the top end of standard retracement support, the .382 retrace at 41.49. If price does need to stretch a little bit deeper, the .500 retrace at 40.42 and then the .618 retrace at 39.38 are the next support levels to watch. If you prefer tighter stop, place it below the .786 retrace at 37.95. If you want to give it up to full invalidation, place the stop below the March low. Both offer good risk vs. reward, targeting the measured move fib at 63.34.
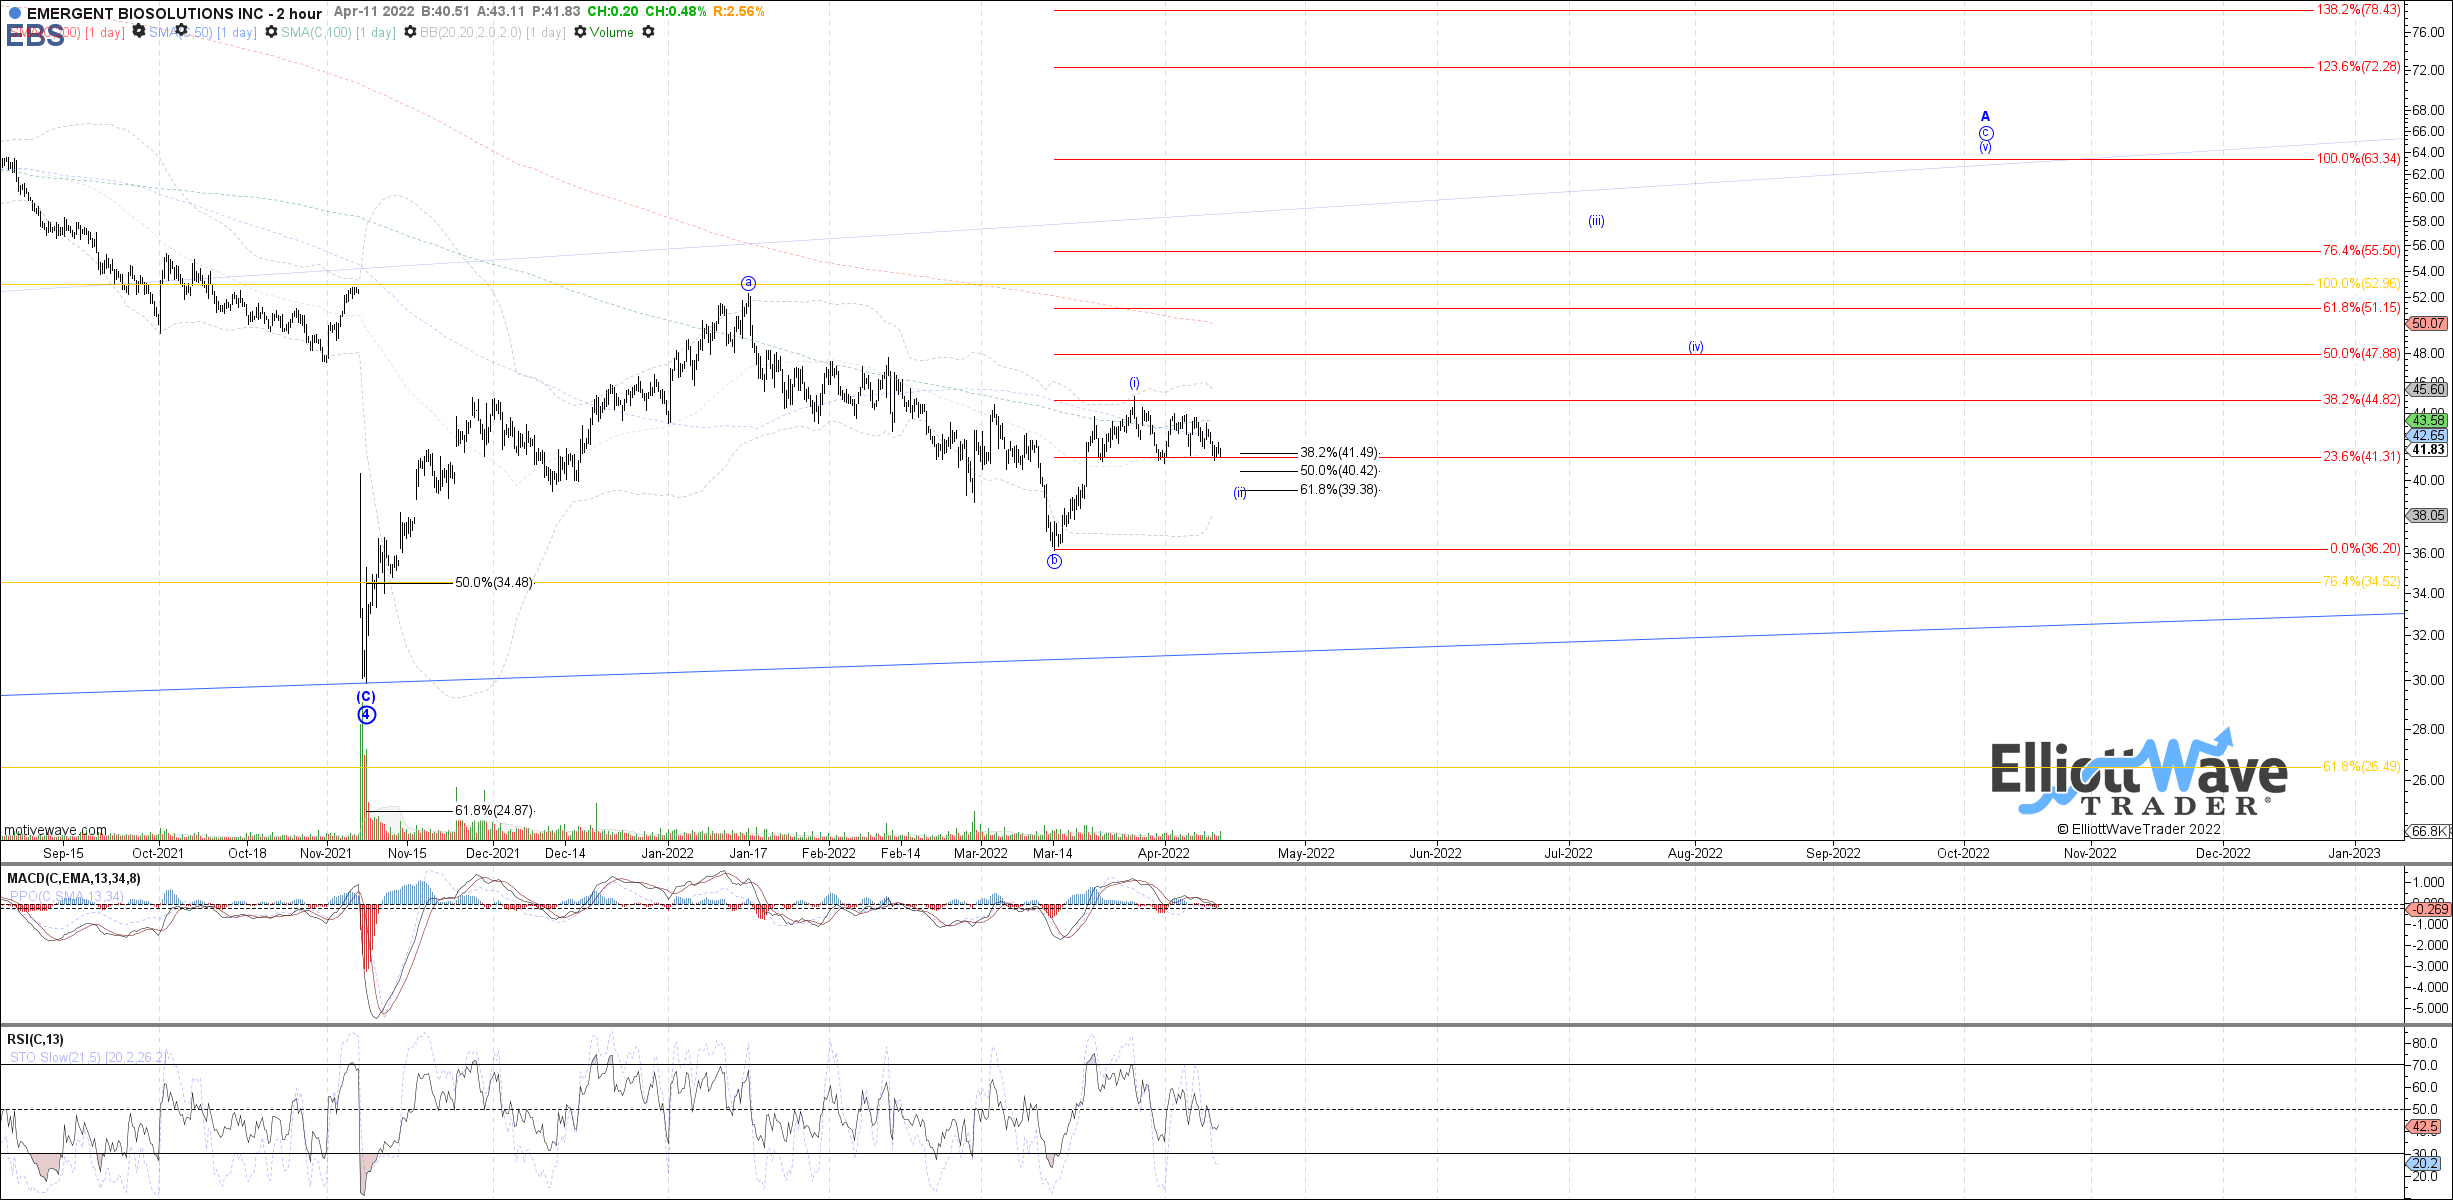
EBS 4-11-22 2hr (EWT)
Moving on to CareDx Inc (CDNA), which was also part of our biotech webinar two weeks ago. It looks like a similar i-ii off of the March low, with price sitting at the top end of standard retracement support, the .382 retrace at 35.64. If price needs to reach a little bit deeper into the standard support range, it has room to test the .500 retrace at 34.01 as the next support, followed by the .618 retrace at 32.45. If you prefer a tighter stop, it can be placed below the .786 retrace at 30.35, or give it up to full invalidation placing the stop below the March low. A rough estimation of the target for wave iii depends on where the wave ii completes, but likely somewhere in the lower 60s.
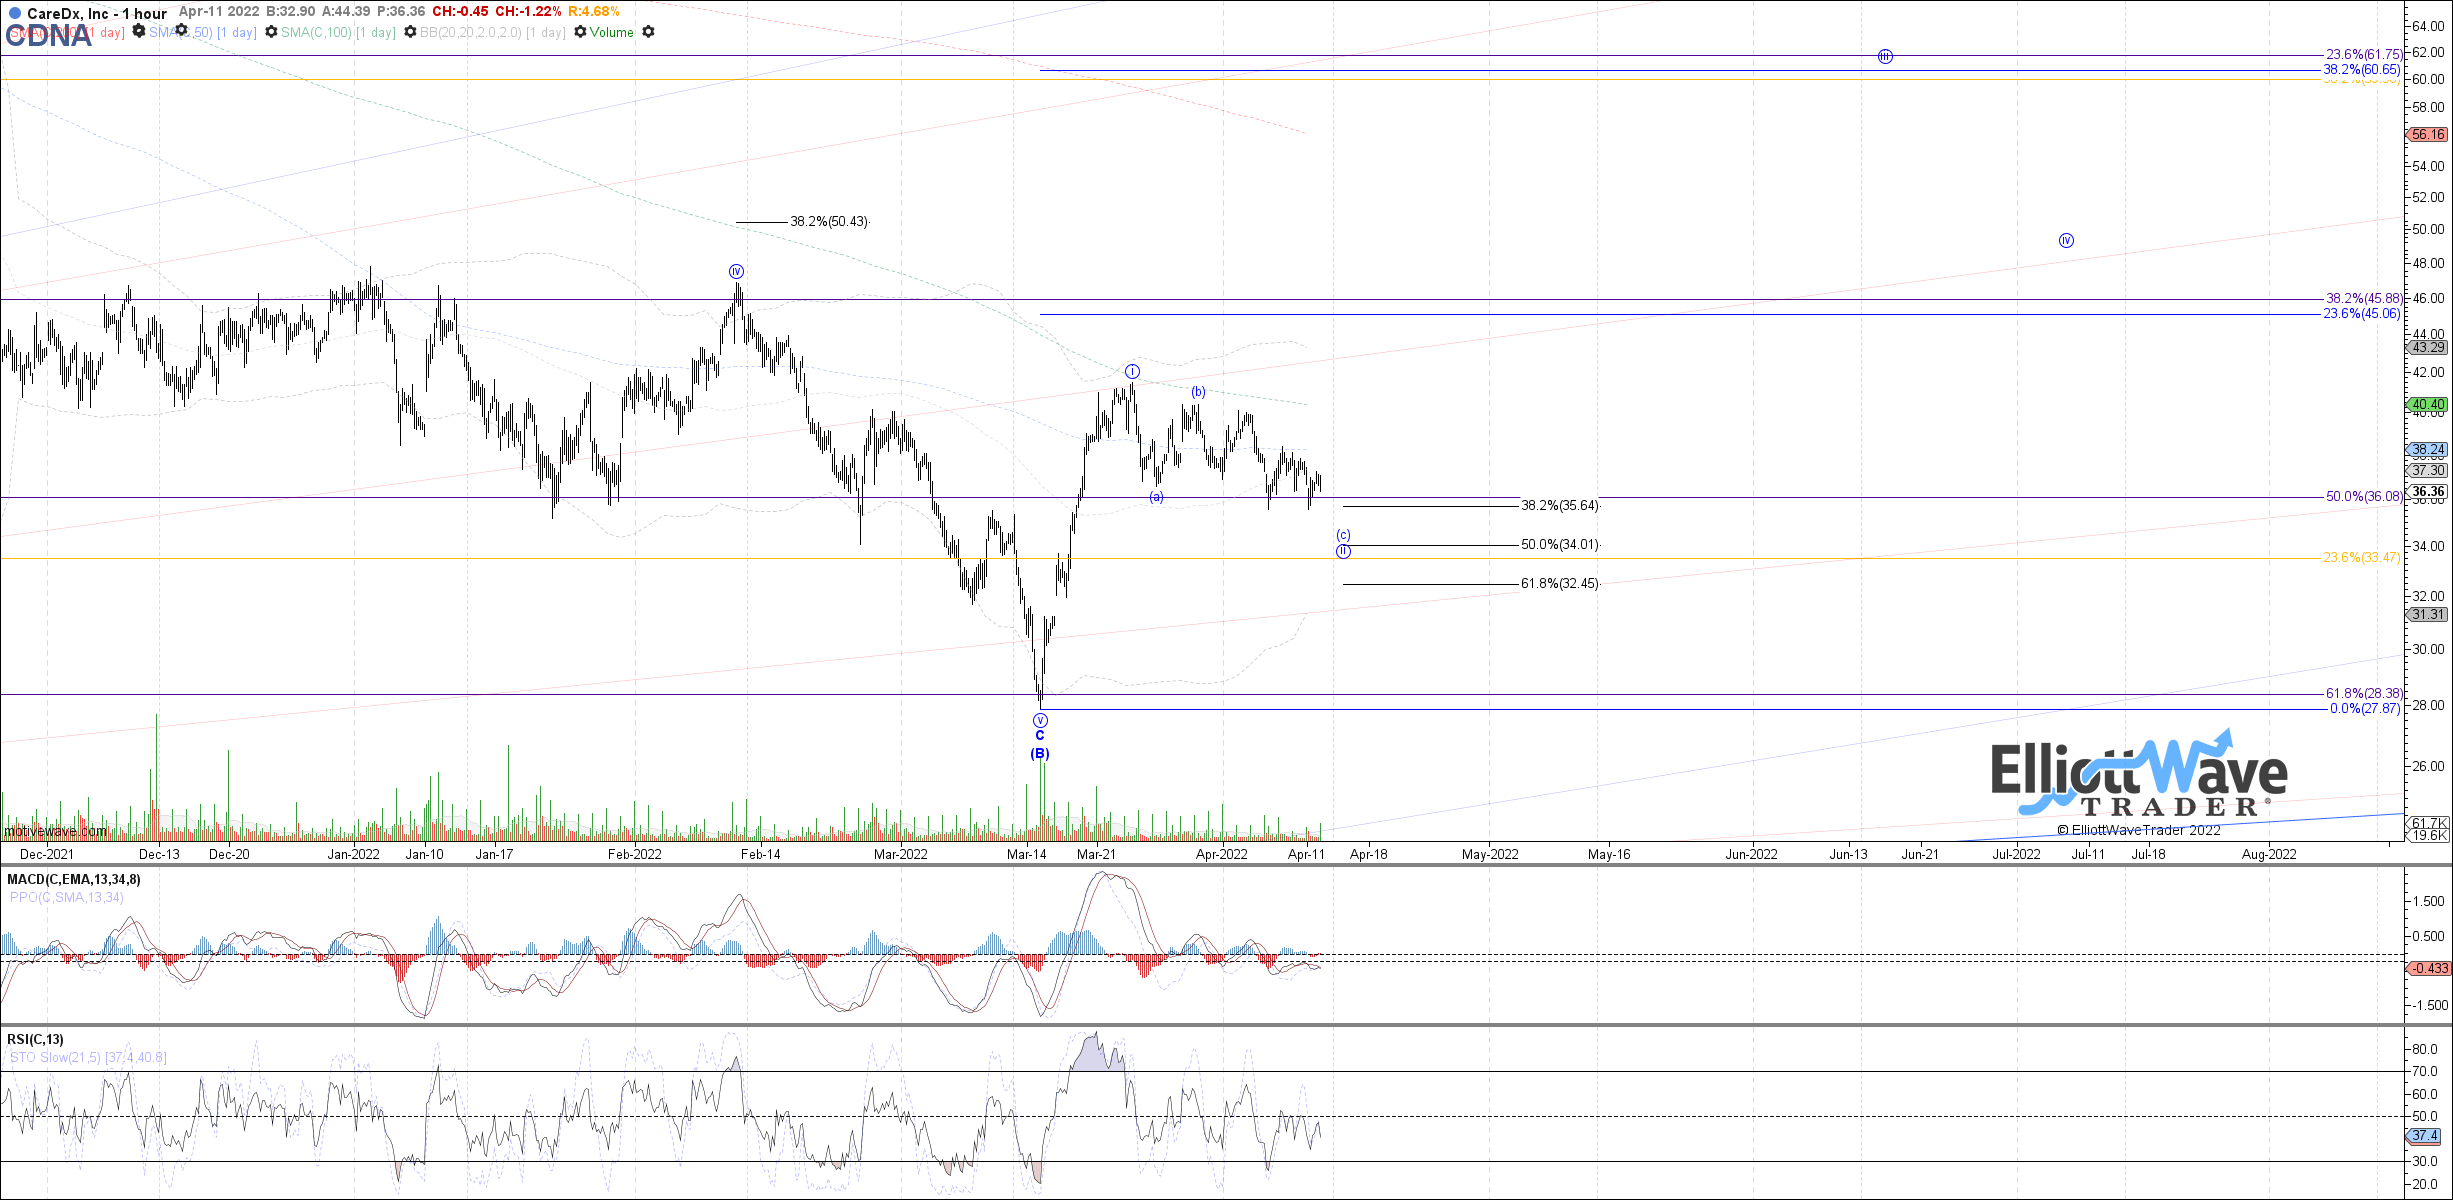
CDNA 4-11-22 1hr (EWT)
Next up is Moderna (MRNA), which is currently being treated as a corrective (B. )-wave bounce off of the March low until proven otherwise. However, there’s the possibility that the correction off of last year’s high completed all of a primary wave 2. If this develops into a larger five wave structure off of the March low, it would support the larger degree bullish potential of a primary degree wave 1 and 2 in place. Even if just looking for just a measured move c-wave to the upside though and using a stop below the .764 retrace or below the March low, it offers good risk vs. reward. Price is currently testing the .500 retrace as either a b-wave or wave ii. If it does need to stretch a little bit deeper, the .618 retrace at 143.92 is the next support. A tighter stop can be placed below the .764 retrace at 135.12, otherwise to give it more room up to full invalidation, place the stop below the March low. If price does hold here at the .500 retrace, a measured move c-wave would target 233.
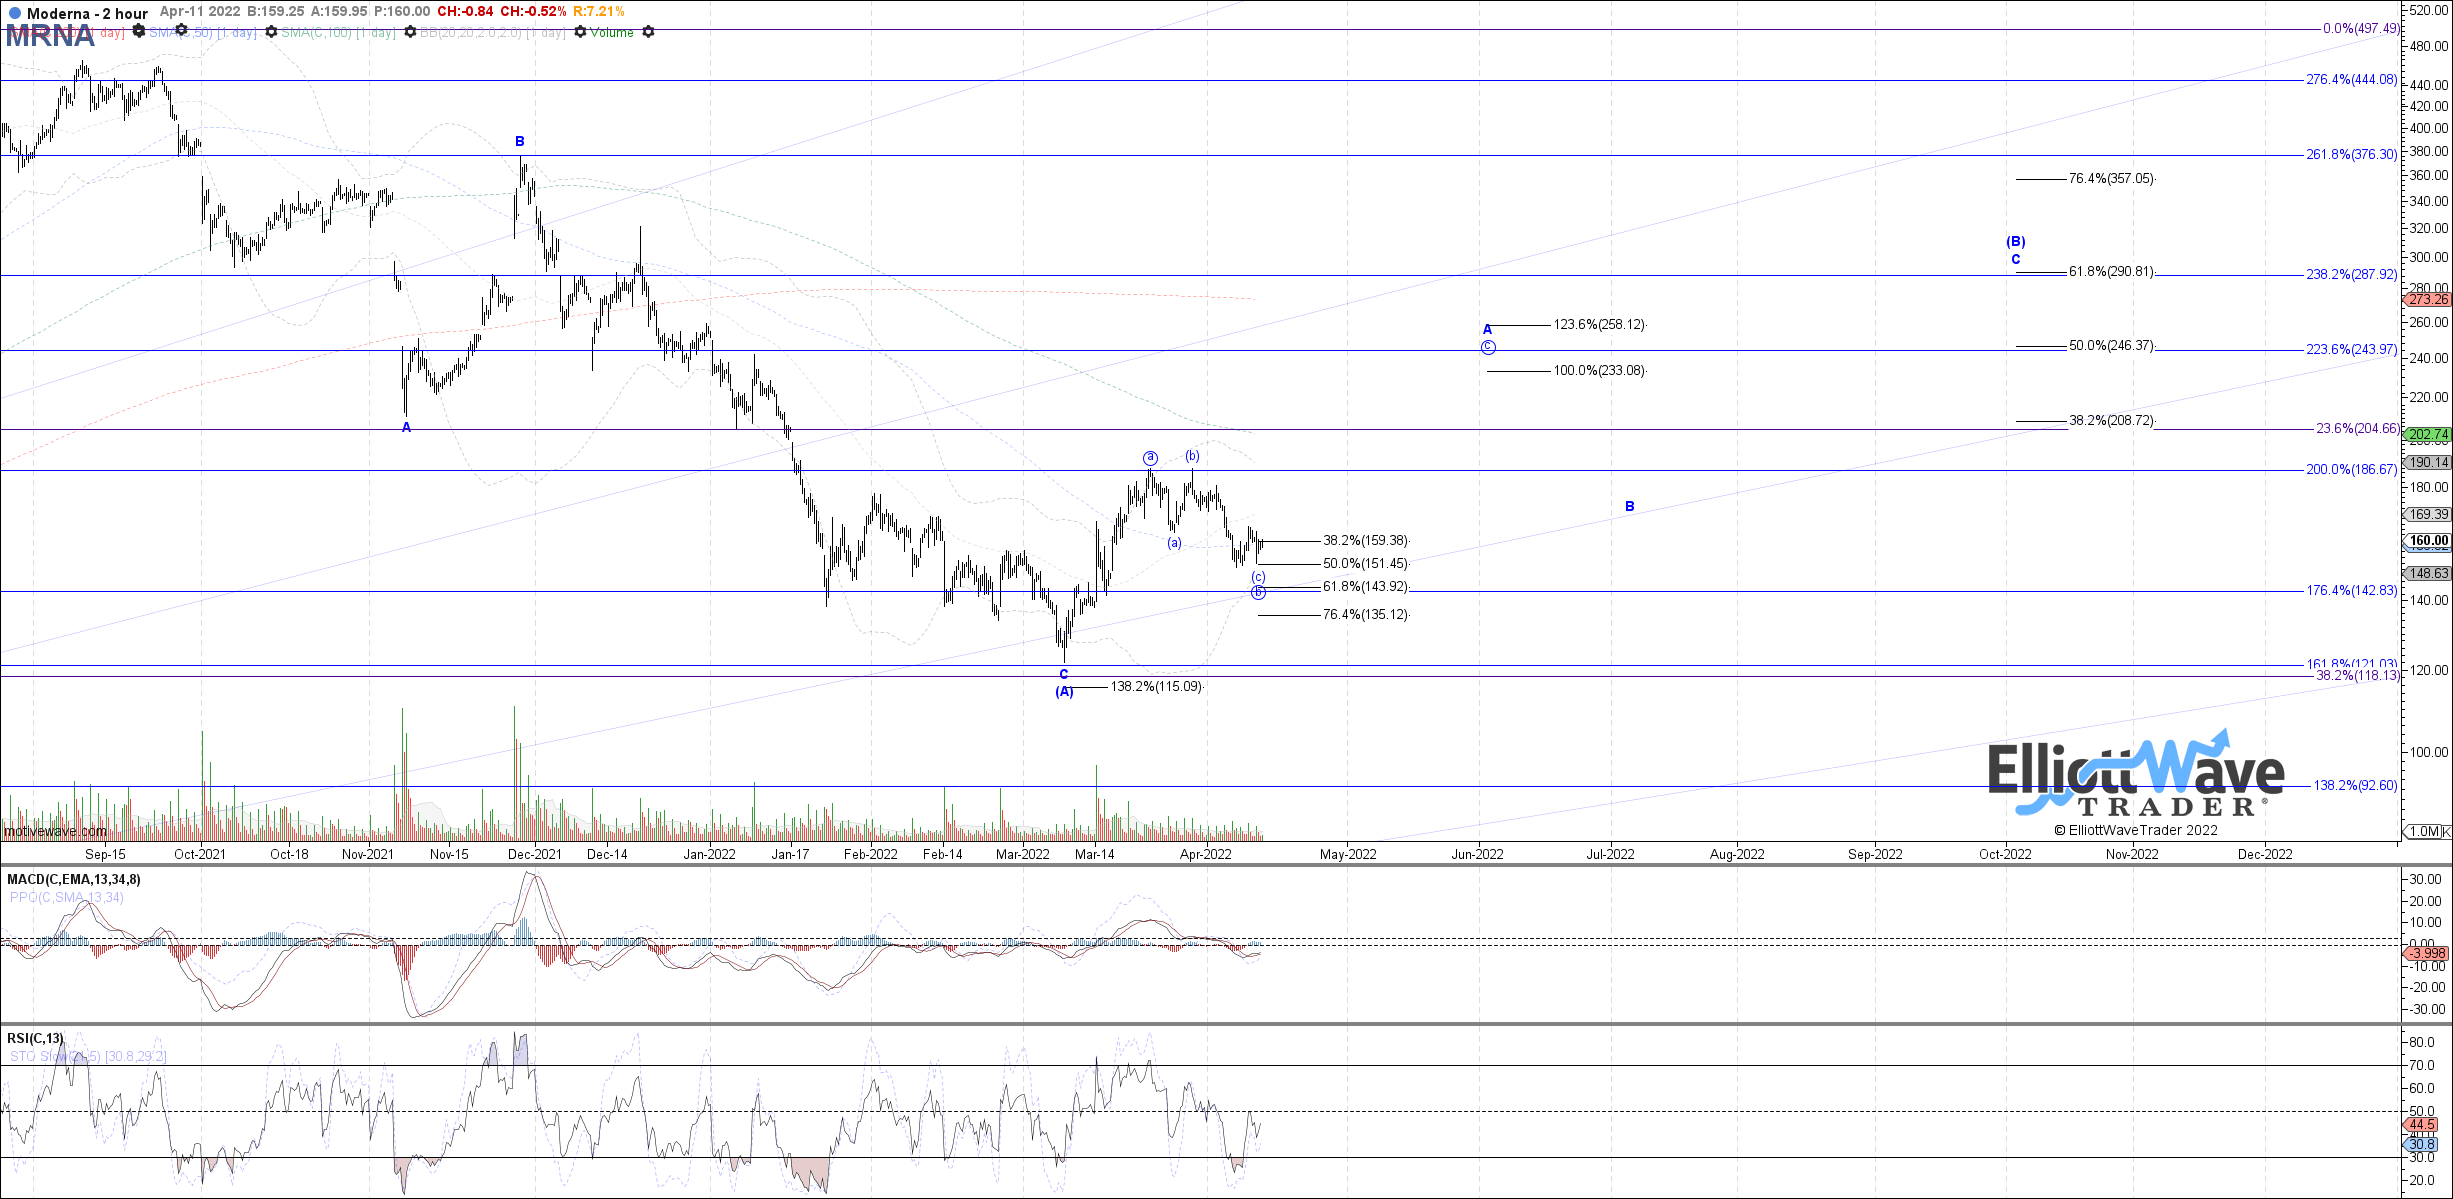
MRNA 4-11-22 2hr (EWT)
Digital Turbine (APPS) is up next, which is convincingly impulsive off of the March low as what should be wave i of a larger wave 1 start to the intermediate degree wave (5) of primary degree wave 3. Price has pulled back into the middle of the standard retracement support range, testing the .500 retrace at 38.11. If it does need to stretch a little bit deeper, the .618 retrace at 36.19 is the next support. Your choice of where to place a stop is either below the .786 retrace at 33.61, otherwise give it more room up to full invalidation by placing the stop below the March low. If price has completed the wave ii at the .500 retrace, looking for 68 as the minimum expected target for wave iii.

APPS 4-11-22 1hr (EWT)
Vipshop Holdings Limited (VIPS) has a larger degree bullish potential of a primary degree wave 1 and 2 going back to the 2018 low. The primary degree wave 2 did reach deeper than ideal though, undercutting the .764 retrace at 750 but it’s so far holding a higher low compared to the 2018 low. Therefore, it offers an intriguing risk versus reward setup because if the primary degree 1-2 is going to remain valid, then the March low needs to hold. For the larger degree bullish potential, attempting a long position on the current pullback and placing a stop below the March low isn’t risking a whole lot if it is indeed a primary 1-2 from 2018 and now turning up in the start to primary wave 3. Even if just setting up a measured move c-wave to the upside though, it also offers good risk vs. reward for that with price currently testing the top end of standard retracement support, the .382 retrace at 7.91. The next support would be the .500 retrace at 7.45 followed by the .618 retrace at 7. If using a tight stop, it can be placed below the .786 retrace at 6.42. Otherwise, give it up to full invalidation by placing the stop below the March low. A measured move as the minimum expected target for a c-wave would be about 12.50. If this is a 1-2 and turns up in wave 3, the 15-17 dollar region would be the expected target.
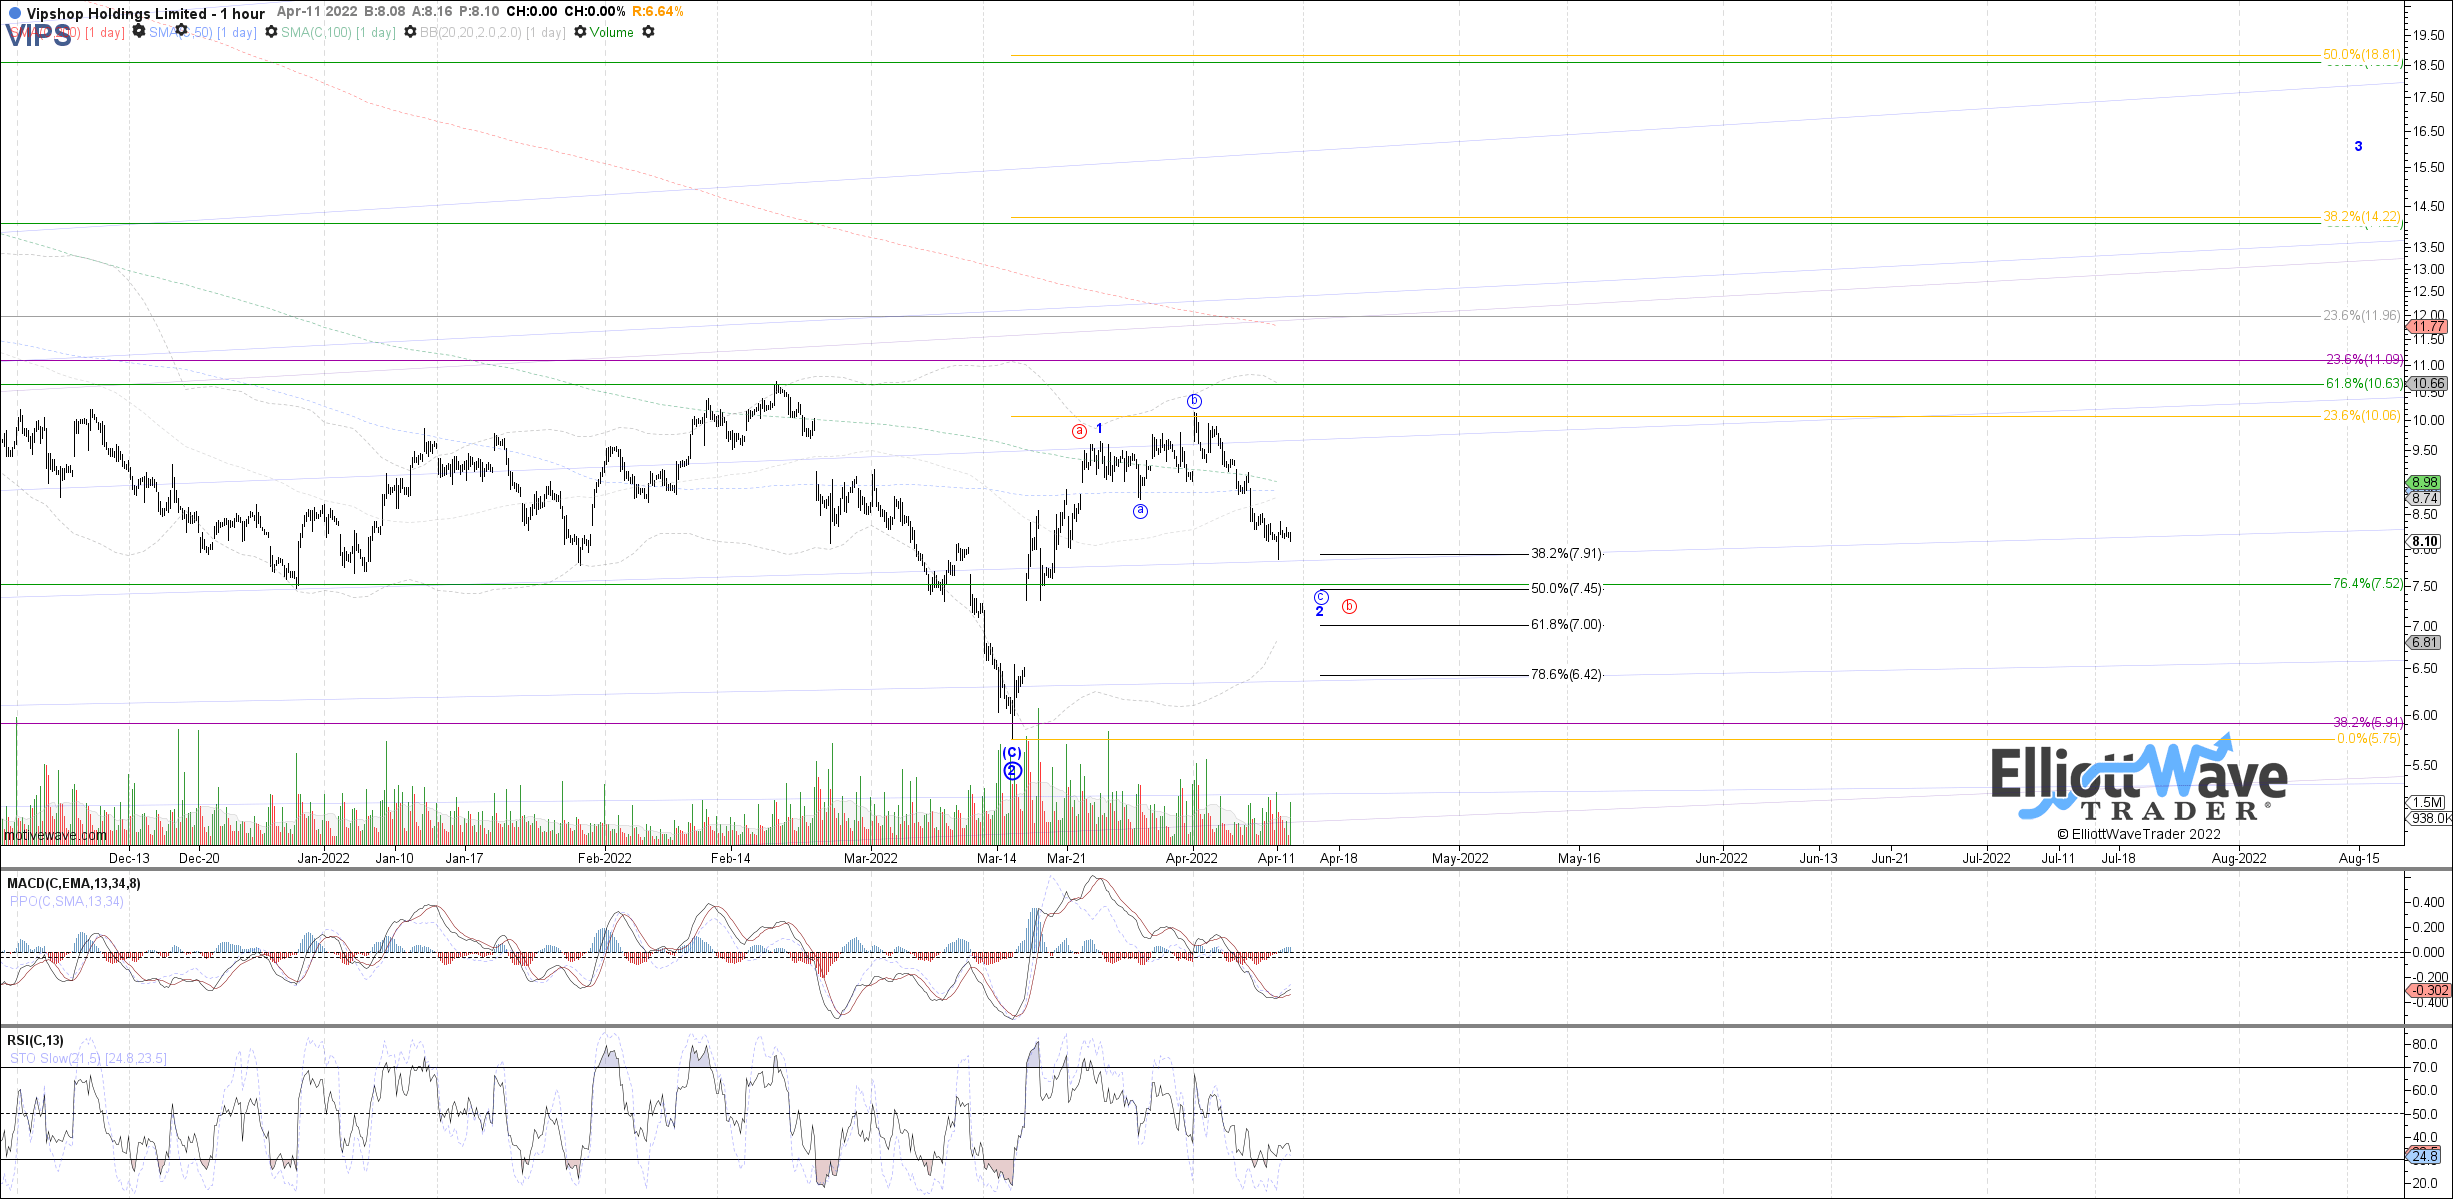
VIPS 4-11-22 1hr (EWT)
Moving on to Shopify (SHOP), price tested the .618 retrace on Monday and is trying to curl up from that support. It also looks like a potential five waves up off of the March low, now with a nice three wave pullback into the .618 retrace as the ideal support to hold is either an a-b or i-ii off of the March low. A break back above 670 would be the initial indication of a local bottom in place targeting at least 883 as a measured move c-wave. If you want a tighter stop, it can be placed below the .764 retrace at 560.15, but in this case I would recommend using the March low as the stop level considering that price has already pulled back to the .618 retrace.
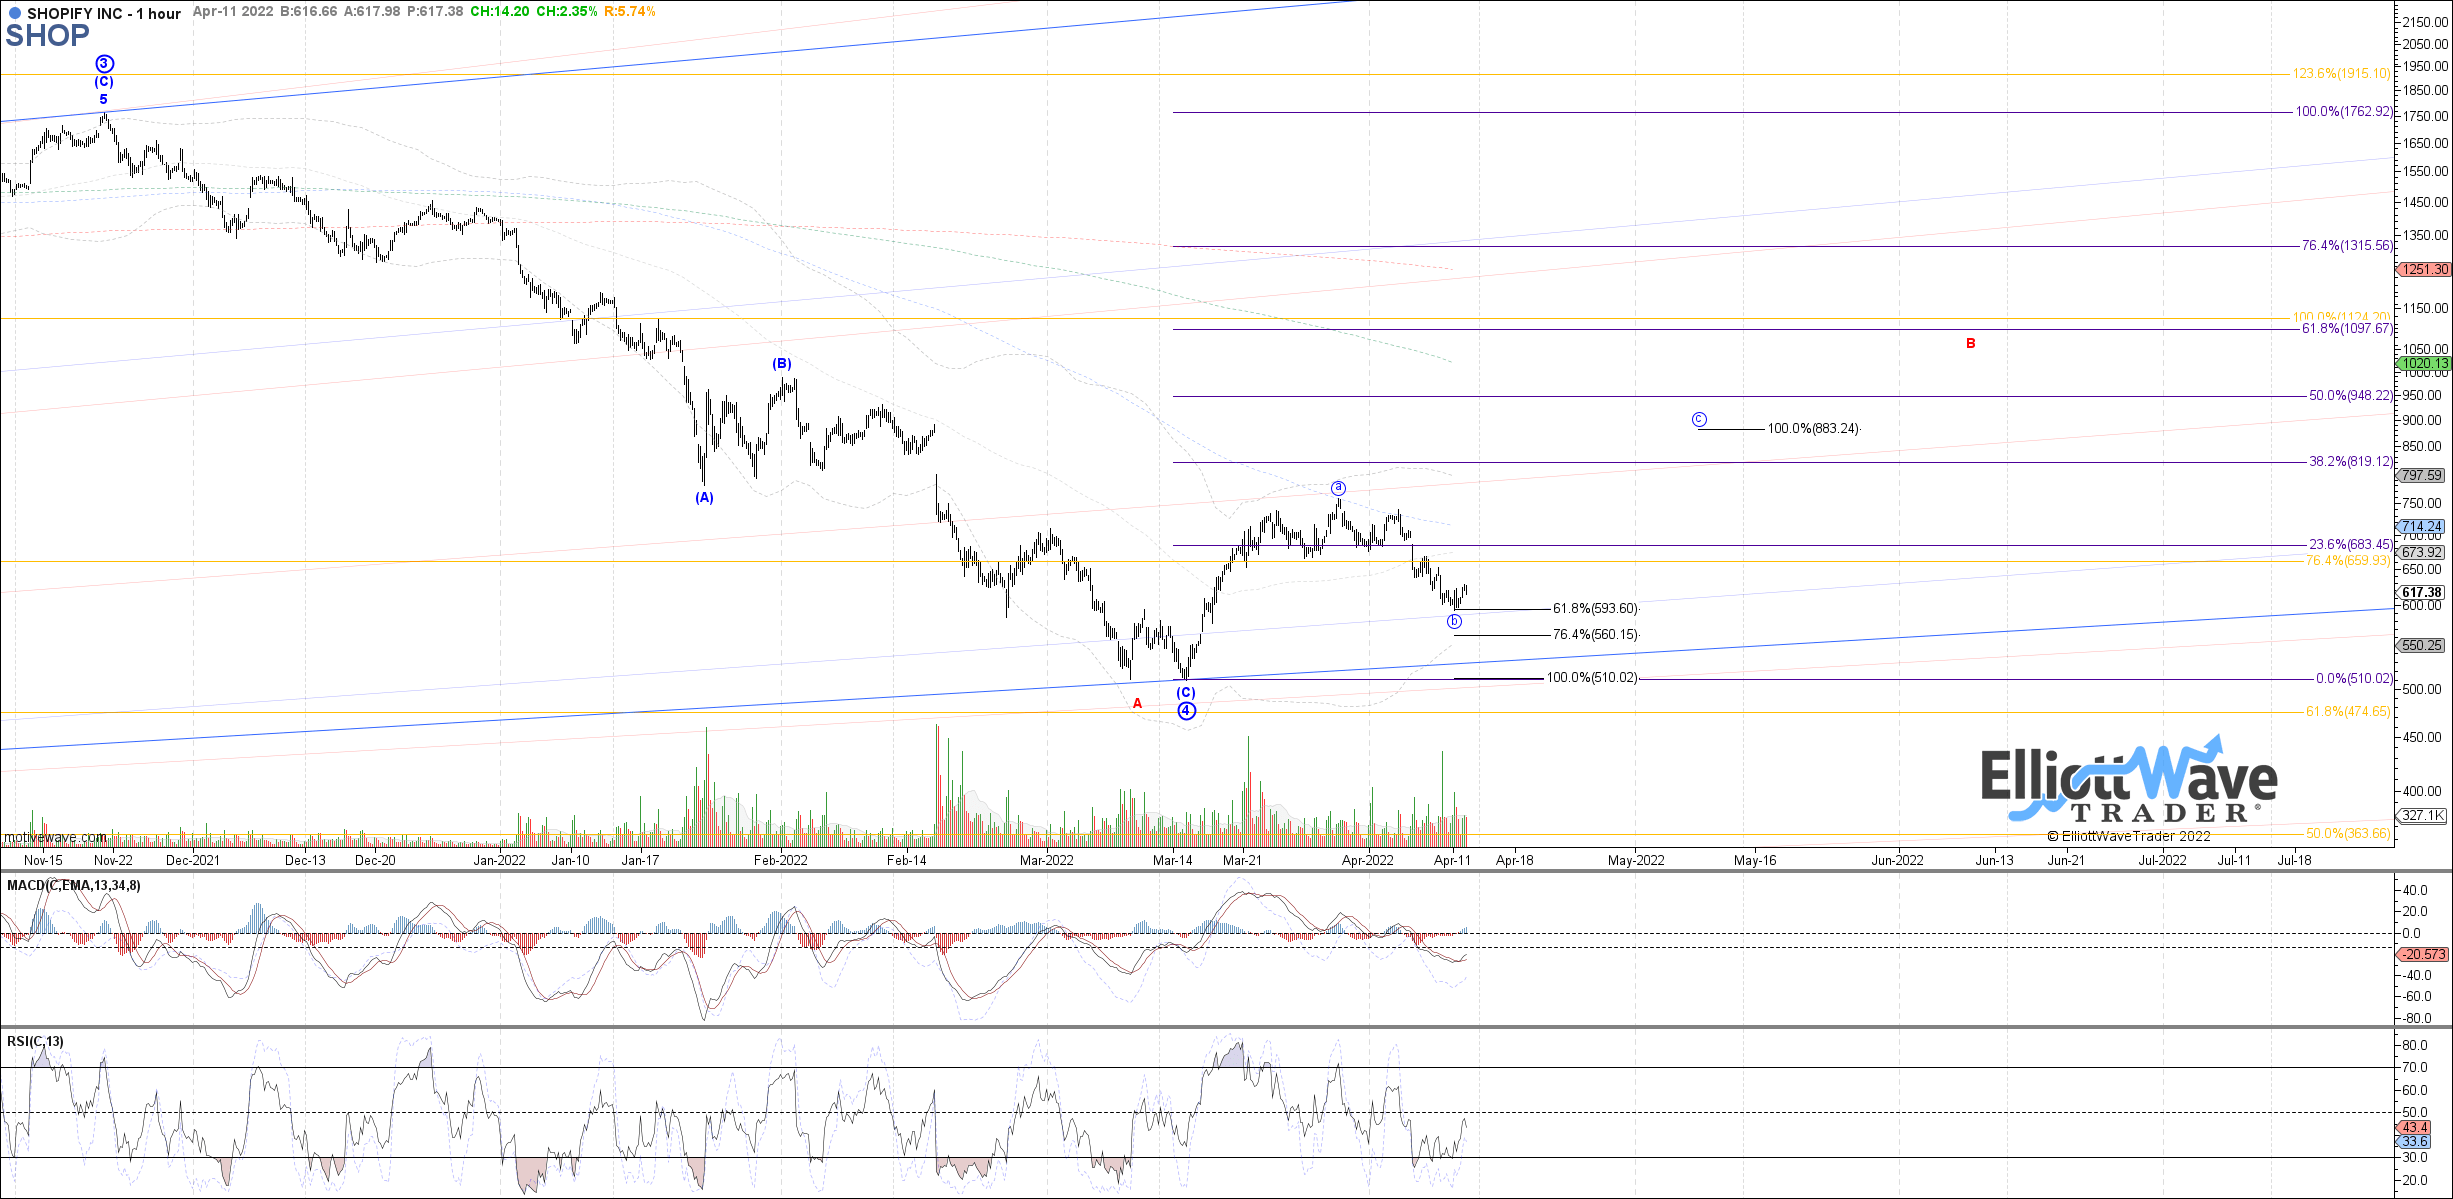
SHOP 4-11-22 1hr (EWT)
Twilio (TWLO) is up next, which has also pulled back into the .618 retrace this week similar to SHOP. A break back above 157 is needed in this case as evidence of a local bottom in place and start to at least a measured move c-wave targeting 202.77. It’s even possible that this is a i-ii off of the March low as a more bullish option, which would instead target the 233 to 250 region. You have the choice of a tighter stop below the .764 retrace at 134.07, but similar to SHOP, I would recommend placing it below the March low and give it up to full invalidation. Even for a measured move c-wave, that offers good risk vs. reward.
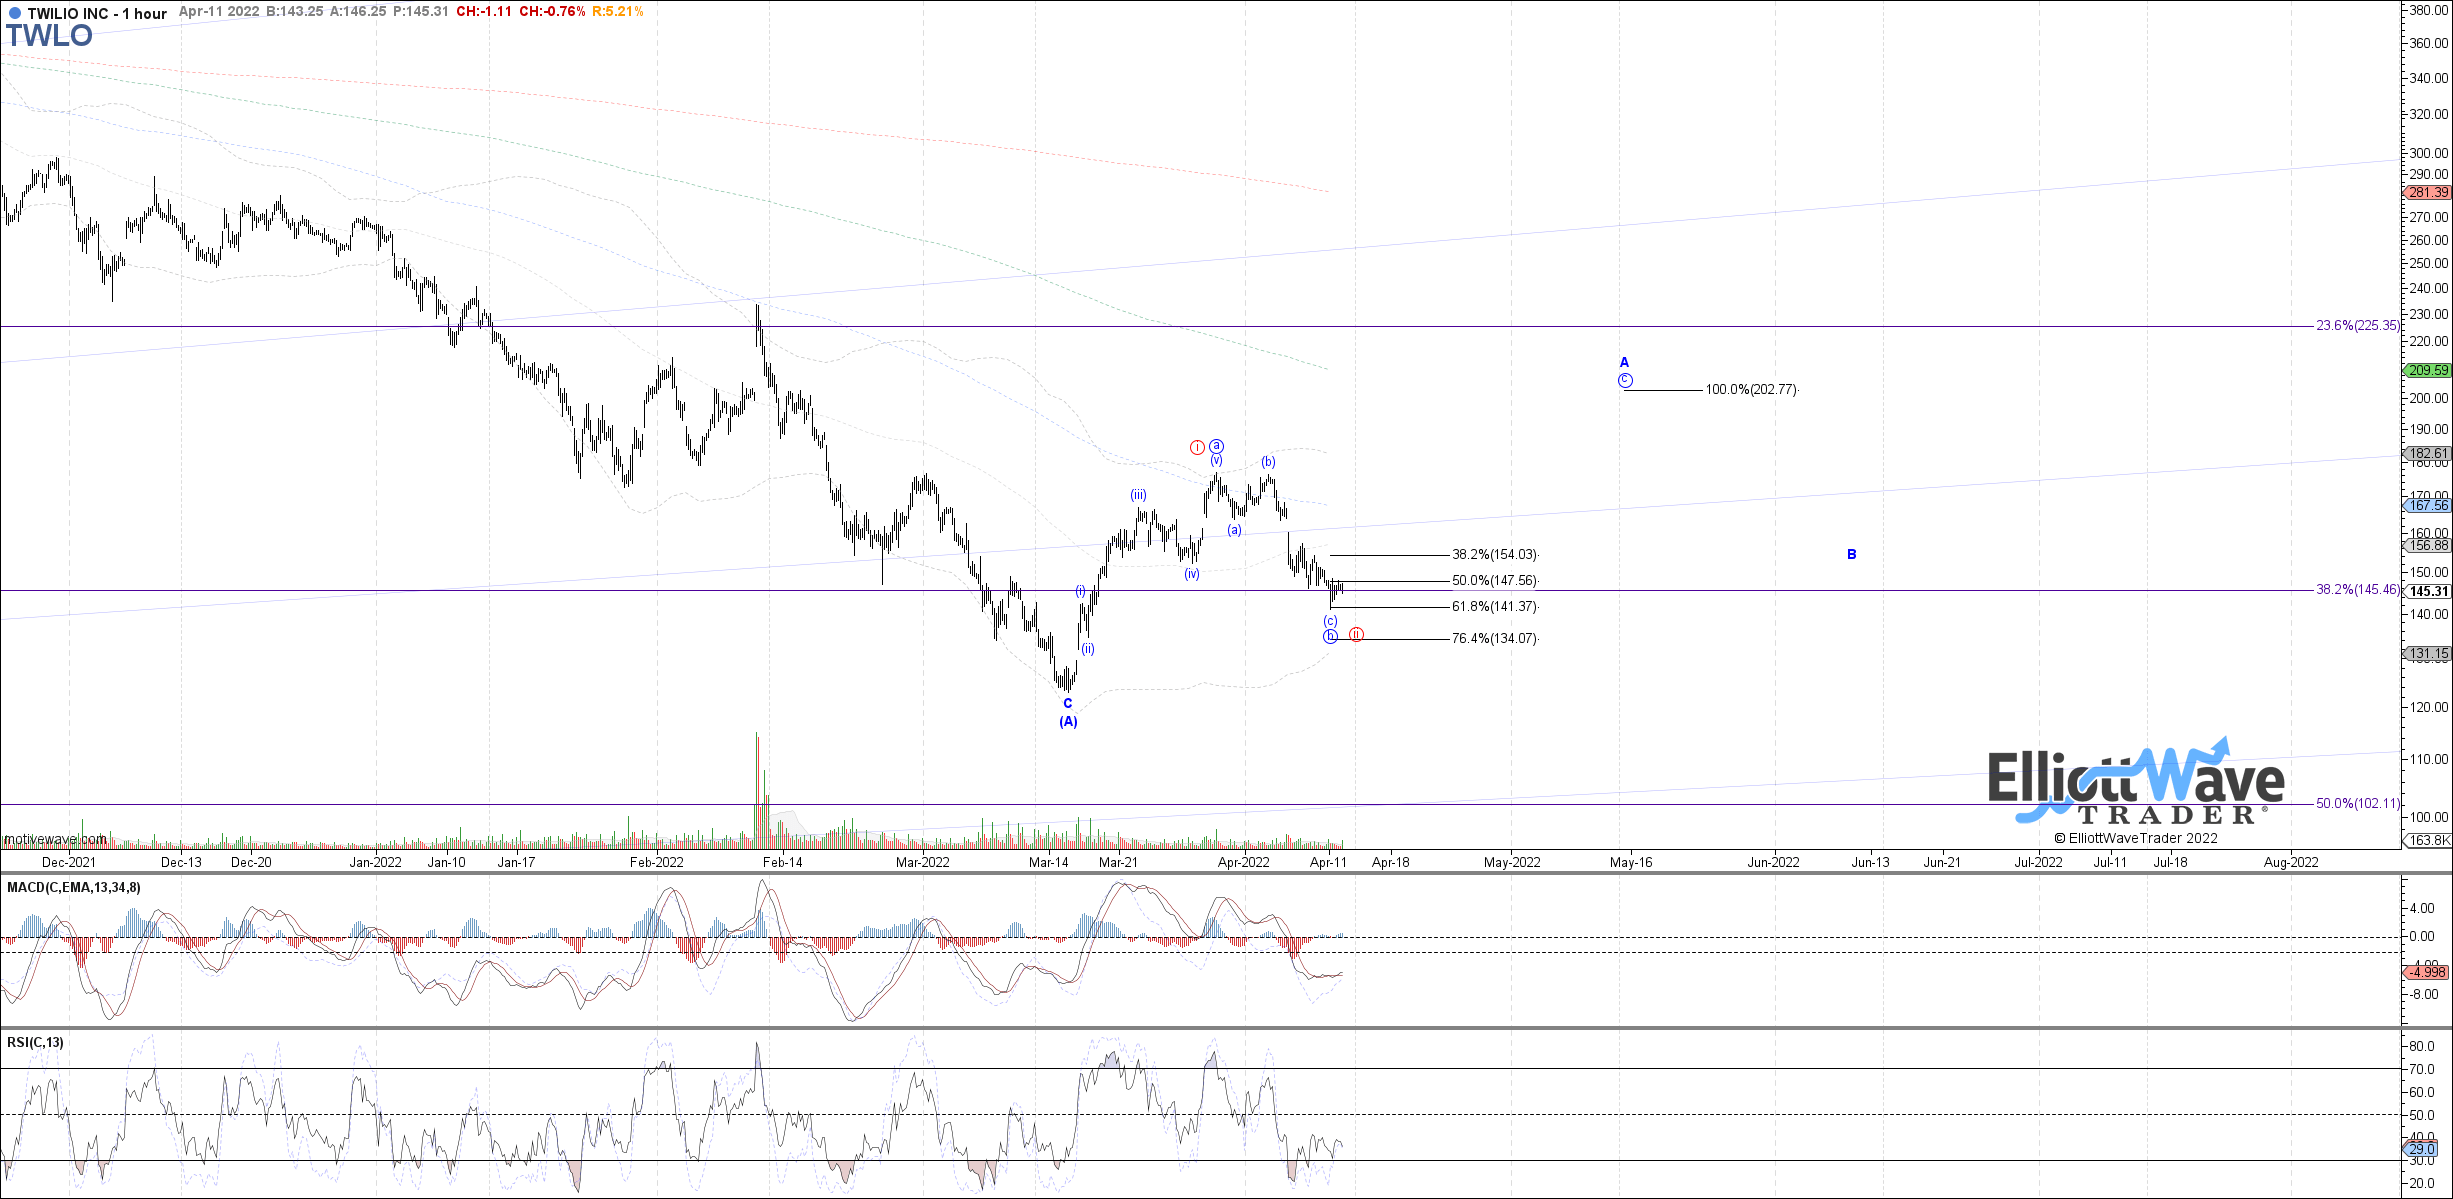
TWLO 4-11-22 1hr (EWT)
Be the first to comment