

jetcityimage/iStock Editorial via Getty Images
Introduction
Stellantis (NYSE:STLA) has once again released its quarterly shipment and revenues and it kept on showing record results.
In this article I would like to go over the bull-case I have for the company, making it among my favorite picks among automakers, together with Mercedes-Benz (OTCPK:MBGAF) and Ferrari (RACE).
A look at the company
Stellantis began operating at the beginning of last year after the merger of FCA with Peugeot. Its portfolio, as shown below, has 15 world-renown brands that meet different customer needs, from entry level cars sold under the Citroën, Fiat and Opel brands, all the way up to premium brands such as Jeep, Ram, Alfa Romeo and Maserati. This last one, in particular, should see a major turnaround that is already taking place and that will lead the brand to be a cash cow for the company.
Stellantis Webcast Press Release Presentation 2022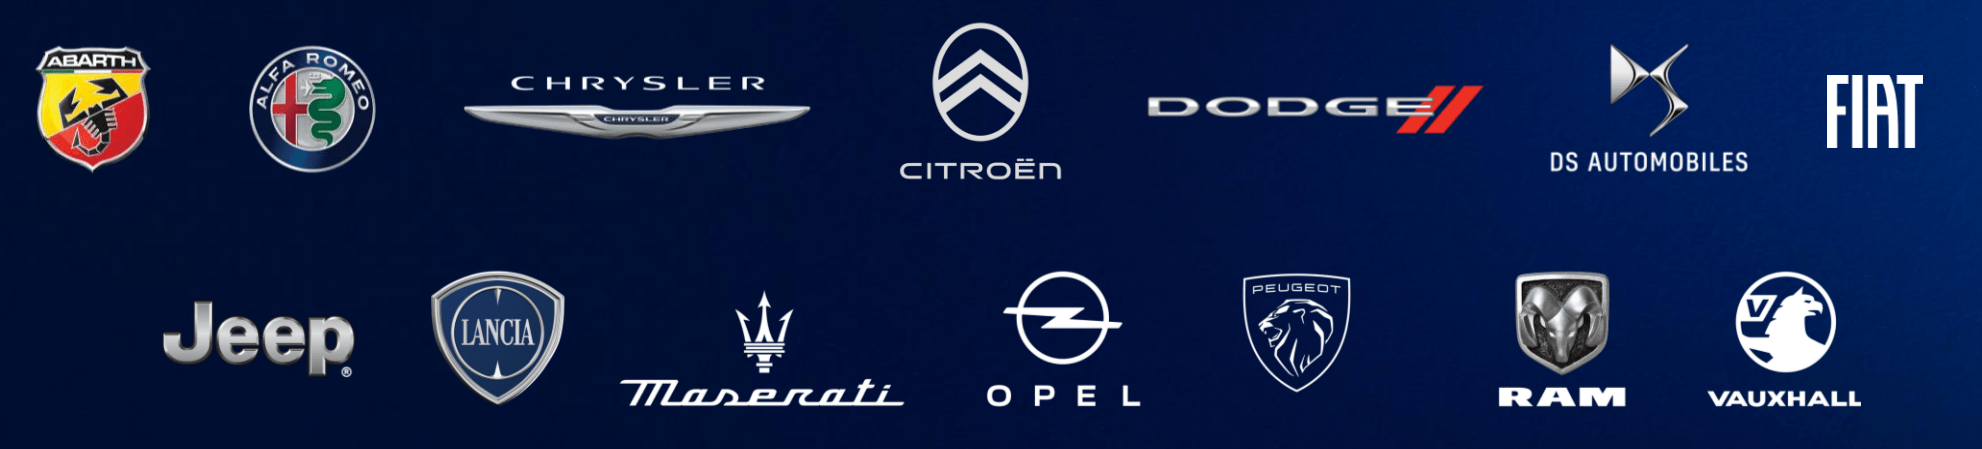
Stellantis operates worldwide, but, as we will see in moment, its exposure to China and Russia is very low. This is one of the facts that I like most about the company, because it shelters its results from some of the geopolitical tensions that are shaking today’s economy.
My bull case
Strong balance sheet
It may sound strange, but my bull-case didn’t start from the income statement and the way the company is operating, but from the balance sheet. In a previous article (Stellantis is swimming in cash), I outlined Stellantis’ solid balance sheet, with a net cash position of almost $20 billion. This makes the stock the only one among automakers that gives every shareholder a cash per share higher than the share price. Stellantis’ balance sheet is in EUR and although the USD has appreciated against it and the stock has recently rebounded, the difference is still true, with the current share price at $14.87 while cash per share at $15.09 and the net cash per share is $6.37.
I started trying to understand how this was possible and I quickly realized that Stellantis is putting into action meaningful synergies that are reducing capex and R&D while increasing free cash flow. This generates a lot of cash and doesn’t make the company in need of taking on new debt. Actually, Stellantis is paying it down and reducing it while having more $47 billion on hand, which is exactly equal to its market cap. It is a rare case where the company, if it wanted to, could buy itself out and delist itself without needing any borrowings.
From here, I started researching and published a second article titled “Stellantis: Its Undervaluation Is Getting Harder And Harder To Justify”.
I went over the numbers and showed that this investment resembles by many metrics the ones Peter Lynch looked at in one of his most valuable calls in the 80’s when he bought Ford, realizing that factoring in the net cash per share as a valuation metric led to a new way of finding the correct valuation of a stock. Stellantis trades at $14.87 but if we take subtract from the price the net cash position per share of $6.37 we see that we are actually paying just $8.5 per share. This leads to even lower valuation metrics which must be known by investors who are looking for good or even great deals.
Let’s also consider its debt.
In the 2022 semi-annual report, Stellantis broke down its debt maturity schedule as follows: Total maturities: €29.9 billion Due in 2022: €8.6 billion Due beyond 2026: €8.8 billion.
This shows that 28% of the current debt will be paid this year with low rates. Stellantis doesn’t necessarily need to open up new credit facilities, given the €47 billion in cash it has. Thus, I am not worried at all about interest rates rising because Stellantis has a balance sheet that allows it to be free to choose whether it is more convenient to issue new debt or use its available cash.
What is Stellantis going to do with this excess cash? First of all, back in April Stellantis paid an ordinary dividend of € 3.3 billion, which meant a € 1.05 (about $1.12 when paid) dividend per share. For now, as most European companies do, the dividend is annual, but maybe, since the company is becoming more linked to North America, we could see at least a semi-annual dividend. The yield was rather high for this industry: 7.6% with a very low payout ratio of 25%. This is a safe dividend. The company has also said that it will use some of its cash that it will opportunistically use for up to 5% share buybacks from this year to 2025. Most importantly, Stellantis has enough cash on hand to keep on investing or to consider interesting acquisitions.
High operating margin
When I moved to Stellantis’ operations I discovered that Stellantis was increasing its margins above 10% at 14.1%, outpacing the industry and its main peers.
For example, Volkswagen (OTCPK:VWAGY) reported for the first half of the year operating margin of only 10%, while Ford (F), in its 1H22 earnings report, achieved an operating margin of 9.3%
In fact, Stellantis has managed to reach double digit margins in all the regions it operates in, with North America that achieved record profitability of 18.1% in the first half of the year, with an average transaction price of $52k.
In another article (Understanding the Stellantis Bull-Case: A Look At Its Profitability), I took a big dive into Stellantis’ profitability to show that it is ahead of its peers and that, as per certain metrics, it is almost comparable to Tesla (TSLA).
Asset-light strategy in China
Stellantis is aware of the geopolitical environment and its CEO Carlos Tavares has sated more than once that the company has a strategy for this situation:
Because with geopolitical tensions, each time you have the risk of cross sanctions, you have to choose. You have to choose between 1 of the 2 contenders. And of course, in our case, we are a Western company leading Latin America, [with a] strong presence in North America, number 2 in Europe, we are a Western company. So if we were in a cross sanctioned environment, which I believe we will, at one point in time, we would be very exposed if we had an asset-heavy strategy in China. Hence, the fact that having an asset-light strategy in China is the right strategy for the next few years in terms of protecting us against geopolitical cross sanctions.
I really like this strategy because, though it may lead to lower volumes in some regions, it protects Stellantis’ core business in Europe and the Americas.
Efficiency
Thanks to the merger and the leading role of Tavares, who has already proven itself able to turnaround a company on the verge of bankrupt and making it profitable (see Peugeot), Stellantis pride itself in being around 30% more efficient compared to its main peers. This is where the difference in operating margins comes from. As Tavares reminded us:
We conclude that we have a 30% efficiency edge, effectiveness edge against our competitors. So it’s normal that on a recurring basis, you see CapEx numbers, which may be much lower than some of our competitors. So we confirm that we have a 30% hedge, positive hedge against our competitors.
This can also be seen from the fact that Stellantis has declared a very low breakeven point at 40% which means that it just needs to reach 40% of its production capacity to be at breakeven.
Q3 Shipments and Revenues
Now, let’s look at the 6-K SEC Filing Stellantis released at the beginning of November to report its revenues and shipments.
Here are the main numbers the company reported:
- Net revenues reached €42.1 billion, up 29% YoY
- Consolidated shipments of 1,281k units, up 13% YoY, primarily due to improvement in semiconductor order fulfillment versus Q3 2021
- Total new vehicle inventory of 926k units at September 30, 2022.
- Global BEV sales increased 41% versus Q3 2021
Since Stellantis is based in The Netherlands, it is not required to file quarterly reports as American-based companies. This is why its quarterly release focuses only on a few data without disclosing other financial data that would help us paint a more detailed picture.
In any case, among automakers, shipments and revenues are among the most important data we should consider as these companies need strong top-line performance given the high fixed costs they have to face.
The results Stellantis reported were strong. Volkswagen (OTCPK:VWAGY) and Ford (F), for example, both reported a 10% revenue increase YoY with shipments up 10.6% and 7% respectively.
Stellantis increased its shipments by 13%, but the impact these increase had on revenues is exceptional as it led to a 29% increase. This means that Stellantis is performing very well in terms of price-mix, pushing upwards its earning power and making each sale more profitable compared to its main peers.
As we see below, Stellantis’ combines sales were a bit down in most markets in terms of volumes and its market shares saw a little decline in the Americas, while gaining traction in EMEA, despite a volume decline.
Stellantis Q3 Shipments and Revenues Presentation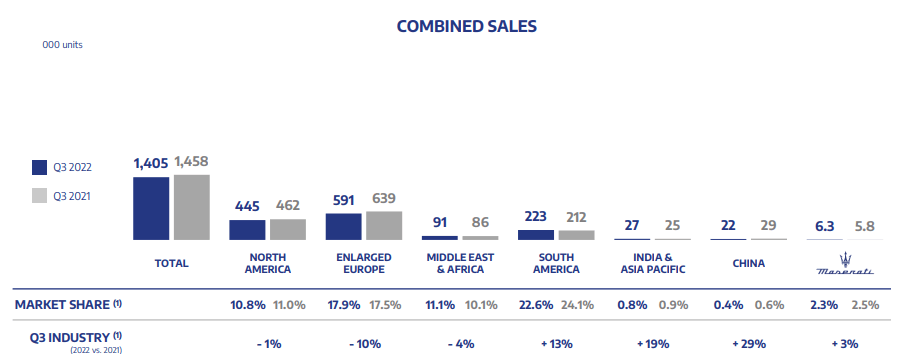
With an industry that still sees a decline in volumes YoY and where market share is a number that is also affected by supply chain constraints which change delivery time and car availability, Stellantis is proving quite resilient, with stable market shares and improving profitability.
If we zoom out and look at the YtD performance, we see the full data about shipments and net revenues by regions. It is clear that Europe has bit the hardest hit region in terms of shipments, as supply chain bottlenecks and the ongoing war have hindered the manufacturing process. This led to a 11% decline in shipments. Nonetheless, revenues are up in this region by 2.5%. This allows us to calculate the improvement in profitability. In 2021, Stellantis average revenue per car sold in Europe was €20,478 while in 2022 Stellantis is averaging €23,578. This is a 15% increase on the average revenue per car, which is ahead of inflation in the area. Therefore, I am expecting the operating margin to be stable at 14%, if not even a little bit higher thanks to an increase in volumes we can expect over this current quarter as supply chain bottlenecks ease.
Stellantis Q3 Shipments and Revenues Presentation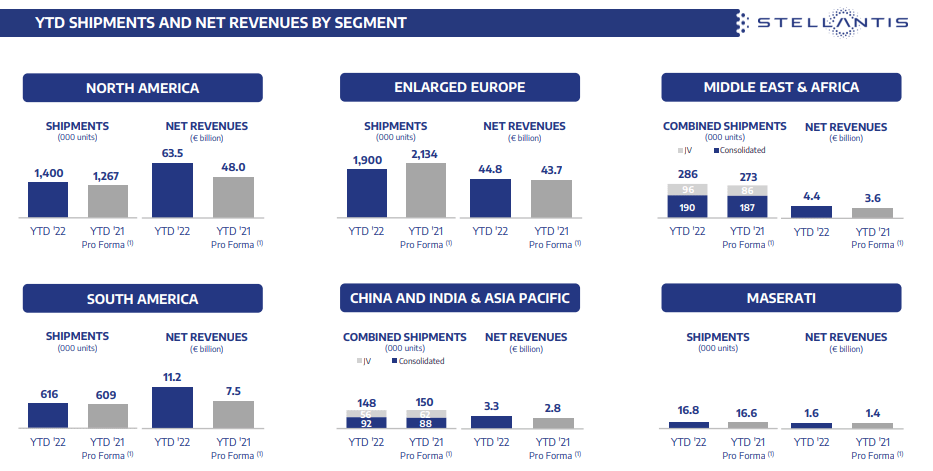
Apart from Europe, which is the main area of concern for the company, we see that Stellantis two other major markets – the Americas – are performing quite well. North America is the true cash cow for the company: it accounts for 31.5% of total sales (1.4 million out of 4.37 vehicles sold worldwide), but in terms of revenues its weight is 48.8%. Here, the average revenue per car is €45,357 which is almost twice the revenue per car Stellantis reaches in Europe. The American soul of the company, with its popular brands such as Jeep and Ram, is clearly generating a profit that nurtures the whole company and makes its stronger and stronger in terms of liquidity, margins and cash flows.
South America is also improving in terms of revenues. Here Stellantis is the market leader but profits were low. As we can see, last year the continent accounted for 13.7% of total sales, but its revenues were just 6.9% of the total. This year things are changing: total sales are 14.1% but the revenues account of 8.6% of the total.
Regarding exposure to China, I have already said more than once that I prefer manufacturing companies who are not so exposed to the area. However, I am indeed intrigued by Stellantis’ plan to expand in Middle East and Africa. Stellantis just announced a €300 million investment in Morocco to leverage its potential for sales in Middle East (Stellantis is the market leader in Turkey) and Africa, with an eye on North Africa in particular. Some areas in the Middle East are experiencing an expansion in terms of economic cycle and the customer base that can buy a new car is enlarging, offering Stellantis interesting future prospects.
Inventory
We all know that as long as inventories are tight, car manufacturers have strong pricing power as demand is greater than supply. As shown in the Results Presentation, the new vehicle inventory is trending upwards, though it still hasn’t recovered its 2020 levels.
Stellantis Q3 Shipments and Revenues Presentation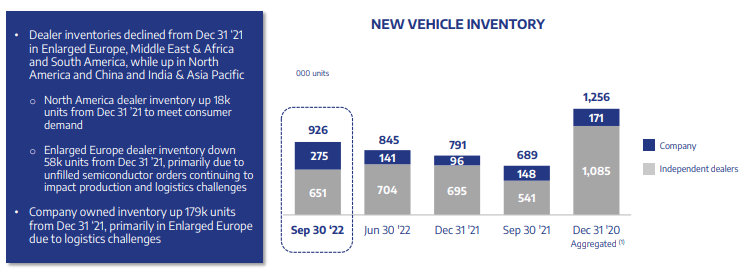
The question is: are we seeing a trend that shows Stellantis is soon to be flooded with unsold cars? I think that here we need to know how the company wants to manage these numbers and what the company is targeting to achieve in terms of car inventory. In the first half earnings call, Tavares addressed this problem:
I consider that the 1 million mark on the total inventory is a red line for our internal management to understand that there is a moment where we don’t want to consider any more, any kind of supply shortage talk. And what we have said to our management is that as soon as we are at 1 million, we consider that we should manage the business with a very dynamic flow of products with 1 million inventory that is going to be enough for us to make the right earnings. So internally, we consider the 1 million is the right number to stop talking about supply shortage, which means as soon as you are above 1 million, supply is fine.
Now we have seen in the past that the companies could operate with much more than 1 million, which then is creating another vulnerability, which is what happens if you have a significant higher number than 1 million and some — at some time, there is a downturn. But what happens is that it costs you a lot of money to get rid of your inventory, a lot of variable marketing expenses. So there is no interest in a very volatile environment to have a very high level of inventory because in terms of sales expenses, it becomes immediately very costly to reduce your inventory if you are caught with a high inventory and a downturn in the market.
So we will try to keep our inventory possibly between 1 million and 1.2 million in that kind of range, which I think is the right the right range. 1 million is an internal line where we say stop bragging about supply, focus on the flows, focus on the dynamics of the distribution, focus on the efficiency of distribution and possibly because we have a very diverse business footprint. You can have ups and downs, and we can be at 1.1 million, 1.2 million, which would be okay from my perspective. So that’s how we see it. It’s not rocket science, it’s more the result of our experience in this automotive world.
I felt it was important to show all these three paragraphs because in the upcoming months, as inventories grow once again, investors may start worrying about this. But for Stellantis the threshold is clear, the warning signal triggers once the company goes over 1.2 million and doesn’t come back within the range. At the moment, we are still far from this as we are not even in the targeted range.
One last note, before we make this article too long. BEV sales are increasing rapidly and Stellantis is currently the second largest BEV manufacturer in Europe in terms of sales. I think this is enough to offset concerns about the company’s future
Conclusion
A few months ago, I shared my valuation model. I also said that I find absurd that the company’s share price is lower compared to its cash per share and that its PE is constantly below 3, while its less profitable peers trade in a range between 5 and 9. I am not arguing that Stellantis should trade a premium, but I think we have enough data to acknowledge that the company is performing much better than most of its peers and that there this low PE means that investors are willing to pay just a little above two years of current earnings, as if the company were to disappear soon. The balance sheet speaks for itself and assures everyone that Stellantis can withstand better than many other competitors any economic condition. This is why, after the results, I rate the stock once again as a strong buy. At the moment, it is my second largest position in my portfolio and I plan on holding it at least for 5 years. So far I have already collected in almost two years a total return from dividends alone of 23% while I am up on stock about 10%. I keep on seeing it as a potential 2x and this is why I keep on buying it during its dips.
Be the first to comment