

jetcityimage
Given the state of the economy, particularly when it comes to inflation, you might think that an extreme-value retailer would be the type of company to thrive. From a sales perspective, this might be true. But even on the extreme value side, the retail space has been negatively impacted by margin compression. A great example of this can be seen by looking at Ollie’s Bargain Outlet Holdings (NASDAQ:OLLI). The most recent fundamental data available from management suggests that the bottom line of the company is looking rather weak. This has, in turn, driven up the company’s trading multiples, making it less attractive for investors for now. Ultimately, I suspect that the company will come out of this situation just fine. And in the long run, I view it as having attractive upside potential. But given where shares are today and factoring in that the economic pain for consumers might be greater than I previously anticipated, I do think it’s worth downgrading the company from a ‘hold’ to a ‘sell’.
A recalibration in expectations
Back in August of this year, I wrote an article that took a rather neutral stance on Ollie’s Bargain Outlet. I acknowledged that the company had taken a hit in the first quarter of 2022 after already having experienced some weakness during 2021. I did ultimately conclude that a return to the kind of fundamental performance achieved back in 2020 would result in attractive upside for shareholders. And it was for this reason, combined with my view that market conditions would improve, that led me to rate it a ‘hold’, reflecting my belief at that time that shares would generate performance that more or less matched the broader market for the foreseeable future. Since then, things have not gone exactly as I would have hoped. While the S&P 500 is down by 4.8%, shares of Ollie’s Bargain Outlet have dropped by 10.6%.
Author – SEC EDGAR Data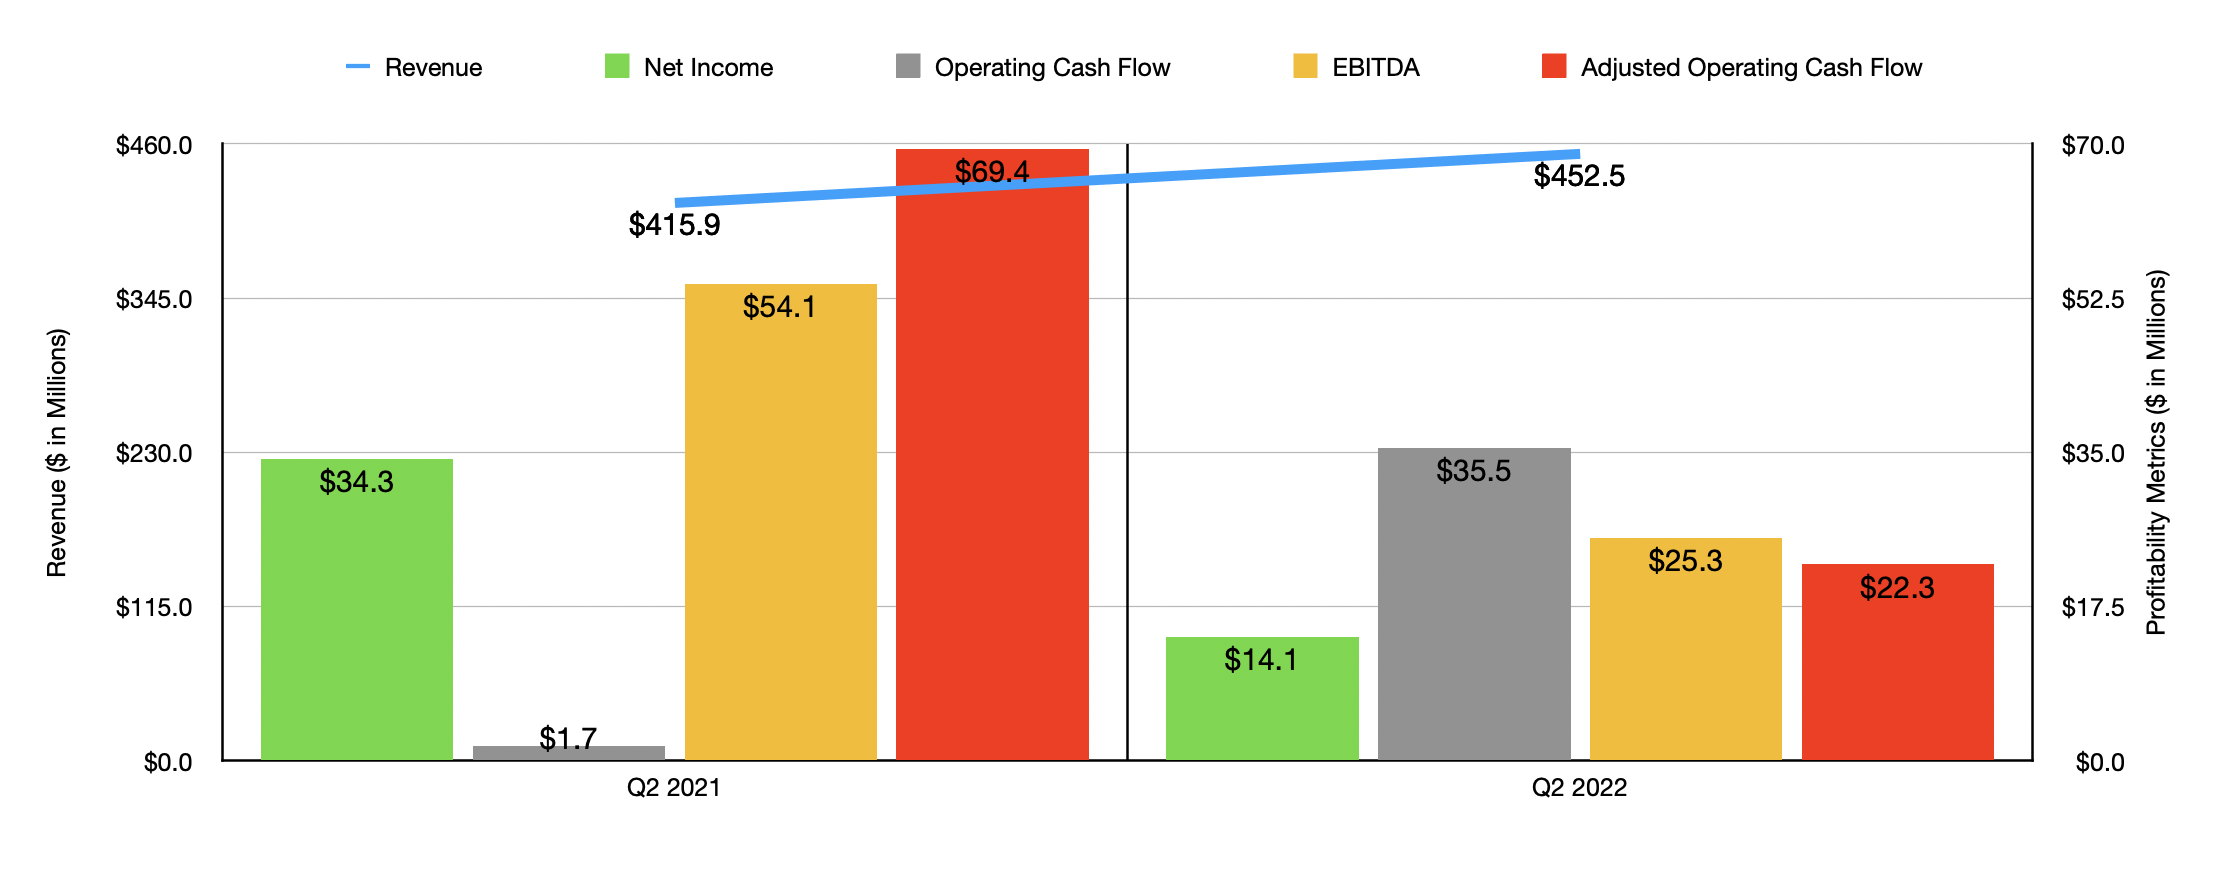
This return disparity has not been without cause. To best understand what transpired, I would like to point to data covering the second quarter of the 2022 fiscal year. This is the only quarter for which we have new data available that was not available when I last wrote about the company. During that time, sales came in at $452.5 million. That’s 8.8% higher than the $415.9 million generated the same time last year. The company really benefited on this front from two different things. First and foremost, it saw an increase in the store count, with the number of locations in operation rising from 409 in the second quarter of 2021 to 449 the same time this year. And second, the company reported comparable store sales growth of 1.2%. This comparable store sales increase was driven by a rise in the average transaction size. At the same time, however, it was offset some by a decrease in the number of transactions. We don’t really know specifics beyond this point except that we know that lawn and garden, health and beauty aids, hardware, and food, were all areas of strength for the company while summer furniture, toys, and floor coverings were areas of weakness.
Author – SEC EDGAR Data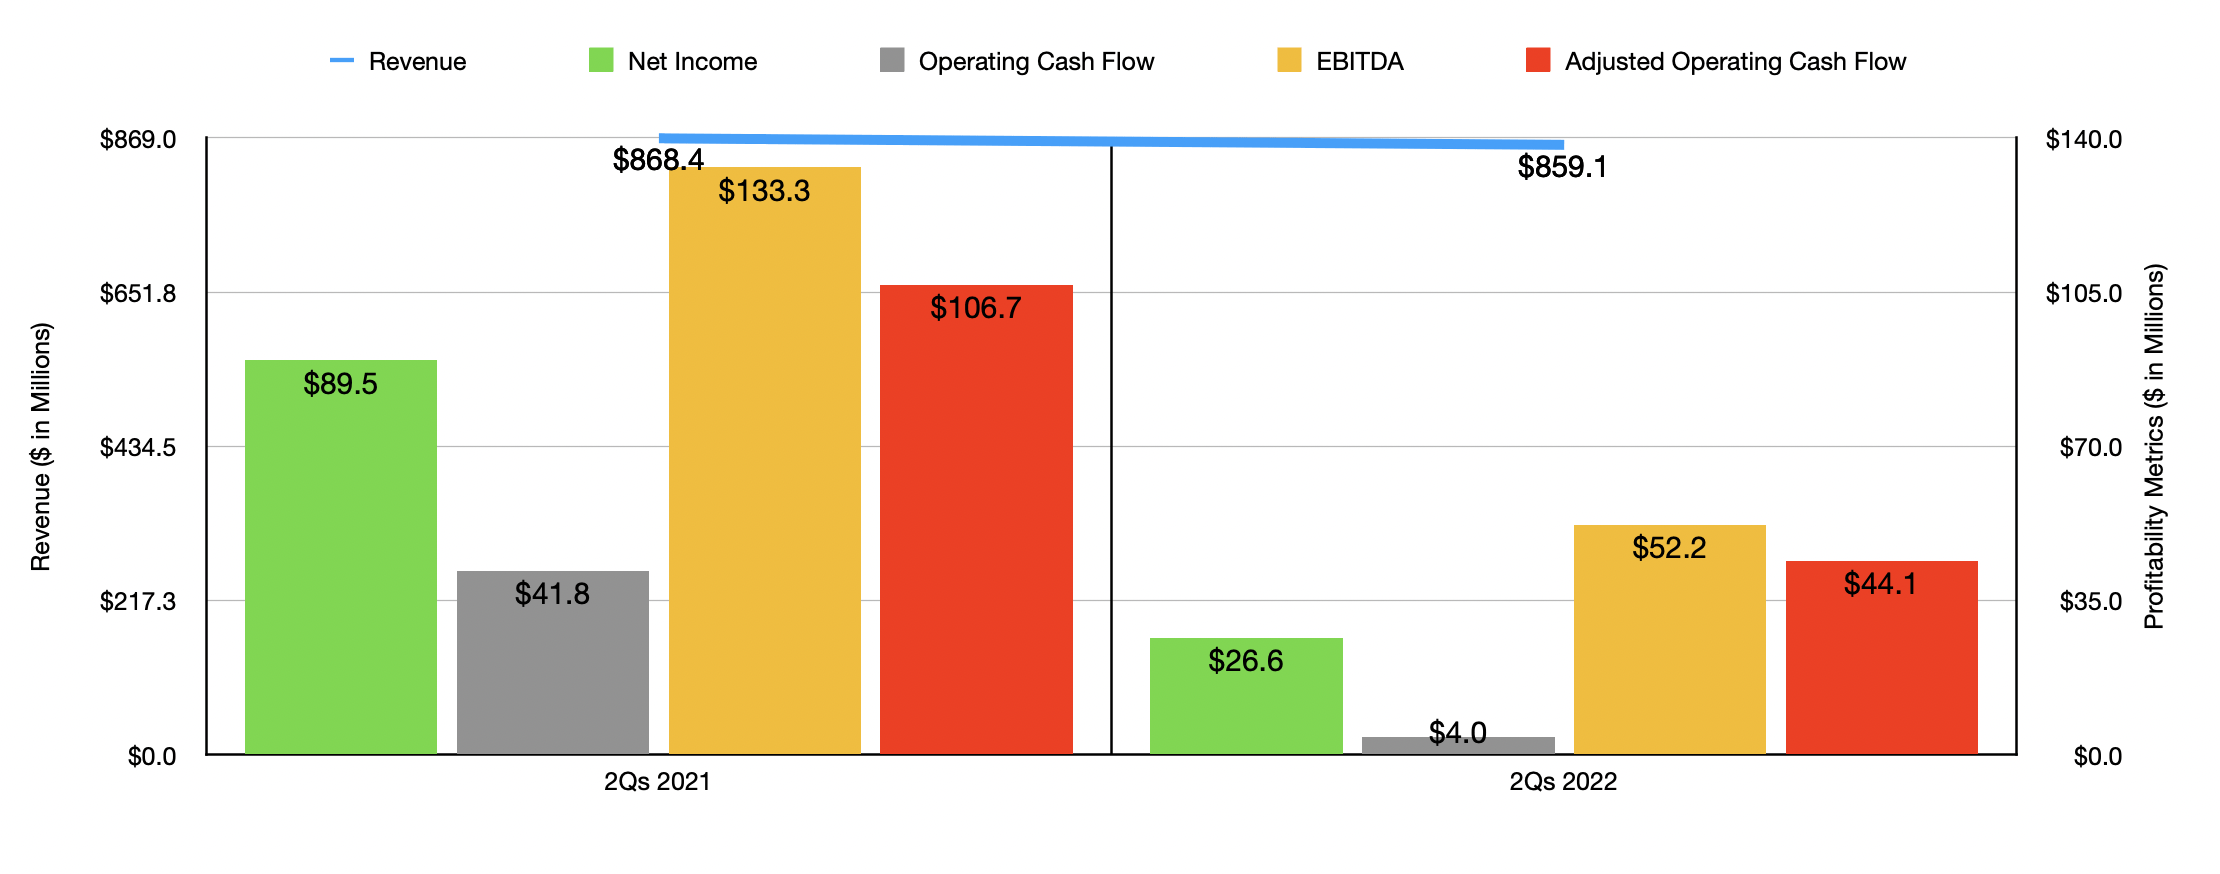
On the bottom line, the picture for the company, unfortunately, did not follow the same trajectory. Net income in the latest quarter totaled $14.1 million. That’s less than half the $34.3 million generated in the second quarter of 2021. This was driven in large part by a decrease in the company’s gross profit margin from 39.2% to 31.7%. According to management, this was driven largely by increased supply chain costs, mostly due to higher import transportation and labor costs. The company also saw a modest decrease in its merchandise margin during this time. Other profitability metrics largely followed suit. Admittedly, operating cash flow did rise year over year, jumping from $1.7 million to $35.5 million. But if we adjust for changes in working capital, it would have plunged from $69.4 million to $22.3 million. Even EBITDA took a tumble, more than halving from $54.1 million to $25.3 million. Naturally, the weakness the company experienced on its bottom line reflected in results for the first half of the 2022 fiscal year in its entirety. This much can be seen in the chart above.
For the 2022 fiscal year in its entirety, management has revised expectations a bit lower. Revenue is now forecasted to be between $1.843 billion and $1.861 billion. When I last wrote about the firm, guidance was for sales to be between $1.87 billion and $1.90 billion. Comparable store sales should now drop by between 1.5% and 2.5%. The number of new stores in operation should come in and between 41 and 43. That’s down from the 46 to 48 management previously anticipated. And the adjusted net income for the company, which excludes the excess tax benefit related to stock-based compensation of about $1 million per quarter, should be between $109.5 million and $113 million. Prior guidance provided by management called for this number to be between $115 million and $125 million. These decreases, naturally, played a role in my own downward revision for the business. No guidance was given when it came to other profitability metrics. But appropriate estimates would be for adjusted operating cash flow to be around $148.2 million and EBITDA to total $156.3 million.
Author – SEC EDGAR Data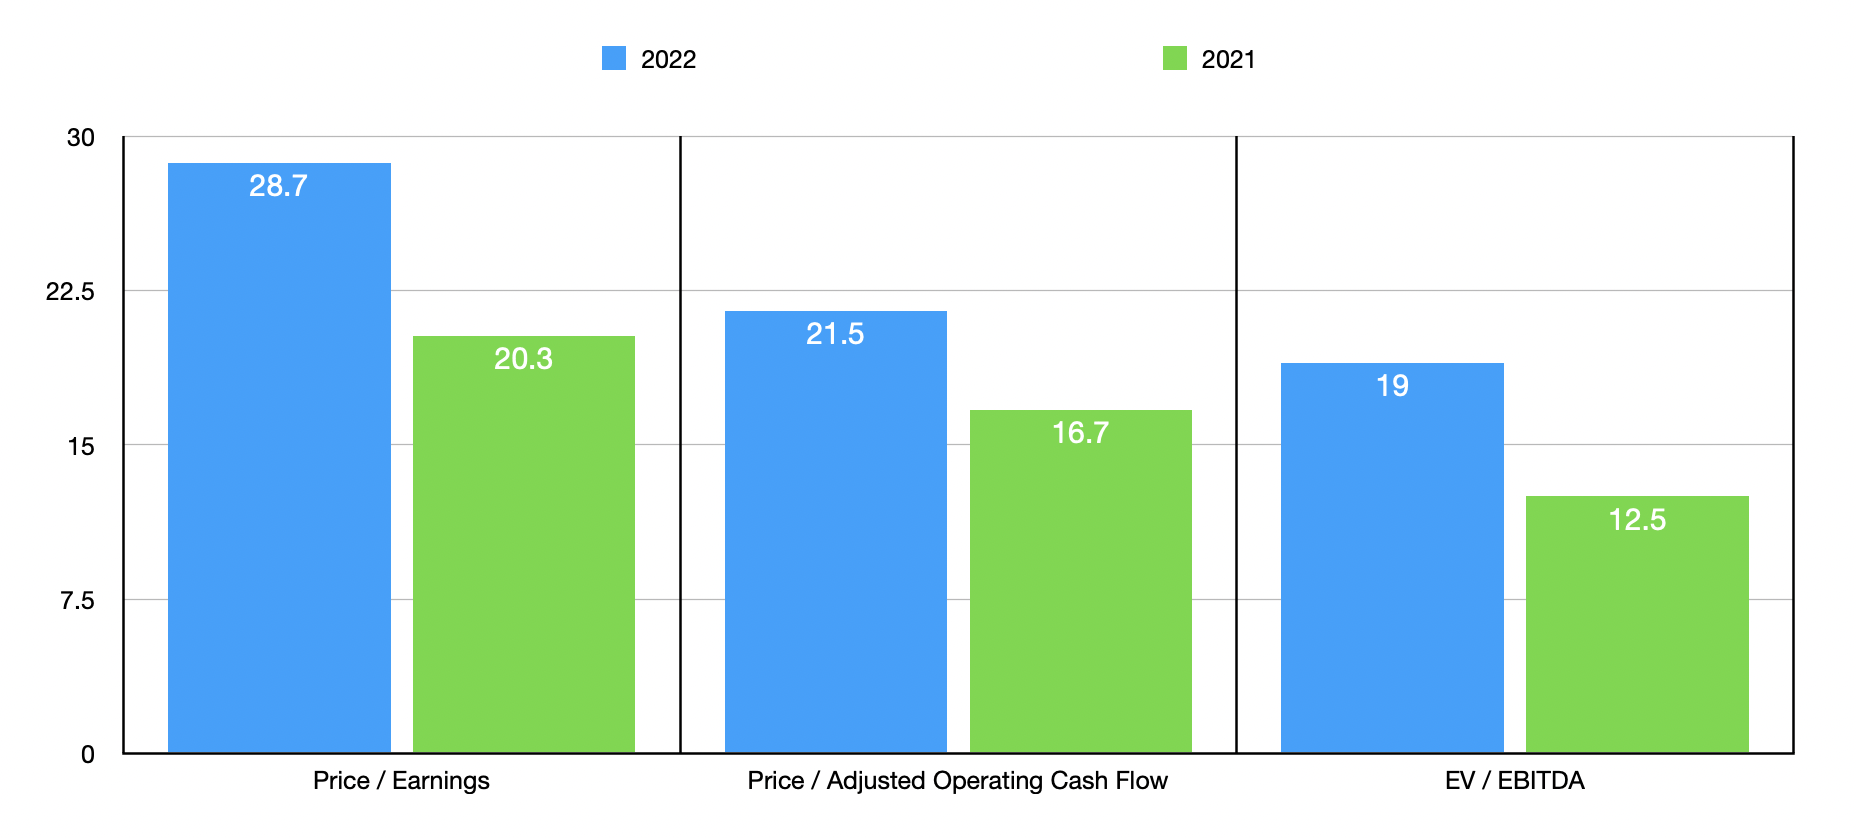
Using these figures, the company is trading at a forward price-to-earnings multiple of 28.7. The forward price to adjusted operating cash flow multiple should be 21.5, while the EV to EBITDA multiple should come in at around 19. Using the data from 2021 instead, these multiples would be 20.3, 16.7, and 12.5, respectively. As part of my analysis, I also compared the company to five other value retailers. On a price-to-earnings basis, these companies ranged from a low of 9.2 to a high of 24.7. Using the EV to EBITDA approach, the range was between 5.4 and 16.4. In both of these cases, our prospect was the most expensive of the group. Meanwhile, using the price to operating cash flow approach, the range was between 5.3 and 30.4. In this scenario, three of the five companies were cheaper than Ollie’s Bargain Outlet.
| Company | Price / Earnings | Price / Operating Cash Flow | EV / EBITDA |
| Ollie’s Bargain Outlet Holdings | 28.7 | 21.5 | 19.0 |
| Franchise Group (FRG) | 17.0 | 19.7 | 5.4 |
| Big Lots (BIG) | 9.2 | 5.3 | 8.2 |
| Dollar Tree (DLTR) | 23.5 | 30.4 | 13.7 |
| Dollar General (DG) | 24.7 | 22.9 | 16.4 |
| Target (TGT) | 19.7 | 15.9 | 10.6 |
Takeaway
What date do we have today suggests to me that the fundamental condition of Ollie’s Bargain Outlet is worsening. It is true that the company has cash and cash equivalents in excess of debt totaling $216.61 million. That means that the overall risk to shareholders of a permanent loss of capital is incredibly low. But there is a meaningful risk of continued underperformance relative to the broader market. Bottom line deterioration is more than enough to offset higher revenue. Eventually, the picture for the company will change. But honestly, I think that the situation will get worse before it gets better. And because of that, I do believe that it makes more sense as a soft ‘sell’ than as a ‘hold’ at this time.
Be the first to comment