

binabina/E+ via Getty Images
Gabelli Funds’ GAMCO Global Gold, Natural Resources & Income Trust (NYSE:GGN), with its investments in mining and traditional energy, seems poised for growth in the coming year or two. The stars are aligning, perhaps simultaneously, giving investors a chance to reach up. Grab a coat, a hat and head out the door. Smart investors, raise your hands high, look up, and gaze at the amazing view.
The Fund
Global Gold, one of the Gabelli’s closed-end funds (“CEFs”), consists primarily of three types of assets, cash at 21%, traditional energy at 35%, and finally mining including precious metals at 42%. Company names include Exxon Mobil (XOM), Newmont Corp. (NEM), Barrick Gold (GOLD), Shell (SHEL), Chevron (CVX), Freeport-McMoRan (FCX) and others. The fund also sells covered calls to increase cash returns. It also has paid a three cent per month dividend for approximately the last three years. Investment approaches with this type of narrow focus offer investors a unique opportunity for both capital and cash payments during synergistic years.
We believe that one of these has begun. For example, since the end of September, the Net Asset Value of the fund increased from $3.37 (page 28) to $4.07 on January 13th. Investors need to remember the price will follow the NAV more than the dividend. We also believe that loftier heights are approaching. Just look into the sky.
Gold Correlations
With just two primary types of investments, mining/precious metals, and oil plus oil services, to review, we begin with precious metals. Understanding critical correlations plays an essential role for predicting the future.
When the Federal Reserve increases the Federal Funds rate, it typically increases interest rates throughout the economy, an obvious concept. What comes next, though obvious, is the relationship of higher interest rates and an increased value of the dollar. With that in mind, the following chart for the price of gold vs. the value of the dollar illustrates an inverse relationship.
MacroTrends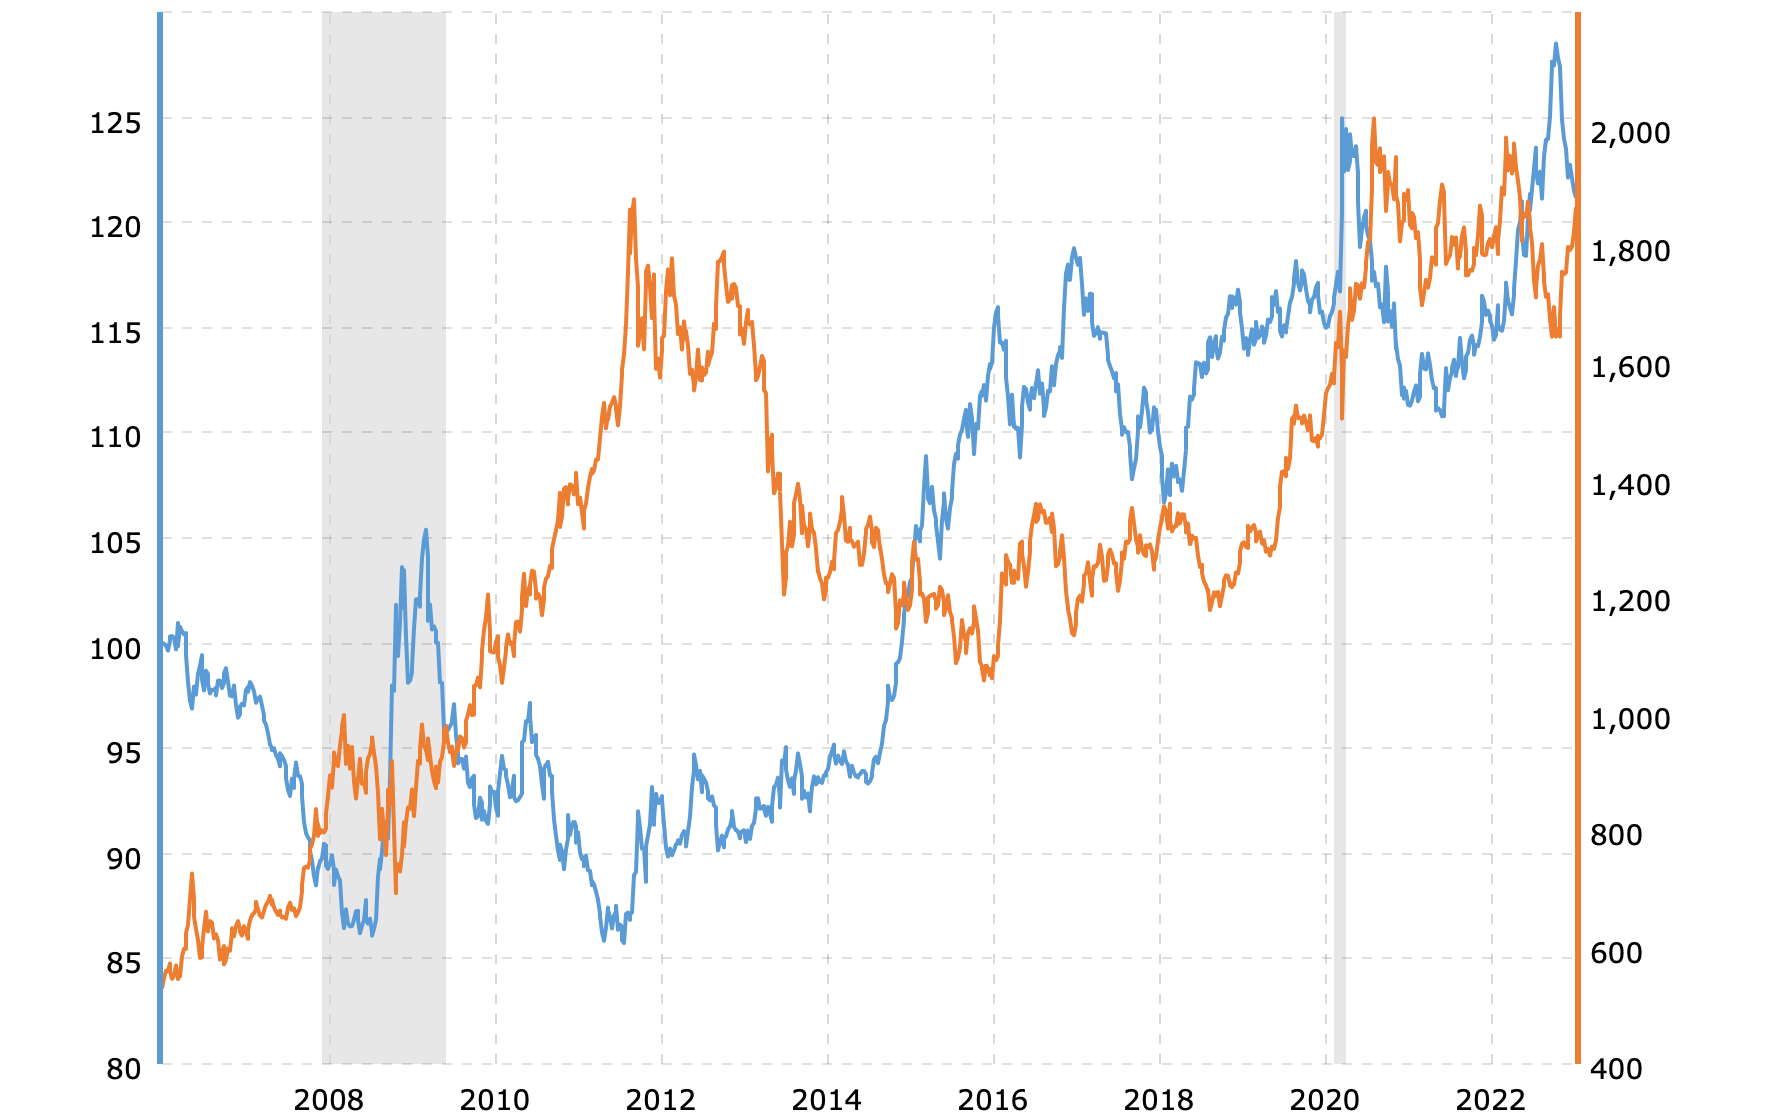
Next, our discussion illustrates, in a simple fashion, the correlation between gold prices and gold stocks. We choose one example, Newmont vs. gold.
Gold Price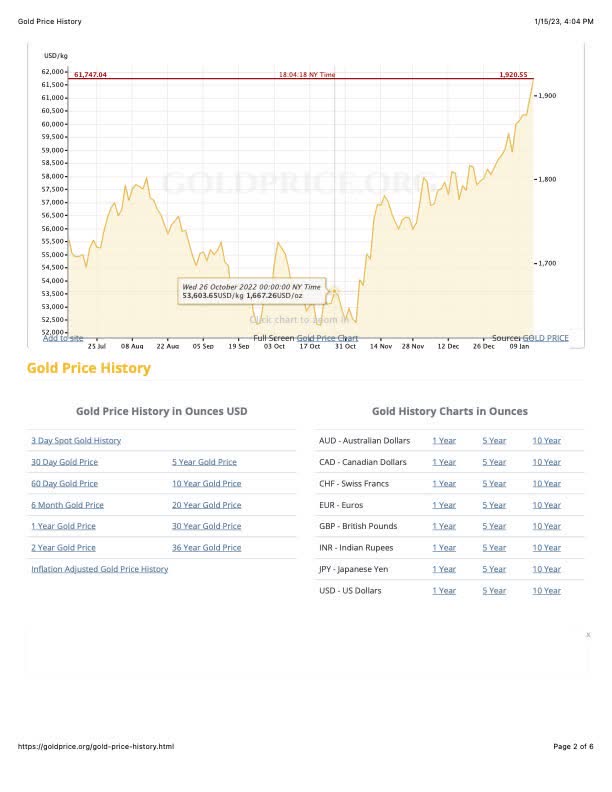
We created the following two-hour bar chart of Newmont using TradeStation Security software.
TradeStation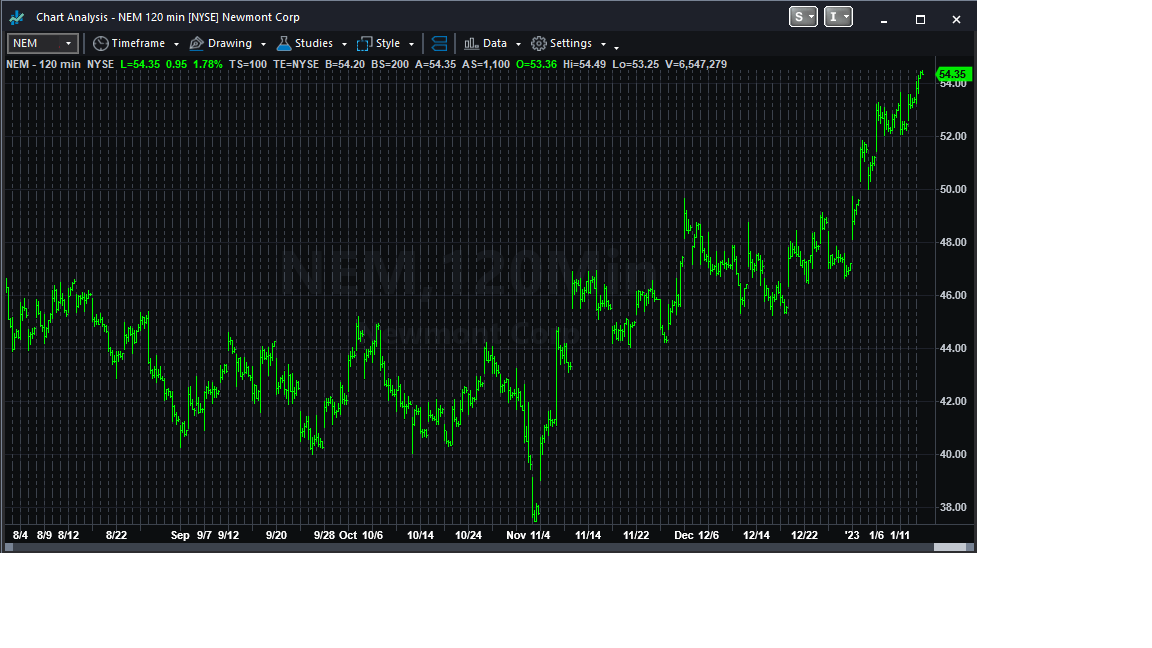
Again, the obvious correlation appears with great clarity. Before this discussion continues, TradeStations’ TradingView posted a technical discussion for gold:
“In conclusion, gold has recently managed to make a higher low, escape a falling trendline, rally and challenge major resistance. It’s done this despite news that should be bearish. That could raise the question of whether a bigger and more historic move could be starting.”
The Federal Reserve seems posed to continue interest rate hikes, but the number and magnitude seem limited. One report stated:
“The Fed’s key benchmark borrowing rate is projected to rise another three-quarters of a percentage point in 2023, hitting a 17-year high of 5-5.25 percent from its current 4.25-4.5 percent level, according to the Fed’s median projection from December.”
When rates begin to stabilize then fall, the dollar will likely follow at some correlative value, pressuring increases in precious metals. Investors should remember that not all of the mining assets within Gold are precious metals, but many are, and those changes will pressure increases in NAV.
Future Crude Oil Prices
The price crap shoot now playing out in the crude oil and products marketplace, demand vs. supply, supply being extremely short for current levels of the economy or even growth, creates a war-like environment between analysts.
One major analysis group, Barclays, stresses downside risk driven by possible extreme manufacturing downside.
“Given the challenging macroeconomic backdrop [we] highlight $15-25/barrel of downside to our forecast if the slump in global manufacturing activity worsens similar to the 2008-09 episode,” Barclays said, adding that it “would imply 1-2 million barrels per day downside to our demand estimates.”
The Barclays’ change of $15-$25/barrel was from its previous of $98. The banking firm’s new average ranges in the $75-$85 range.
It is important to note that in the past 2/3rds of a year, the U.S. has averaged slightly more than 1 million barrels per day in shortages to meet demand, dropping 225 million barrels from its SPR.
A more broad estimate from several analysts predicts $87 for 2023 and $90 for 2026.
The bull, Goldman Sachs, predicts $100 plus by year’s end, primarily driven by crude uptake in China. “World oil demand is set to increase by 2.7 million barrels per day (bpd) in 2023 and the market would return to deficit in the second half of the year, the U.S. investment bank said in a note…”
To show the coloration, we included the following five-year crude oil chart for from MacroTrends followed by chart of Chevron.
MacroTrends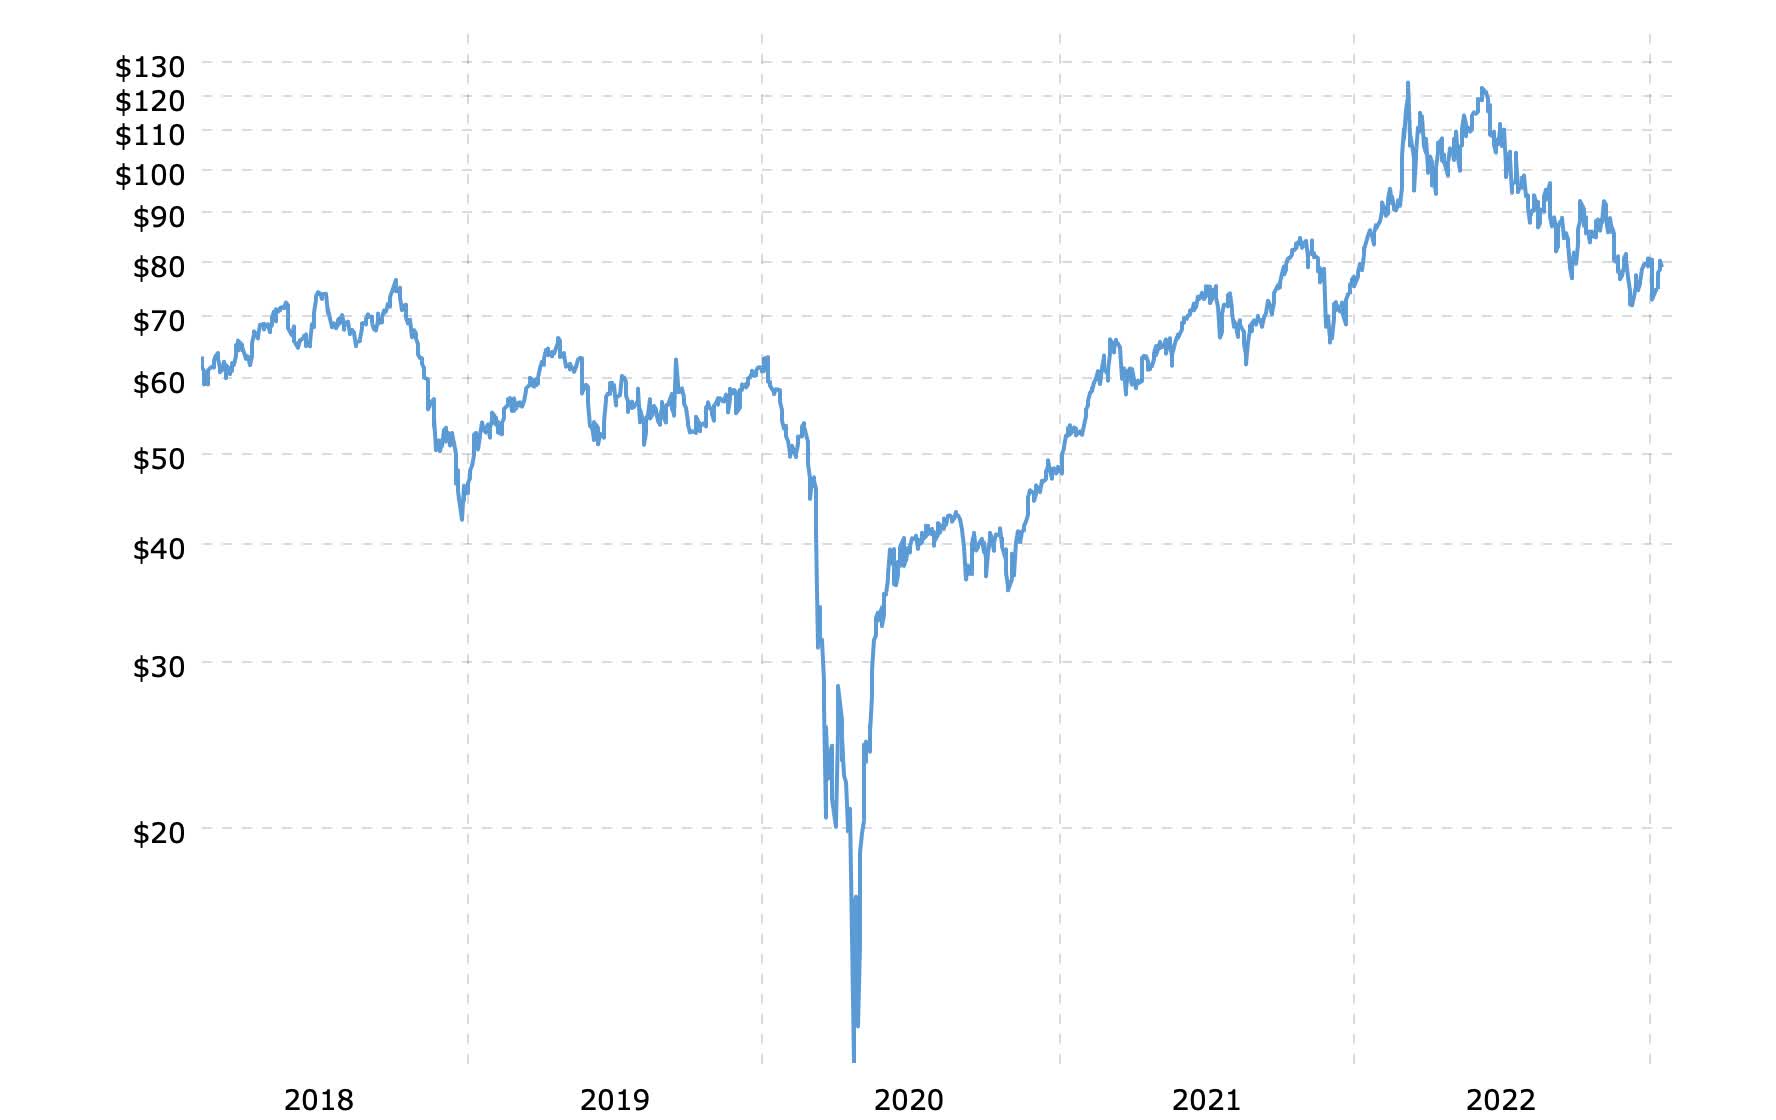
TradeStation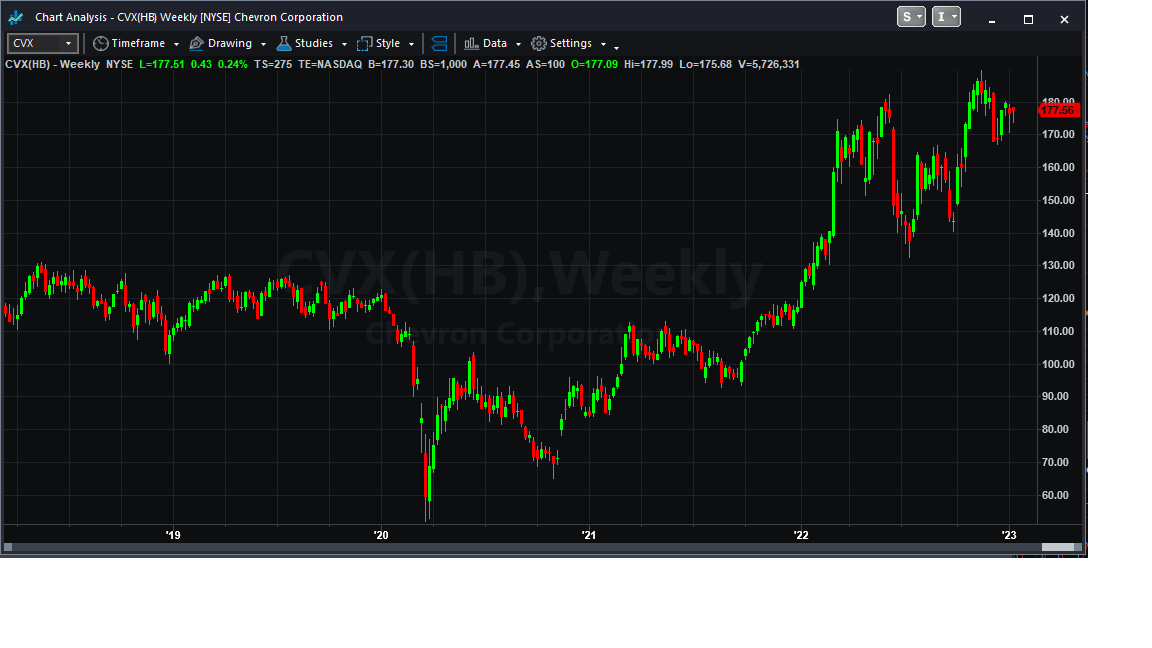
Comparing the two price charts, the correlation between crude pricing and companies directly in the crude oil space, becomes clear. Of course, none of this is rocket science, but reviewing fundamentals is always important in investing.
Even with a variety of opinions for pricing crude, we suspect that Goldman’s analyst might be the most actuate barring a severe recession. Continuing, the analysts states:
“Commodities are set to be the best-performing asset class in 2023, the bank’s strategists said. The first quarter of 2023 could be more underwhelming than the rest of the year due to the expected slowdown in economies, but the low levels of investment in oil, gas, and key metals will continue to underpin what Goldman has called a new super-cycle in commodities.”
The target timing seems to be in the later part of spring through summer, following into the fourth quarter of 2023.
Evaluating Gold’s two Sectors
Looking forward, it appears that both sectors, crude oil/fossil fuel, and mining/precious metals, are gearing up toward increased prices at approximately the same time. With falling interest rates possible and crude price increases likely in the later part of the year, Gold’s NAV will continue to increase. We aren’t expecting higher dividends during the increase, thus the yields will fall. Nevertheless, investors will get paid to wait at $0.36 per year. The stars seem to be aligning, creating a unique investment opportunity.
Investors might question about how high the NAV might increase. We don’t have crystal balls, but a few indicators or facts can help. Gold, the fund, reached a high of $4.6 in the past five years. The metal gold has had two inflationary period runs. The first was 10x back in the ’80s. The more recent one was 6x. Noted above, the markets have transitioned from deflationary to inflationary.
Risk
Risks still exist. In our view, the most significant is a steep recession, cutting significantly the demand and thus the price of crude. On the other side, many world governments seem to be stockpiling gold and other precious metals, creating stable to increasing precious metal markets.
Another risk comes with GGN writing covered calls on its holdings. The company participates in this practice, which from the last report showed that a small number were exercised at losses, i.e., the stock price ran past the strike price before the expiration date. Yet, this is a conservative fund, when considering the economic environment.
We rate this a buy, changing to a strong buy on weakness. We believe that the GGN NAV will increase at least for the next year and maybe further into the future. We welcome other opinions.
Be the first to comment