

inhauscreative/E+ via Getty Images
Investment Thesis
The recessionary fears have obviously digested Star Bulk Carriers Corp.’s (NASDAQ:SBLK) previous rally by a drastic -24.82% since our previous Hold rating in August 2022. With the S&P 500 Index also plunging by -24.69% YTD, it is evident by now that Mr. Market is very concerned about the potential destruction of demand, triggering even more pessimistic sentiments in the short term.
The relatively robust US labor market in September is not helping matters as well, since the payrolls increased by 263K and the unemployment rate fell by 3.5% sequentially. Therefore, it is not overly downbeat to assume that the September CPI to be released by 13 October 2022 will likely still show elevated inflation rates. Thereby, triggering more pain for the stock market in general, with 78.8% of analysts projecting another 75 basis point hike for the Fed’s November meeting.
The market may also overreact from SBLK’s upcoming FQ3’22 earnings call, due to the lesser available days impacting its top and bottom lines growth, significantly worsened by the tougher QoQ and YoY comparison. Therefore, potentially triggering another drastic correction to the mid $10s in the short term.
Do Not Be Fooled By The Slight Decline In FQ3’22
S&P Capital IQ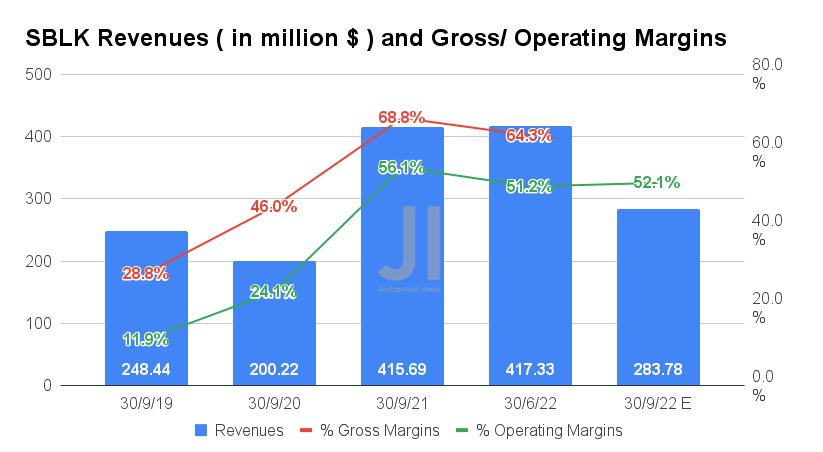
For the upcoming FQ3’22 earnings call, SBLK is expected to report revenues of $283.78M and operating margins of 52.1%, indicating a massive decline of -32% though an increase of 0.9 percentage points QoQ, respectively. However, the fall in its revenue is notably attributed to the increased dry-docking days in the next quarter by 35.96% QoQ and BWTS installations by 37.33% QoQ, instead of the perceived destruction of demand.
With 61% of SBLK’s available Q3 days booked at a TCE of approximately $29K/ day per vessel, SBLK would still perform relatively well, in comparison to FQ3’21 TCE rates of $30.62K, FQ3’20 of $13.08K, and FQ3’19 of $14.68K.
S&P Capital IQ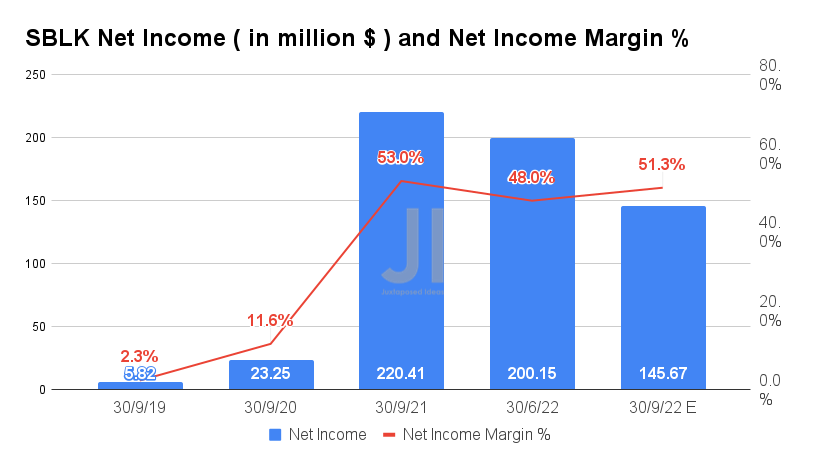
Naturally, due to the reduced available days in FQ3’22, SBLK would report impacted profitability, with net incomes of $145.67M and net income margins of 51.3%. This would indicate a notable decline of -27.21% though an improvement of 3.3 percentage points QoQ, respectively. We also expect a short-term impact on its cash flow from operating activities at approximately $198.20M for the upcoming quarter, compared to $239.9M reported in FQ2’22.
However, we expect a much stronger quarter for SBLK in FQ4’22 indeed, due to the improved available days and massive demand for coal throughout the difficult winter ahead, without the aid of Russian coal/oil/gas. Let’s see during its upcoming earnings call.
SBLK Continues To Report Stellar Top & Bottom Lines Growth Despite Normalization
S&P Capital IQ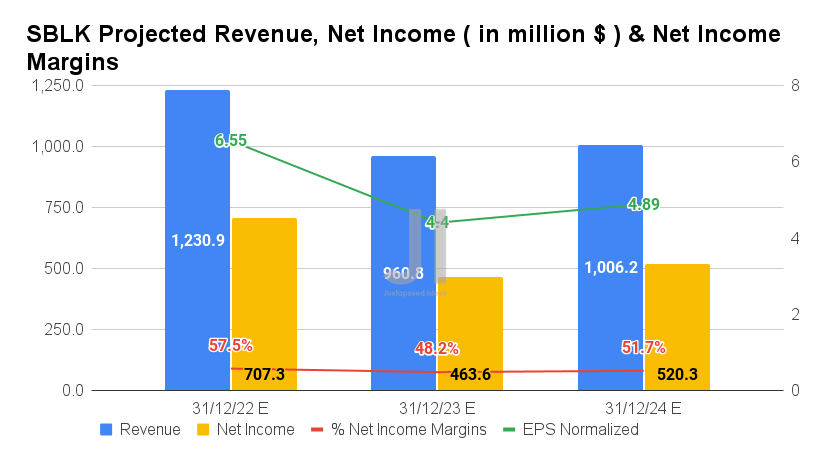
SBLK is expected to report an adj. revenue and adj. net income growth at a CAGR of 4.14% and 100.15%, respectively, between FY2019 and FY2024. It is apparent that the worsening macroeconomics and falling charter rates have also impacted its forward estimates, with analysts downgrading its profitability by -14.77% for FY2023. Nonetheless, we must still highlight the massive improvement in its profitability, from net income margins/EPS of -0.3%/$0.26 in FY2019, to 30.3%/$6.82 in FY2021, and finally to 51.7%/$4.89 by FY2024.
In the meantime, consensus estimates have also downgraded SBLK’s FY2022 performance by -6.31%, with revenues of $1.23B and net incomes of $707.3M. It indicated a YoY decline of -13.38% though an increase of 3.93%, respectively. Despite the exemplary earnings in H1’22, it is no wonder that the stock has suffered multiple pullbacks, given the market’s fears of falling charter rates. Its stock recovery will be critically hinging on SBLK’s FQ4’22 booking levels and charter rates indeed.
S&P Capital IQ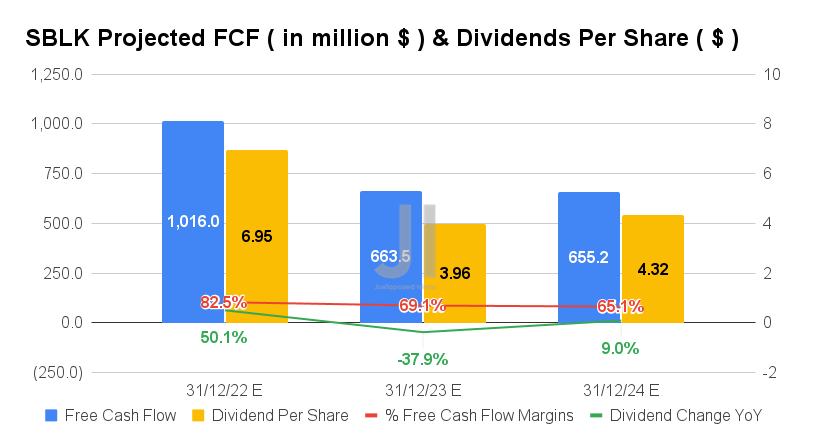
After the $1.01B windfall in FY2022, SBLK is expected to report a normalized FCF generation of $663.5M in FY2023 and $655.2M in FY2024. However, it is also important to note that these levels still represent a massive overperformance from pre-pandemic FCF generation of -$258.62M in FY2019, while being in line with peak pandemic levels of $636.92M in FY2021. These directly translate to SBLK’s improved annual dividend payouts of $3.96 in FY2023 and $4.32 in FY2024, compared to $0.05 in FY2019 and $2.25 in FY2021. As a result, justifying its stock premium against pre-pandemic levels.
In the meantime, we encourage you to read our previous article on SBLK, which would help you better understand its position and market opportunities.
- Star Bulk Carriers: Brilliant Execution, But Uncertainty Looms
So, Is SBLK Stock A Buy, Sell, or Hold?
SBLK 5Y EV/Revenue and P/E Valuations
S&P Capital IQ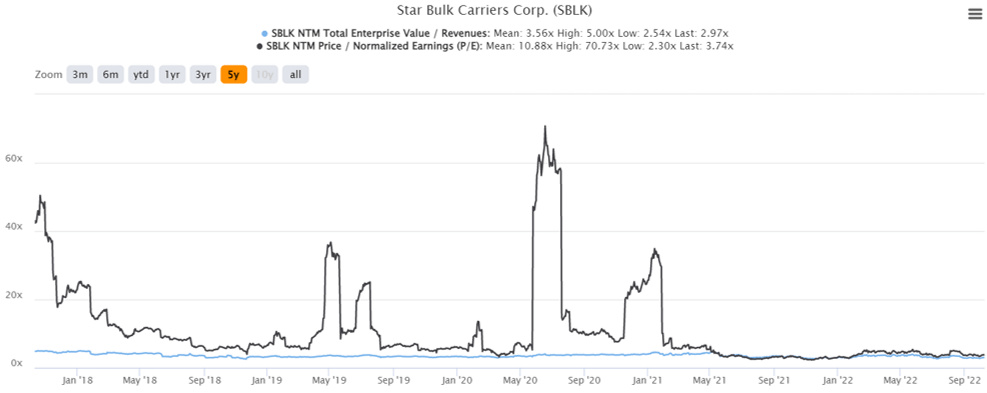
SBLK is currently trading at an EV/NTM Revenue of 2.97x and NTM P/E of 3.74x, lower than its 5Y mean of 3.56x and 10.88x, respectively. The stock is also trading at $19.26, down -43.33% from its 52 weeks high of $33.99, though at a premium of 14.30% from its 52 weeks low of $16.85. Nonetheless, consensus estimates remain bullish about SBLK’s prospects, given their price target of $33.00 and a 71.34% upside from current prices.
SBLK 5Y Stock Price
Seeking Alpha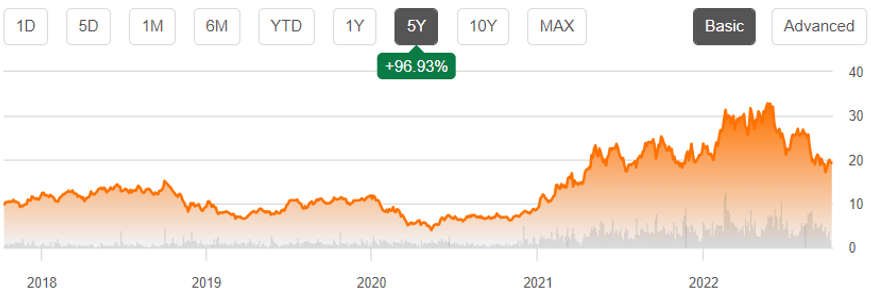
Given the factors discussed above, we may see another retest of SBLK’s September bottom in the short term. Otherwise, a more tragic plunge to the mid $10s, if its charter rates continue to fall as well. However, that time of maximum pain would also provide investors with higher risk tolerance with an excellent entry point for long-term portfolio growth and investing. The deal is made especially sweeter with a stellar 46.33% dividend yield. At that time, we rate SBLK stock as a definite Buy.
Be the first to comment