

Adriana Romanova
Star Bulk Carriers Corp. (NASDAQ:SBLK) stock price decreased by 8% in the last month as global iron ore shipping volumes declined. Due to weaker dry bulk market conditions, SBLK’s financial and operational results in the second half of the year will not be as strong as in 2H 2022. However, even with the current market condition, which is supported by the increased coal demand from European countries, environmental regulations, and low fleet growth rates, SBLK will stay profitable. The stock is a hold.
2H 2022 results outlook
The company’s cumulative adjusted EBITDA increased from $278 million in 3Q 2021 to $1117 million in 2Q 2022. Also, the company’s adjusted net debt decreased from $1407 million on 30 June 2021 to $1005 million on 30 June 2022. Moreover, its cash & liquidity increased from $283 million on 31 June 2021 to $386 million on 30 June 2022.
SBLK is the largest U.S.-listed dry bulk company with 128 high-quality vessels. “94% of Star Bulk’s fleet is equipped with scrubbers, providing leverage to increasing fuel price spreads and a strong competitive advantage during downturns,” the company announced in its September 2022 presentation. However, despite the significant financial and operational results in the first half of 2022, I expect weaker results for the second half of the year. According to MMI, China’s steel port shipments by domestic trade decreased by 27% WoW to 6.28 million mt in the week ending 7 October 2022 (see Figure 1). Moreover, Chinese shipments by ports outside China decreased by 7% to 1.69 million mt in the week ending 7 October.
According to Figure 2, global iron ore shipments decreased by 4.6% WoW to 30.47 million mt in the week ending 9 October 2022, driven by lower shipments from Australia to China (down 8.8% WoW). In the week ending 9 October 2022, total iron ore shipments have decreased by 1.09 million mt WoW and 5.68 million mt YoY (see Figure 3).
Figure 1 – China steel port shipments under domestic trade
MMI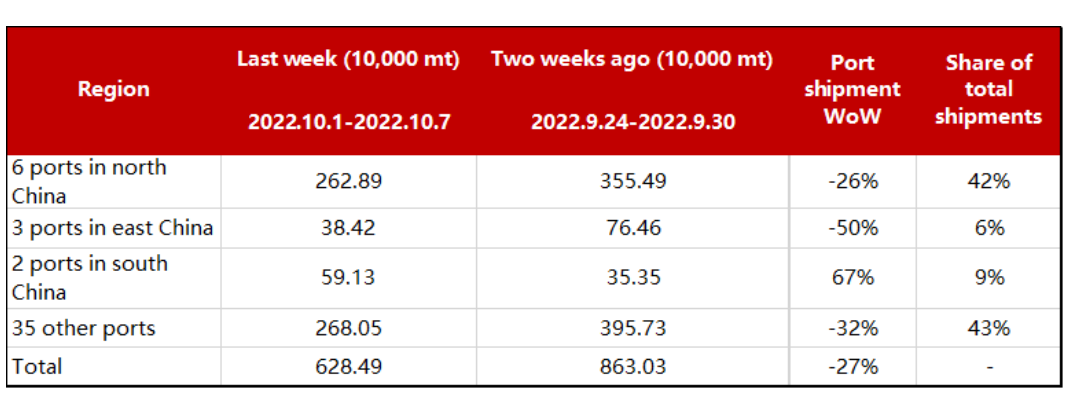
Figure 2 – Global iron ore shipments
MMI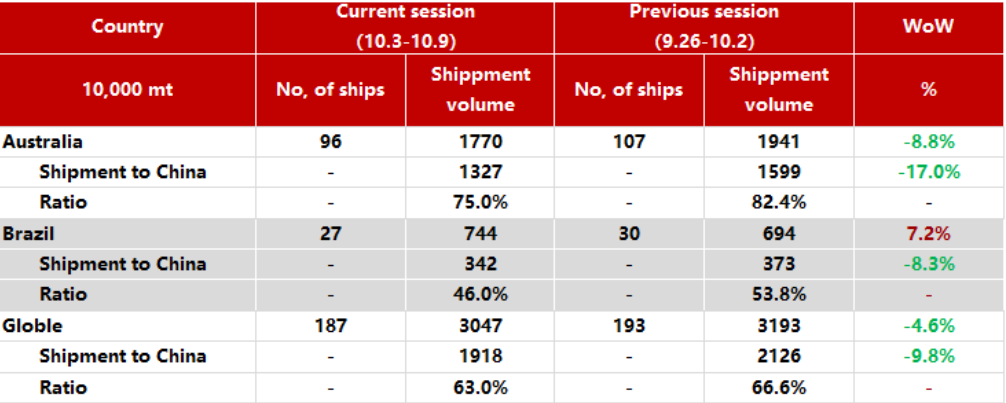
Figure 3 – Iron ore overseas shipments by variety
MMI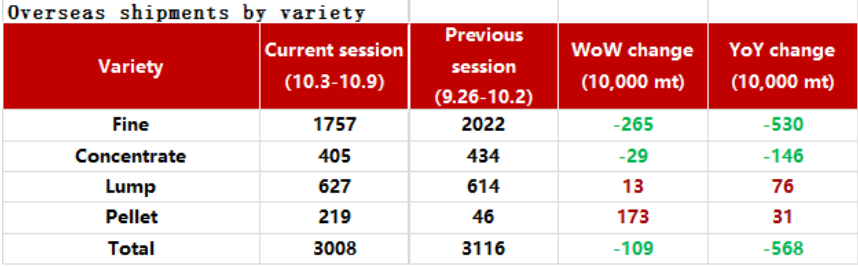
Thus, the company’s 2H 2022 results will not be as strong as in the first half of the year. However, even with the current market condition, SBLK can stay profitable. Also, it is important to know that China’s domestic stainless steel production increased by 21% MoM and 30% YoY to 2.76 million mt in September. MMI expects the overall supply and demand of stainless steel to rise in the following weeks. In September 2022, the daily output of steel in China increased by 2.73% MoM to 3.87 million mt.
The market outlook
The Baltic Dry Index dropped from 5526 on 4 October 2021 to 1082 on 22 August 2022, down 80%. However, in the last few weeks, the Index has bounced back to more than 1900. In the long term, the dry bulk shipping market will not be as strong as it was a year ago. On one hand, on the demand side, due to high commodity prices, high inflation, and global economic challenges, and on the supply side, due to lower port congestion, the fry bulk shipping market in 2023 will not be promising for dry bulk shipping companies. On the other hand, the environmental regulations and the low fleet growth will support the TCE rates. Global dry bulk newbuilding orderbook of about 7% is at 25-year lows as a percentage of the global fleet (see Figure 4).
According to the Manager Director of Maritime Strategies International (MSI), the dry bulk shipping market may experience some recovery in the next six months due to higher consumption of steel. Also, the demand for coal remains high as natural gas prices in the European Union hiked as a result of the war in Ukraine. Figure 5 shows that coal prices skyrocketed in 2022 due to increased demand. The war in Ukraine is still going on, and thus, due to high natural gas prices, the demand for coal will remain elevated. Recently, some European countries have announced plans to reactivate old coal power plants. Thus, the dry bulk shipping market is supported by the increased coal demand.
Figure 4 – Fleet growth rates are low
September 2022 presentation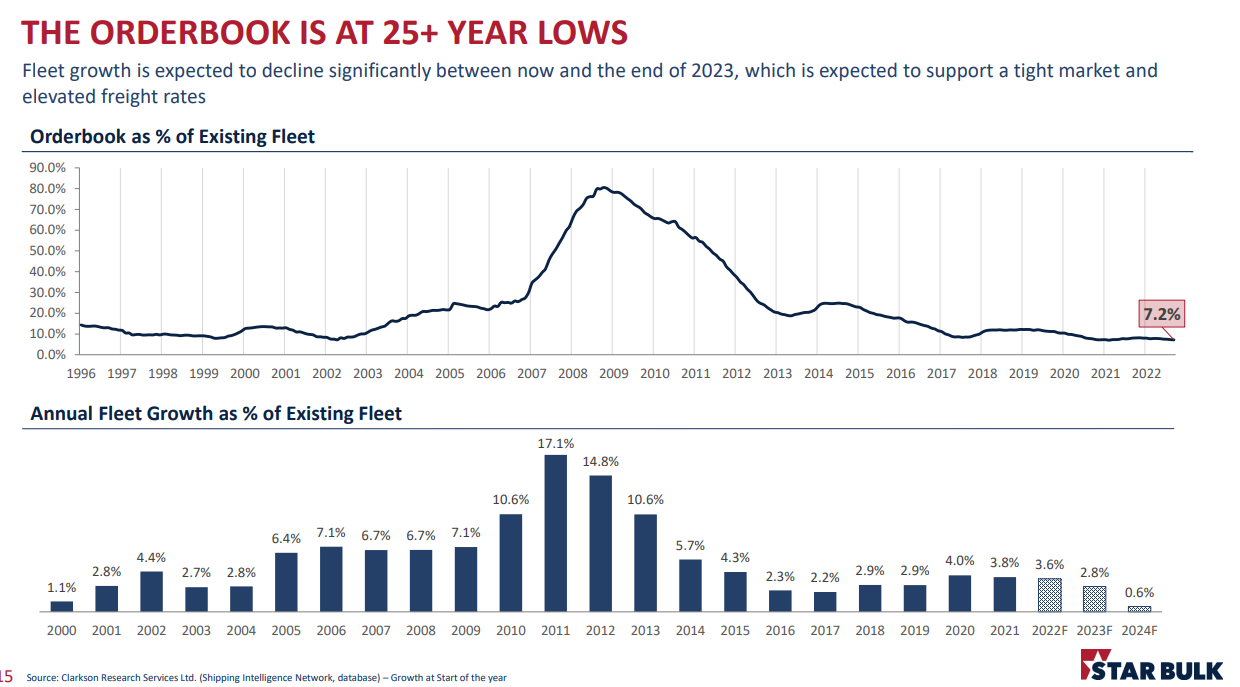
Figure 5 – Coal price
tradingeconomics.com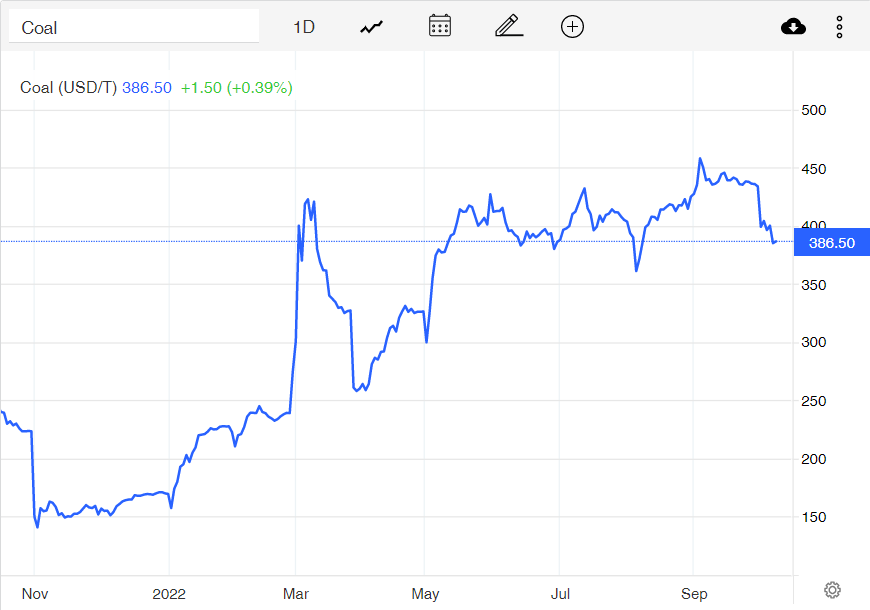
SBLK performance outlook
I looked at Star Bulk Carriers’ profitability ratios in this thorough article to assess how well the company can turn a profit and use its assets to make money for its investors. I have examined the profitability ratios (margin and return ratios) to provide useful insights into the financial health of the company.
In general, margin ratios evaluate the company’s ability to turn revenues into profits in a number of ways. It is clear that this dry bulk shipping company had lower gross profit and EBITDA margins compared with the end of 2021, 11% and 15% respectively. However, in comparison to its level of 0.62 in the second quarter of 2021, its gross profit margin improved slightly and sat at 0.64 in 2Q 2022.
Furthermore, SBLK’s EBITDA margin increased year over year from its level of 0.59 at the same time in 2021 to 0.61 in the second quarter of 2022. Examining the EBITDA margin has the advantage of excluding fluctuating costs and providing a clear view of the company’s performance. In summary, despite the decline in margin ratios during the recent quarters, it is anticipated that the company would increase its revenue, which will result in stronger margins, based on the rising demand for dry bulk shipping after the downturn of the COVID-19 pandemic (see Figure 6).
Figure 6- SBLK’s margin ratios
Author (based on SA data)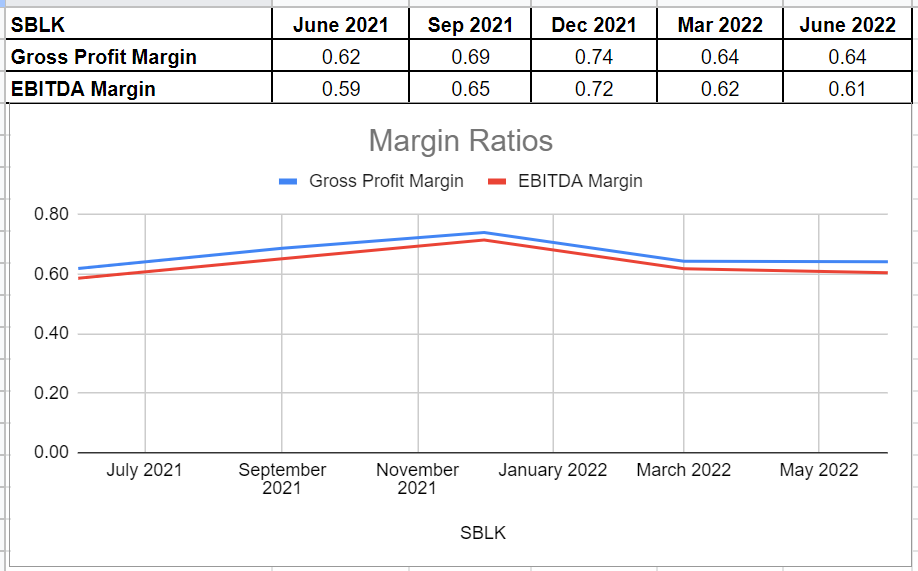
I looked into SBLK’s return on equity and return on assets ratios to show how well the company can tailor returns to its shareholders. The ROA ratio illustrates the amount of profit an organization may produce for each dollar of its assets. The ROA ratio for Star Bulk Carriers has been rising over the past year, which is a witness to the company’s scope of ability to recover. The return on assets for Star Bulk in the second quarter of 2022 was 5.5 % year-over-year compared to its value of 4.6% in the first quarter of 2022.
Additionally, its 2Q 2022 return on equity of 9.5% is above the ROE level of 7.07% at the same time in 2021. This ratio shows the company’s net income in relation to shareholders’ equity and is important since it calculates the rate of return on the capital invested in the business. This means that Star Bulk’s return ratios could indicate that the corporation has improved its return circumstances (see Figure 7).
Figure 7- SBLK’s return ratios
Author (based on SA data)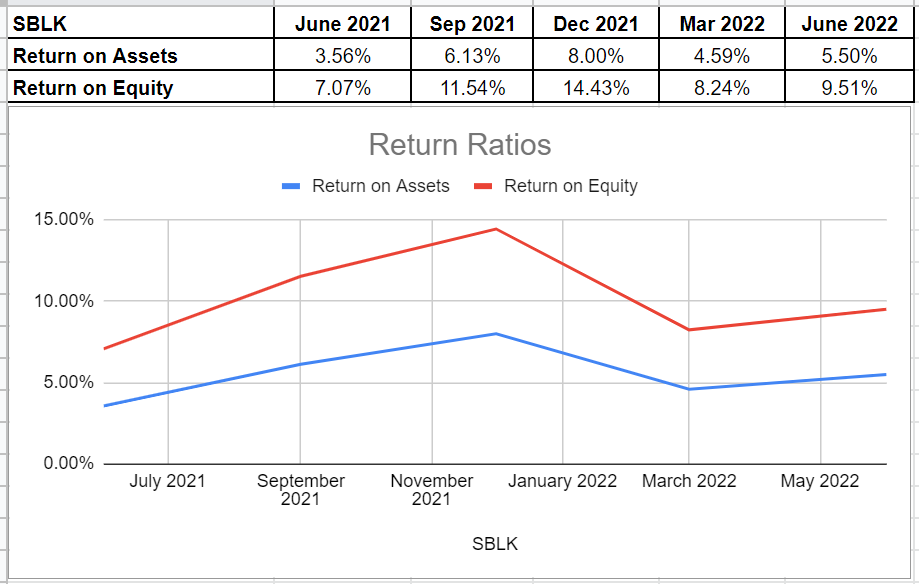
SBLK stock valuation
Updating the company’s valuation with the closest peers and using Comparable Companies Analysis (CCA) indicates that SBLK stock is still attractive. Comparing Star Bulk Carriers with other dry bulk competitors like Genco Shipping (GNK), Golden Ocean Group (GOGL), Eagle Bulk Shipping (EGLE), Navios Maritime (NM), and Grindrod Shipping (GRIN), I estimate that the stock’s fair value is about $20. This method reflects the real-market data and is an appropriate way to analyze SBLK for the sake of the company’s stability. To choose my peers, I considered dry bulk companies with similar sizes and financial conditions. Data was gathered from the most recent quarterly and TTM data (see Table 1).
Table 1 – SBLK’s financial data vs. its peers
Author (based on SA data)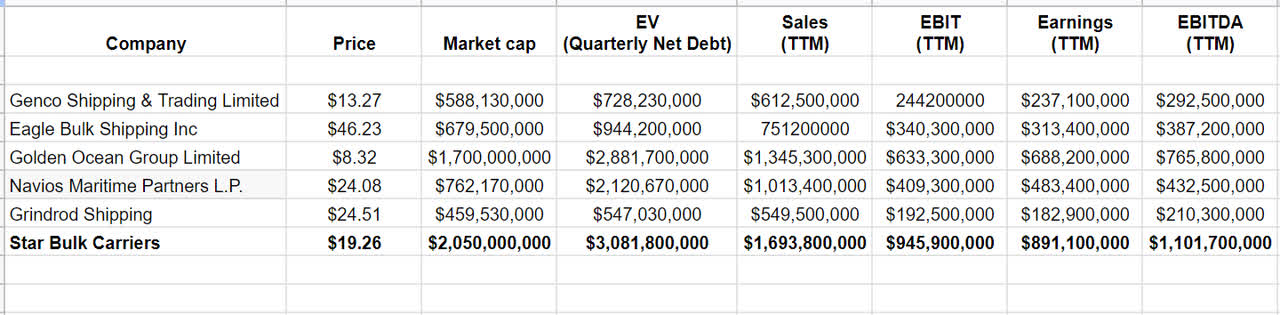
When looking at SBLK’s valuation ratios and comparing them with the peers, we can realize that Star Bulk is relatively attractive but I recommend waiting before making new decisions. The company’s EV/EBIT ratio is 3.26x, which is 11% lower than the peer’s average of 3.67x. It represents that the stock price is lower than its potential value. Also, SBLK’s EV/EBITDA ratio is 13% lower than the average of 3.24x. Meanwhile, the company’s P/E ratio is 2.3x, which is roughly higher than the average of 2.24x. Ultimately, I evaluate that SBLK’s fair value is between $19-$20 per share (see Table 2).
Table 2 – SBLK stock valuation
Author (based on SA data)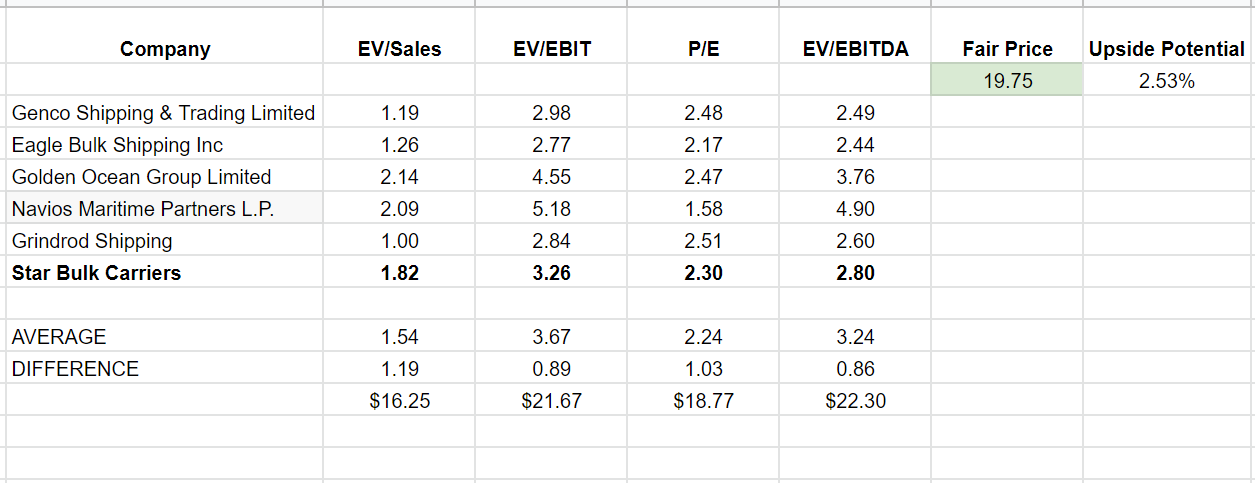
Summary
Ultimately, according to the preceding remarks, the company’s profitability performance, and the global demand for dry bulk shipping, I believe that Star Bulk Carriers’ stock will not experience an upward trend soon. Thus, a hold rating would be appropriate for the SBLK stock. With better economic sentiments, which increase the demand for iron ore, the market condition for dry bulk shipping companies will improve.
Be the first to comment