


InfinitumProdux
Thesis
Star Bulk Carriers Corp. (NASDAQ:SBLK) is due to report its Q2 earnings release on August 4, following SBLK’s recent collapse to its July lows. Even though it traded at relatively “cheap” valuations at its June highs, the market still sent it tumbling. As a result, SBLK fell nearly 37% to its July bottom.
Notwithstanding, SBLK has recovered remarkably from its steep collapse, which sent it into medium-term technically-oversold zones. However, we don’t encourage investors to join the current rally, as we believe SBLK could underperform moving ahead. Therefore, we posit that the recent recovery is unsustainable and view it as a short-term rally from an oversold bottom.
Our valuation analysis suggests that investors should be patient and wait for a steeper fall before considering adding exposure. Our price action analysis indicates that a potential bull trap (indicating the market could decide to deny further buying upside) could form at the current levels. Therefore significant caution is warranted.
Hence, we believe investors sitting on massive gains can consider cutting more exposure. New investors considering adding can wait for a steeper retracement first.
As such, we revise our rating on SBLK from Hold to Sell, with a medium-term price target (PT) of $20 (implied downside of 23%).
The Market Is Adjusting For SBLK’s Peak Growth
Recessionary worries and potential demand destruction have upended SBLK’s robust uptrend from its March 2020 COVID bottom. However, Star Bulk Carriers has continued to report robust results through Q1. However, we urge investors to look forward, as Star Bulk’s growth could continue to slow.
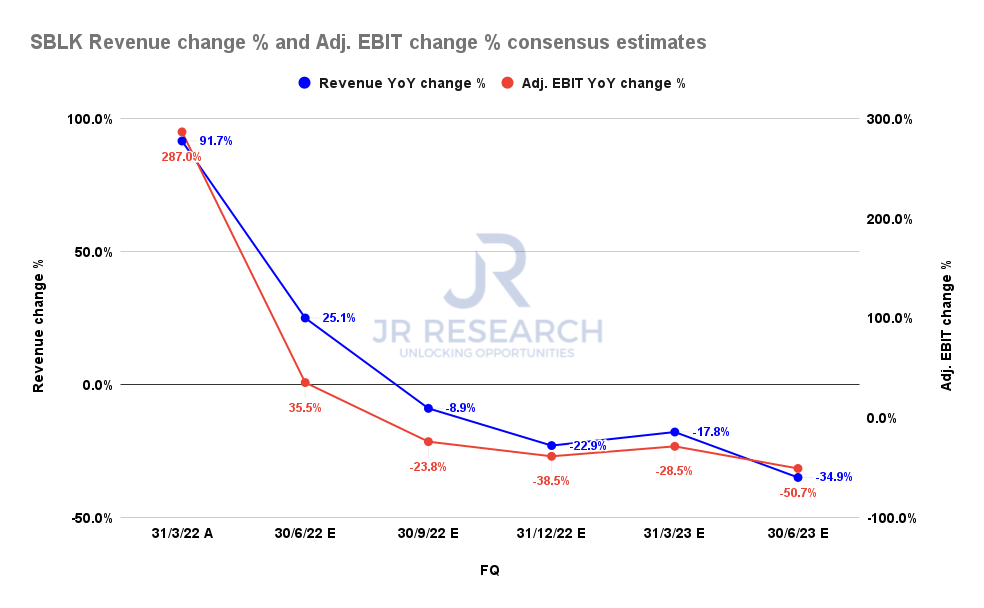
SBLK revenue change % and adjusted EBIT change % consensus estimates (S&P Cap IQ)
The consensus estimates (bullish) indicate that Star Bulk Carriers’ growth could have peaked in FY21 and could continue to slow dramatically through FY23.
As seen above, the company is projected to report revenue growth of 25.1% in FQ2, with an adjusted EBIT growth of 35.5%, demonstrating its inherent fixed costs leverage.
However, that same advantage could also reverse markedly if topline growth slows markedly, resulting in deleverage. Consequently, SBLK’s revenue growth is estimated to decline through Q2’23, reaching -34.9%. Moreover, its adjusted EBIT growth is expected to decrease further to -50.7%.
Therefore, we believe the market has adjusted its valuation dynamics to factor in potentially worsening metrics in SBLK’s growth cadence.
SBLK – Market Rejected Further Buying At An FY24 FCF Yield of 19.4% In June
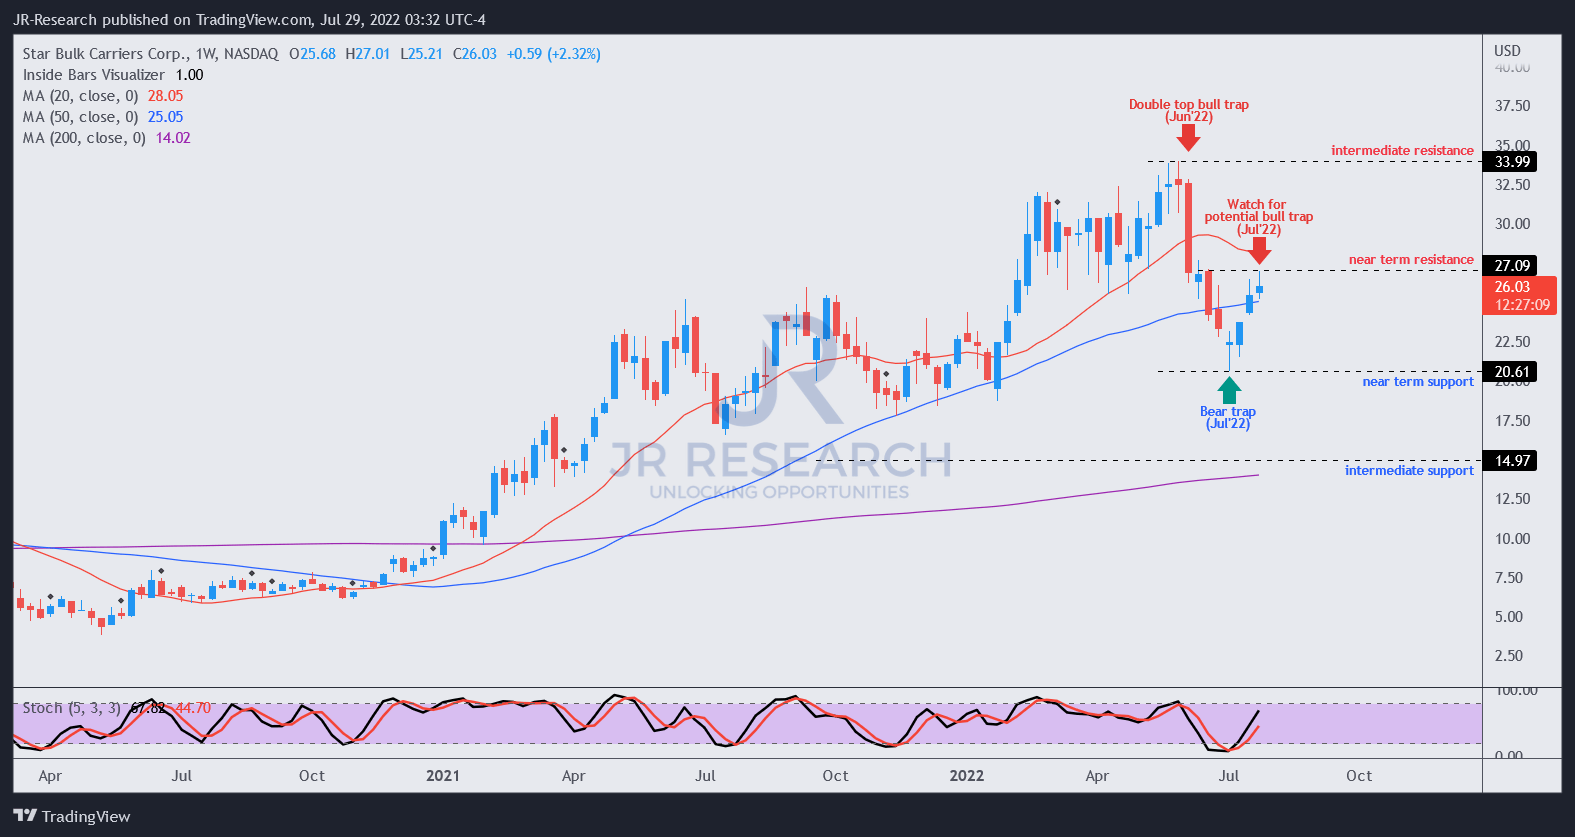
SBLK price chart (weekly) (TradingView)
Note that the market rejected further buying upside in June at a free cash flow (FCF) yield of 19.4%. As a result, it also formed a double top bull trap on its medium-term chart, which can also be seen on its long-term chart.
That move by the market then sent SBLK tumbling nearly 37% to its July lows, forming its near-term support ($20.6). SBLK has recovered 23% from its July bottom but could encounter another bull trap (pending validation) at the current levels.
Hence, if the market rejects further buying momentum at this critical juncture, we believe it could set SBLK up for another steeper fall to re-test its near-term support.
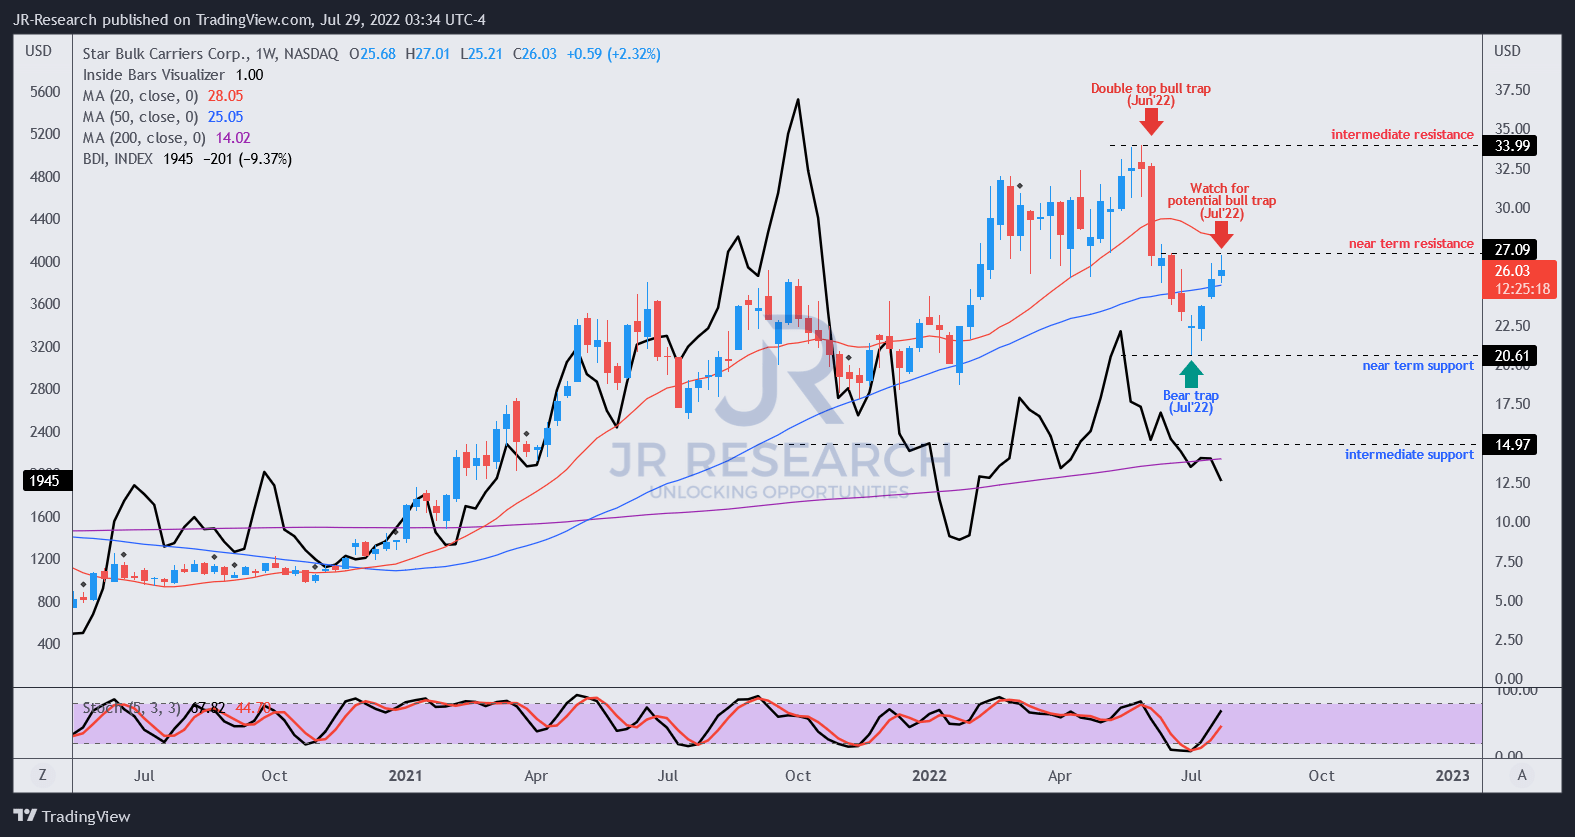
SBLK and BDI price trend (weekly) (TradingView)
We also encourage investors to pay attention to the Baltic Dry Index (BDI) closely as SBLK’s June top corresponded with the BDI’s top in June. Even though SBLK outperformed the BDI in 2022, we believe the recent price trends suggest a broad market de-rating that could impact SBLK and its peers.
SBLK’s Valuation Suggests Market-Underperformance
| Stock | SBLK |
| Current market cap | $2.67B |
| Hurdle rate [CAGR] | 11% |
| Projection through | CQ4’26 |
| Required FCF yield in CQ4’26 | 25% |
| Assumed TTM FCF margin in CQ4’26 | 63% |
| Implied TTM revenue by CQ4’26 | $1.68B |
SBLK reverse cash flow valuation model. Data source: S&P Cap IQ, author
Some investors voiced concerns over Star Bulk’s debt levels and interest load given the rising rates environment.
However, we are not unduly concerned with that, as the company is still projected to generate significant free cash flow profitability moving forward.
However, our valuation model suggests that SBLK’s current valuation has captured much of its upside potential over the next few years. Therefore, unless SBLK falls further, adding at the current levels could lead to potential market underperformance through FY26.
We applied a market-perform hurdle rate of 11% in our model. We also selected an FCF yield of 25%, which we think is appropriate based on the market’s current dynamics.
Note that the market rejected further buying upside at an FY24 FCF yield of 19%. But, it stanched further selling downside in July at an FY24 FCF yield of 32%.
Accordingly, we require Star Bulk Carriers to deliver a TTM revenue of $1.68B by CQ4’26. However, we think SBLK is unlikely to meet our revenue target based on our hurdle rate and current valuation.
Therefore, the market is likely asking for much higher FCF yields to compensate for the risks of potential market underperformance with a much lower implied hurdle rate.
Is SBLK A Buy, Sell, Or Hold?
We revise our rating on SBLK from Hold to Sell, with a medium-term price target of $20 (a potential downside of 23%, as of July 28’s close).
We urge investors sitting on massive gains to leverage the recent rally from its July lows to cut more exposure and rotate.
New investors should be patient and wait for a steeper fall before adding exposure. Therefore, we would monitor for a potential re-test of its $20 support level.
Be the first to comment