


asbe/iStock via Getty Images
“The trend is your friend.” We’ve all heard it before. But for 2022, the trend has brought mostly pain for investors, as the S&P 500 (SPX) is still down -15.5% despite a bounce since mid-October. On the other hand, 2022 has been a great year for traders as there have been several wide swings in the markets. Many times even rough years experience an end-of year rally, the Santa Claus rally, but that seems unlikely this year. Trying to predict the future, including in stock markets, is folly, but we never cease to look for signals about what might be coming next.
The 2022 Resistance Trendline
A remarkably strong 4-point technical resistance trendline has developed this year for the SPX, which subscribes a higher probability that it is meaningful. Based on this line, a major rally into the close of 2022 does not seem likely.
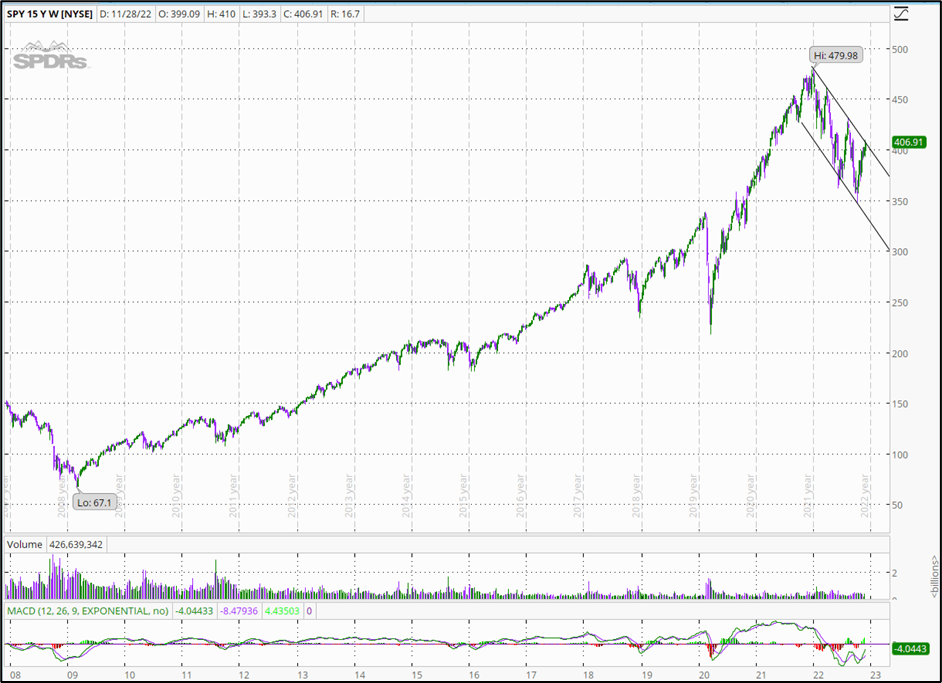
There is always a bit of discretion in drawing trendlines. Of course, two points are required, but the more points on the line, the stronger its influence is believed to be. The weekly 15-year chart below for the SPX shows that 2022 has been characterized by a well-defined down-sloping channel (2 black parallel lines on the upper right). The SPY has made both lower highs and lower lows, a classic bearish trend. Interestingly, while the price swings within the channel haven been especially wide compared to most of the past 15 years, the volumes (top of the 2 lower studies) have been rather tame. Even volumes during the early 2020 COVID selloff were mild compared to the years around the 2208-2009 Great Recession. And the MACD indicator (lower study) shows how drastically the overall index swung from an overbought to oversold condition as 2022 began.
author
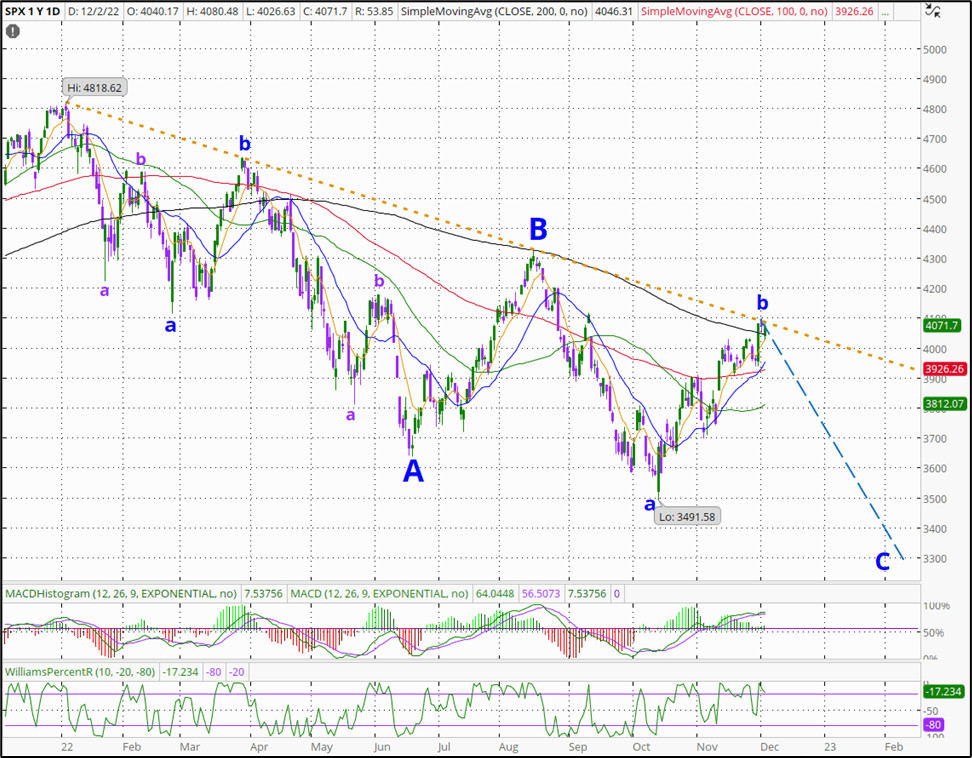
Let’s look at the channel more closely using a daily chart of the SPX. The upper channel line (gold dashed line), resistance, has 4 remarkably-aligned points. The first obvious point I use is the highest high, SPX 4100.51 on January 4. Then, I use the touch at SPX 4315.28 on August 16. Using those 2 points allows me to use my TD Ameritrade ‘thinkorswim’ chart tools to draw a trendline precisely between these 2 points, and then to enable the extension to the right (downslope). Doing so aligns well with the touch at SPX 4637.30 on March 29.

author
There was actually a small intra-day pierce on March 29 with the close at SPX 4631.60, which is fairly smack on the line. Trading the next day got very close to the line but it was a miss. So, the initial high and next 2 touches are clearly reversal pivots and that’s a nice line-up.
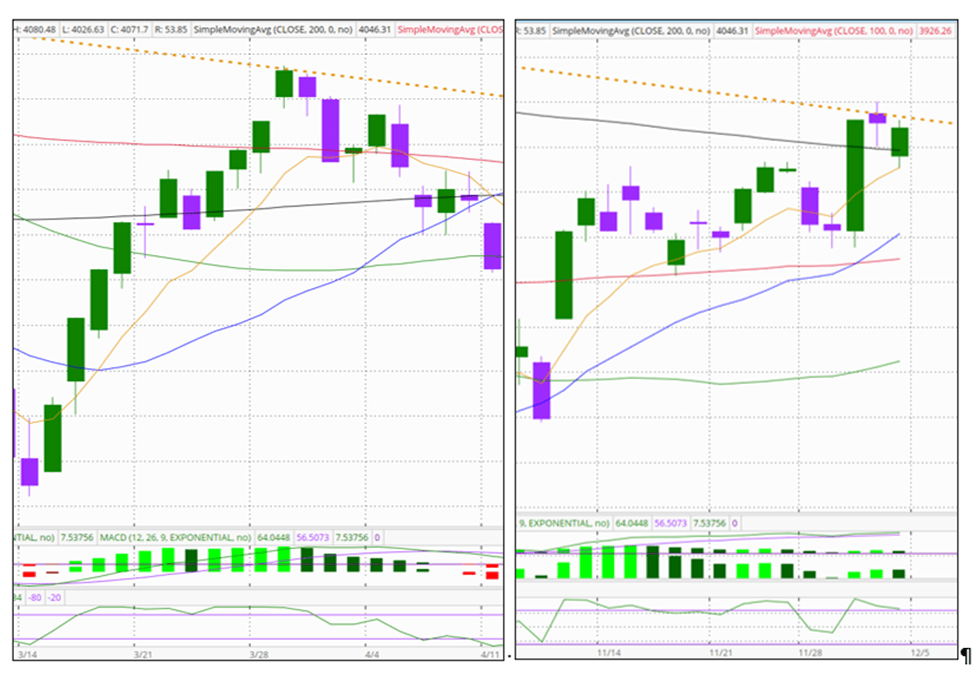
This past week the SPX again approached the resistance trendline, on Thursday (12/1). The daily high was clearly a small pierce of the trendline (reaching to SPX 4100.51), with an open at SPX 4087.14, right on the line, and a close of SPX 4076.57, clearly below the line. On Friday (12/2), the high also clearly did not touch the trendline and in fact closed below Wednesday’s high. Here’s the detail for the 2nd and 4th touches of the trendline:
author
This simple line clearly defines 3 completed reversals and an apparent unfolding 4th reversal point in this downtrend. Is there more to come?
A Potential Pattern
Readers who have elected to Follow have free access to my Portfolio Blog, in which I detail my trades every day that I initiate or close a stock position. On February 20 I started writing in my blog about this 2022 downtrend, and have tried to fit a simple Elliott Wave-inspired corrective wave. I’ve modified this a few times and here again present my best guess for the form of the SPX pattern. As I have written in the past, I was intrigued by the idea of long-term repeating impulsive and corrective wave patterns that develop from the aggregate behavior of traders.
I’ve written before in a good number of portfolio articles that I am not an Elliott Wave expert, and my pattern here may violate accepted EW rules, despite that there are differences among EW practitioners. This is what the current downtrend form might be from an idealized 3-wave corrective pattern, without regard to any time or degree of the a-b fractals. So my A wave is subdivided into 2 levels (degrees), while the B wave has no subdivision, and the unfolding C wave is also subdividing.
author
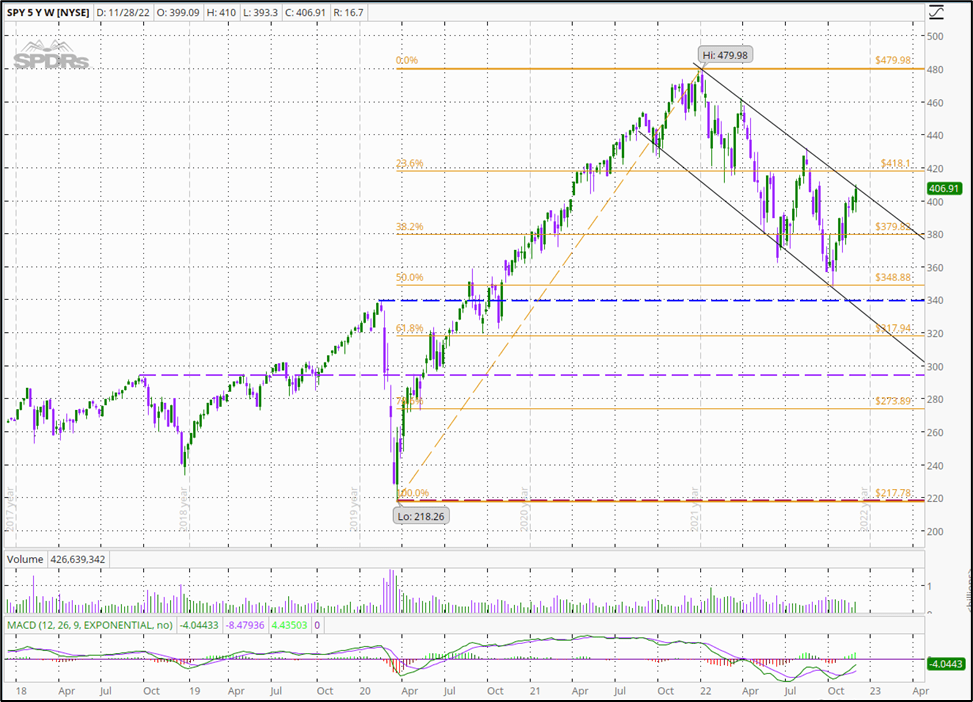
If the C wave reversal plays out, estimating the bottom is the next challenge. Just based on traditional technical analysis levels, I see a few good potential levels using previous pivot tops and a Fibonacci retracement for the uptrend from the March 2020 COVID low to the January 2022 high. Here I’m using the SPX tracking ETF, SPY (just multiply by 10 to approximate the SPX level). Using major pivot levels, the next probable lows might be at about SPY 340 (blue dashed line, pre-COVID highs) or about SPY 295 (magenta dashed line, high before the fall 2018 correction). The worst case would be about SPY 220 (dashed red line, the COVID low in March 2020). Using a Fib retracement (gold lines), it is interesting that the mid-October low for this year so far was just about the 50% retrace of the entire 2020-2022 uptrend, and not far above the pre-COVID high. The pre-2018 high is about half way between the .618 and .786 retrace. Just based on my experience, I would expect a low somewhere between the blue and magenta dashes, or SPY 295-340.
author
Using the Trendline
For my portfolio, I’m an opportunistic, incremental trader, holding longer-term income investments (CEFs, REITs, some dividend stocks) but also employing about 40% of my resources to swing trading, mostly under-performing S&P 500 stocks. The volatility of the bear market of 2022, with such wide swings from that resistance trendline, has served me well. I trade what’s in front of me, and despite the bear market I’ve closed 98.6% of 141 long-only trades for profits so far in 2022, with 54% at >20% gains (not including dividends), tax free in my Roth. Do your own DD, but if you want to follow along, visit my free-access blog.
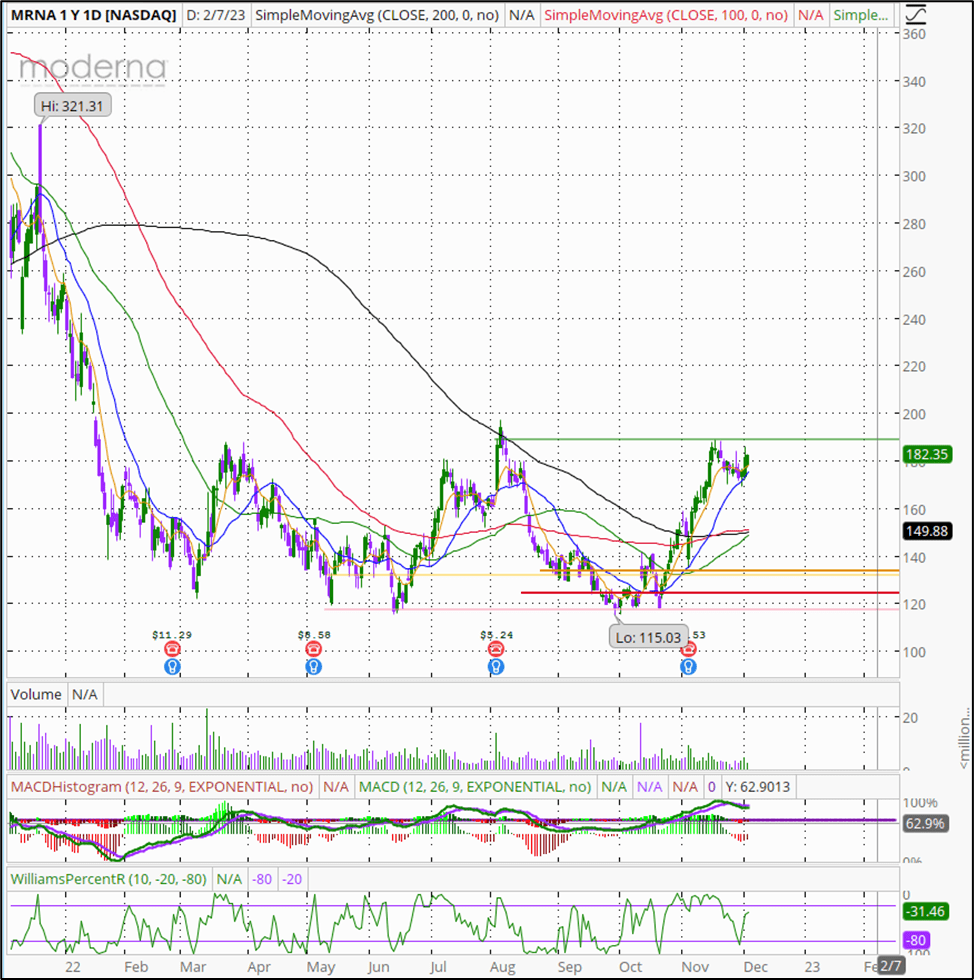
Here’s an example of a trade, twice on the same stock, during this bear market. As Moderna (MRNA) dropped in 2022, I opened a position on May 17 near new lows. I added some shares as price dropped some and had an average unit cost of 130.11. I sold the shares on Aug. 3 at 189.00 for a gain of 45.26% for about 2.5 months in the trade. I then bought the stock again after it dropped, on August 23. My average unit cost is now 133.54 with an unrealized gain of 36.55%. I’ll be selling again very soon anywhere above 184.00 if it holds up. The daily chart below shows the average unit cost (gold horizontal lines), low buy cost (red horizontal lines), and the sell price (green horizontal line). The lines are faint for the first trade and are bolder for the current trade. The point is that even a volatile bear market can provide an opportunity to profit from short-term swing trades. I am a long-only trader, never use options or margin, and short term trades are fine in my tax-free Roth.
author
As readers of my blog have seen, I’ve used the trendline by taking some profits when a stock’s price is spiking and the SPY is approaching the resistance trendline. This approach assumes “power” in a strong, broader market reversal.
What is the Bigger Pattern?
There are many analysts who offer ideas and trading services based on technical analysis, including Elliott Wave, and some that include long-term pattern analyses of the market. Most of these are available by subscription, and fewer have been providing this type of analysis for a long period of time. Here are 2 competing technical views about the current stock market pattern in the context of a longer-term analysis.
PUGSMA – One view, using longer-term technical analysis and incorporating Elliott Wave patterns, is from PUG Stock Market Analysis. This site is mostly subscription based, but he periodically offers a recent S&P 500 chart. The most-recent, free-access, long-term S&P chart is, fortunately, from November 22 (SP-500 Technical Analysis Long-Term View).
PUGSMA.com
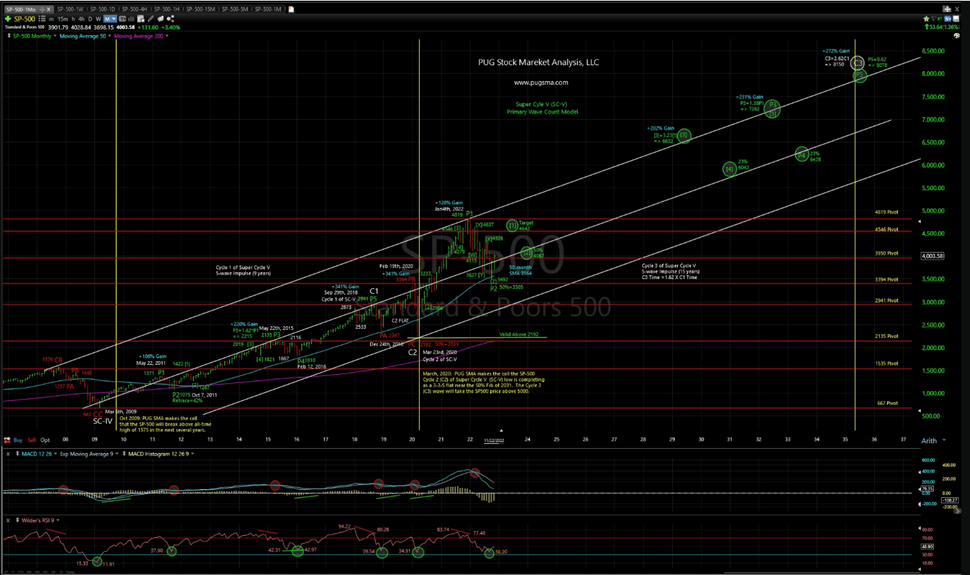
Overall, the PUGSMA chart shows a bullish market, albeit in the fifth Super-Cycle wave (the highest degree), with a years-away price target of SPX 8078. What’s not to like about that, assuming we live long enough and don’t need our money when the market is in one of the corrective waves? I agree that PUGSMA counts the end of the Great Recession in 2009 as the end of a Super-Cycle (here SC IV). In this count, since then the SPX has completed Cycle 1 (ending in late Sept. 2018 before the fall bear market), and completed Cycle 2 in March 2020 at the bottom of the COVID selloff. Primary wave 1 of Cycle 3 began then and completed in January this year, with the 2022 bear market underway as Primary 2. If I read the chart correctly, this move can still be valid down to SPX 2192 (above the 2020 COVID low) but the longer-term price channel suggests a likely bottom, roughly, within SPX 2900.
That’s good news, of sorts, as the next targets are for P3, an uptrend, but as subdivided it will have a lower-degree top (call it Major 1) at SPX 4642, which is below the high this past January. Then there will be another small corrective wave (Major 2) to SPX 4067 perhaps later next year before the market then continues an uptrend (Major 3) sometime in late 2023 or later. Here’s an enlargement of the current part of the chart above:

PUGSMA.com
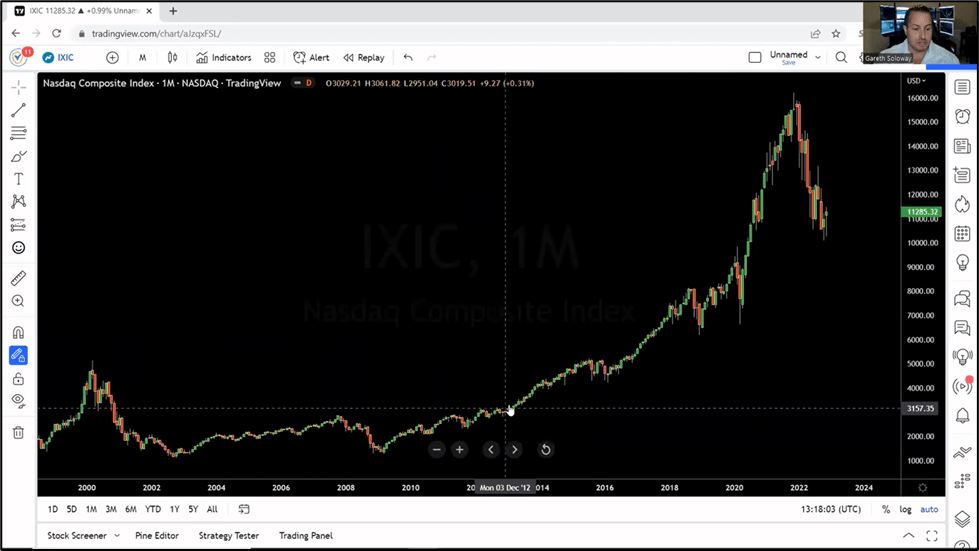
InTheMoneyStocks – A competing view of the likely market direction from here is from Gareth Soloway, one of the two master traders at InTheMoneyStocks.com. In a recent (November 25) free-access blog post, Gareth presents a 15-minute video titled “The Beginning of the End,” with the conclusion that the Nasdaq and S&P are not likely to see new highs for another 10-15 years. The markets would experience another “lost decade.”
Soloway provides a comparative analysis of the Nasdaq and SPY from previous market bubbles, especially the dot-com bubble in 2001, as well as similar patterns from the Brazilian and the Hang Seng markets. Based on market price run-up multiples, Soloway estimates that the S&P may not bottom for perhaps another year, if not longer. Here’s one screen-shot of the longer-term market price pattern that he talks about:
InTheMoneyStocks.com
This is a scary prediction for sure, especially, he says, for those who do not trade.
While these are only two of the predictions that one might find, they fairly illustrate that there is likely no consensus about how long or deep this current bear market will be and when the next uptrend will make new highs. In the best case scenario, the SPX could re-approach the resistance trendline and finally confirm an uptrend.
Final Thoughts
For varying reasons, investors and traders make decisions based on their expectations and confidence about the economy and where markets are heading, as well as their underlying investing styles. These decisions may or may not be informed by technical analyses of past market patterns or future predictions. While no one really knows what tomorrow will bring let along next year, we would like to know as to obviously better profit from what happens. There are wildly varying scenarios available, and each of us has to decide what we think is most probable. We can elect to stay whatever course we have chosen regardless of what is unfolding, or we can modify our investing behavior to take advantage of what is unfolding.
I like to at least be aware that perhaps there is some structure to the movement of markets and to use that to profit regardless of whether trends are bullish or bearish. This is why I am a swing trader at heart, and so far this has been working for me. As the SPX has sold off, I’ve used the strong technical resistance trendline to take short-term profits. At some point – and we have some reasonable guesstimates of where that might be – the market will reverse and the resistance trendline will fail. I will be more inclined at that point to let profits run longer.
I hope that my musings on the resistance trendline and market pattern have been of some interest. Most important, I hope that whatever approach investors use is working during this bear market, and that it will serve them well however long the bear market lasts.
Best to your investing/trading!
=Green=
Be the first to comment