

Nasdaq 100 & Dow Jones Price Outlook:
Nasdaq 100 & Dow Jones Seek Support Amid Declines – Stock Forecast
The Nasdaq 100 and Dow Jones have bled lower this week, leaving the two indices in search of technical support. Since little has changed in the fundamental landscape, aside from rising Treasury yields which should be eyed closely, the longer-term equity outlook remains encouraging. With that in mind, nearby support might provide a springboard for an eventual recovery higher.
Nasdaq 100 Price Chart: 4 – Hour Time Frame (September 2020 – February 2021)
That said, price will first have to respect the various technical levels before potential recoveries can be plotted, so patience is vital at this stage. Initial support in the event of a continued selloff might reside along the 200-period simple and exponential moving averages – currently around 13,315. Secondary support will likely come into play along the ascending trendline from the November lows.

Recommended by Peter Hanks
Get Your Free Equities Forecast
As it stands, the level is an early “line in the sand” that, if broken, could see selling accelerate and allow the Nasdaq 100 to fall further. Such a break would materially change the technical landscape over longer timeframes and potential support around the 13,000 psychological zone might give way quickly thereafter. Thus, maintaining the broader uptrend from November is crucial for the technical foundation of the Nasdaq at this time.
Dow Jones Technical Forecast
Much of the same can be said for the Dow Jones Industrial Average. The index has indeed incurred losses, but in the bigger picture, the DJIA trades just a few hundred points from record levels. That being said, market commentary espousing doom and gloom at this stage highlights the bullish price action the market has come to expect during the remarkable rally US indices have enjoyed since March 2020.
Dow Jones Price Chart: Daily Time Frame (January 2020 – February 2021)
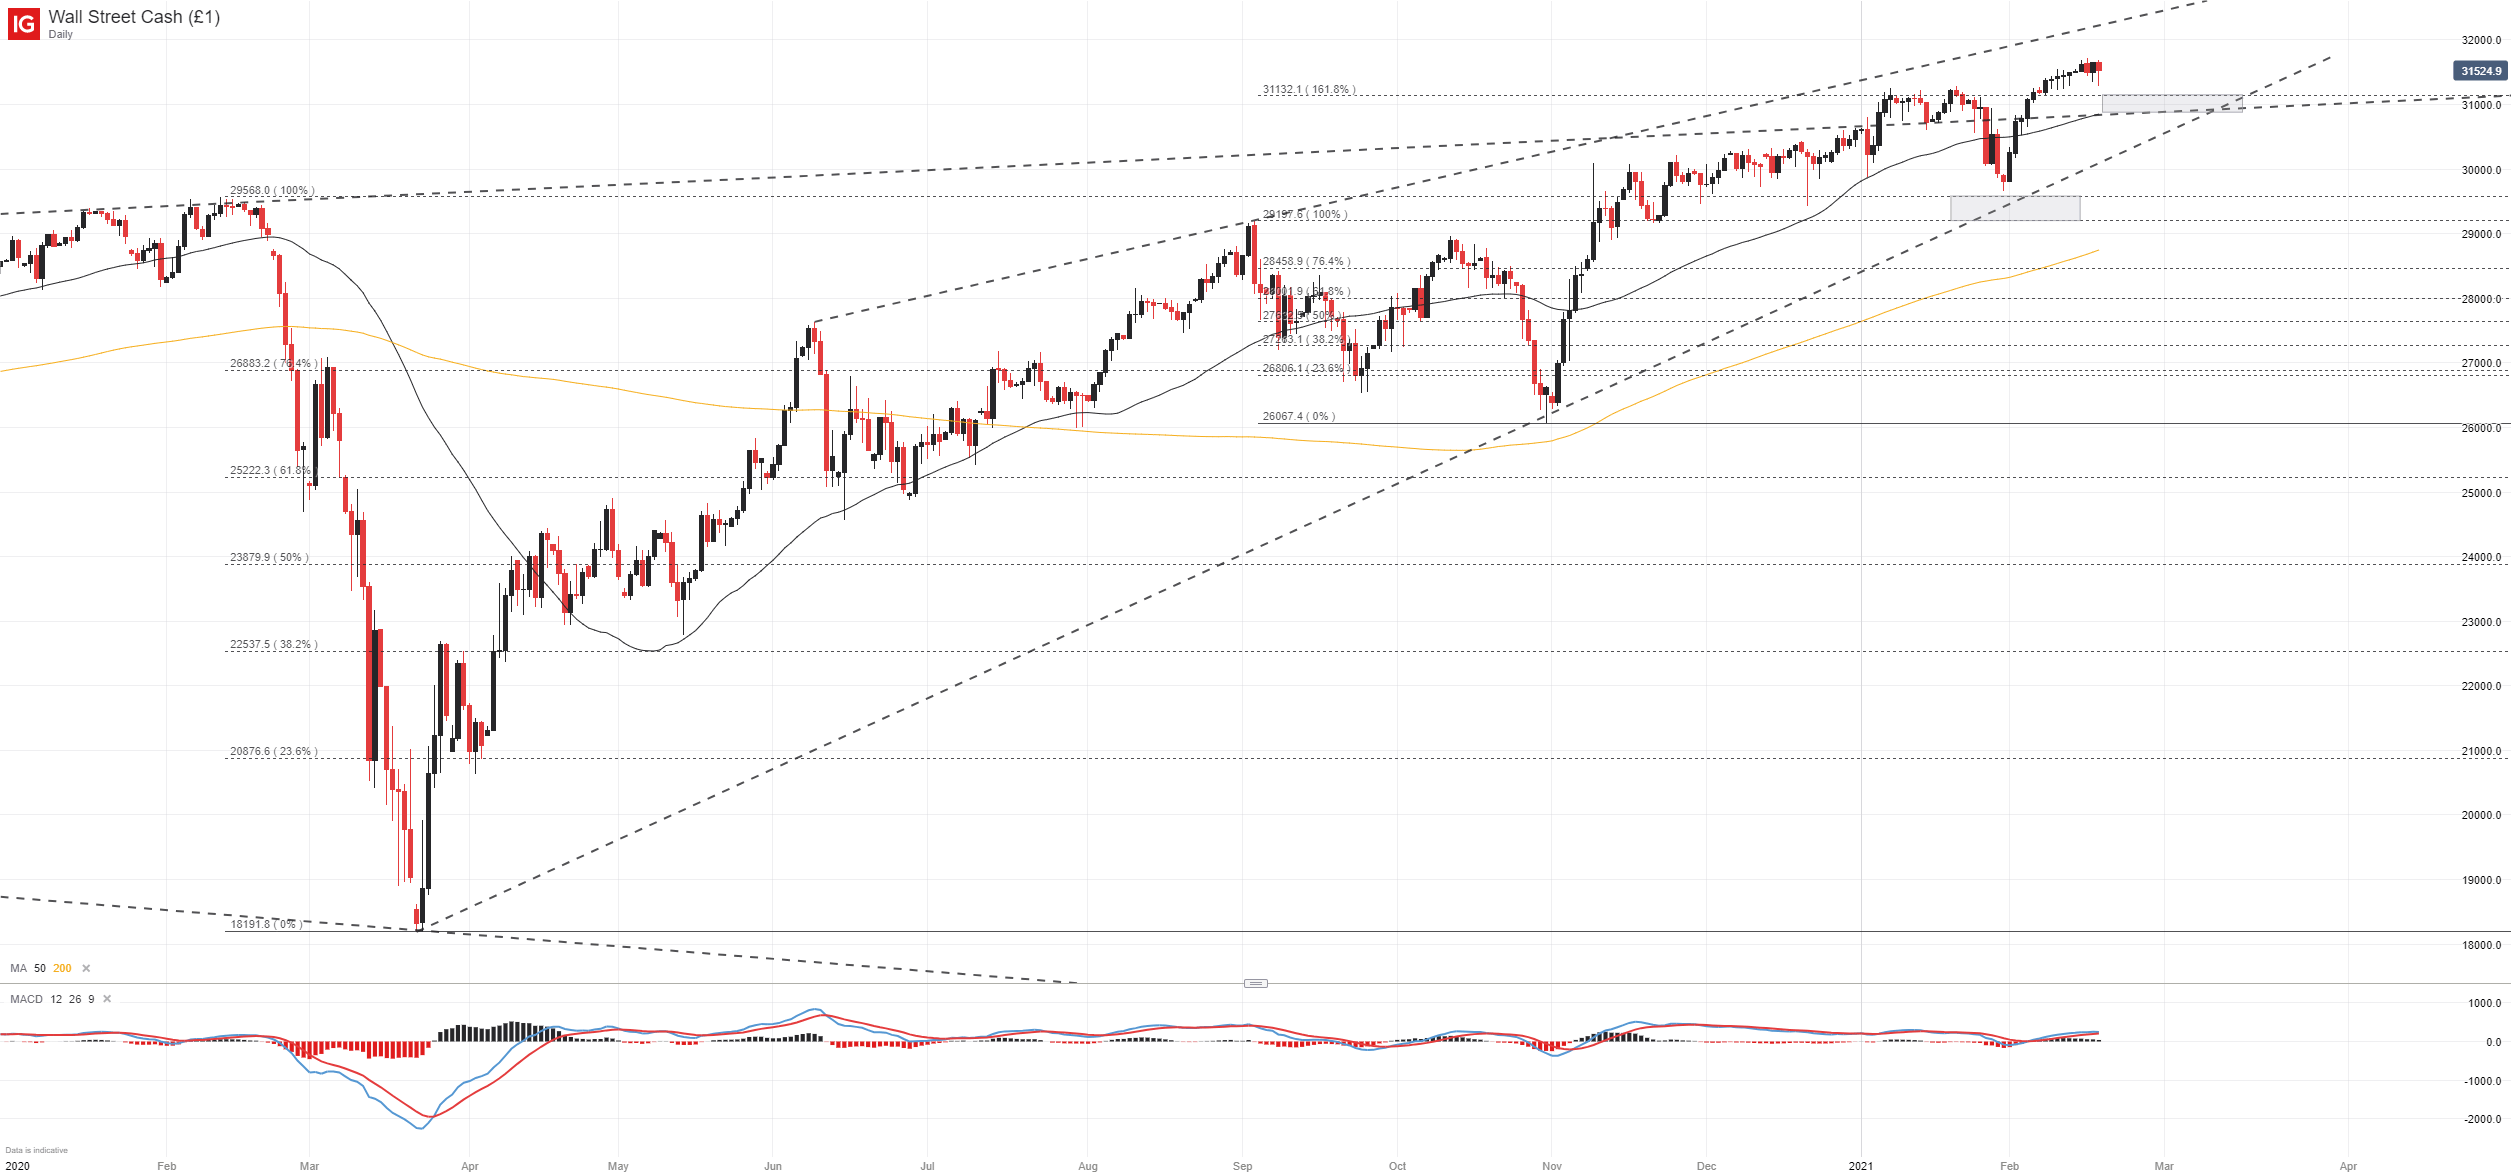
To be sure, the Dow could suffer further losses in the days ahead and, in turn, might require the assistance of support from the 31,130 to 30,900 area. The zone marks a confluence of levels derived from rising and horizontal trendlines, Fibonacci sequences and psychological markers. As with the Nasdaq 100, a break beneath this crucial landmark could see losses accelerate which would then bring the January low around 29,655 into focus.

Recommended by Peter Hanks
Get Your Free Top Trading Opportunities Forecast
With the broader technical landscape laid out, traders should keep an eye on Treasury yields. Should they continue to creep higher, US equities and other risk assets could face significant headwinds. In the meantime, short-term technical traders should look to indicators like MACD and RSI to help plan entry and exit points in the event of a recovery. Follow @PeterHanksFX on Twitter for updates and analysis.
–Written by Peter Hanks, Strategist for DailyFX.com
Contact and follow Peter on Twitter @PeterHanksFX
Be the first to comment