


JHVEPhoto/iStock Editorial via Getty Images
Investment thesis
After a massive miss on Q2 numbers with a steep decline in earnings and just measly organic growth in revenue, Stanley Black & Decker Inc (NYSE:SWK) tanked. I looked into its financials and discovered that they aren’t as good as you would imagine for a dividend king and have worsened in the last few years. For 30 years, its stock performance was the same as the S&P 500 until the recent decline brought its stock price back to 2016 levels leading to significant underperformance of the S&P 500. Furthermore, the dividend, one of the few good things the stock has to offer isn’t covered by cash flow anymore. This, in addition to a potential recession, a crashing housing market, and Stanley Black & Decker’s extraordinary bad Q2 earnings, leads me to think that this stock will probably decline further and need a long time to come back up.
What had happened?
A few days ago, SWK reported earnings which led to a 14% decline in share price. This was triggered by a huge miss of 17% in earnings and 7% in revenue. Misses of revenue happened here or there, but a miss of earnings happened last in 2019. This was due to an unpredicted decline in net income of over 80%! Revenue rose by 16% YoY, mainly led by acquisitions. The gross margin was down 800 basis points from the prior year. Due to this, SWK updated its full-year 2022 diluted GAAP EPS guidance range to $0.80-$2.05 from $7.20-$8.30. That is a reduction of up to 90%. Free cash flow is expected to be $1.0-1.5 billion in the second half of this year.
As a reason for these numbers, the CEO said:
…macroeconomic environment – including inflation, rising interest rates and significantly slower demand in late May and June – drove the majority of the challenges we faced this quarter…
A lack of demand is also visible in its inventory, which was $6.6 billion at the end of the 2Q’22, up approximately $400 million compared to 1Q’22. Inventory remained elevated versus expectations and the prior year.
To answer these challenges, the management implemented a global cost reduction program expected to deliver pre-tax savings of $1 billion by the end of 2023 and grow to approximately $2 billion within three years. Furthermore, it wants to achieve an adjusted gross margin of 35%, which would be 7% more than the current gross margin of 27.9%.
There was good news, too, with the finalization of the sale of securities generating $4.1 billion in cash.
Financials
Looking at growth, free cash flow, profitability, and debt, we see that the fundamentals worsened before this bad Q2 report.
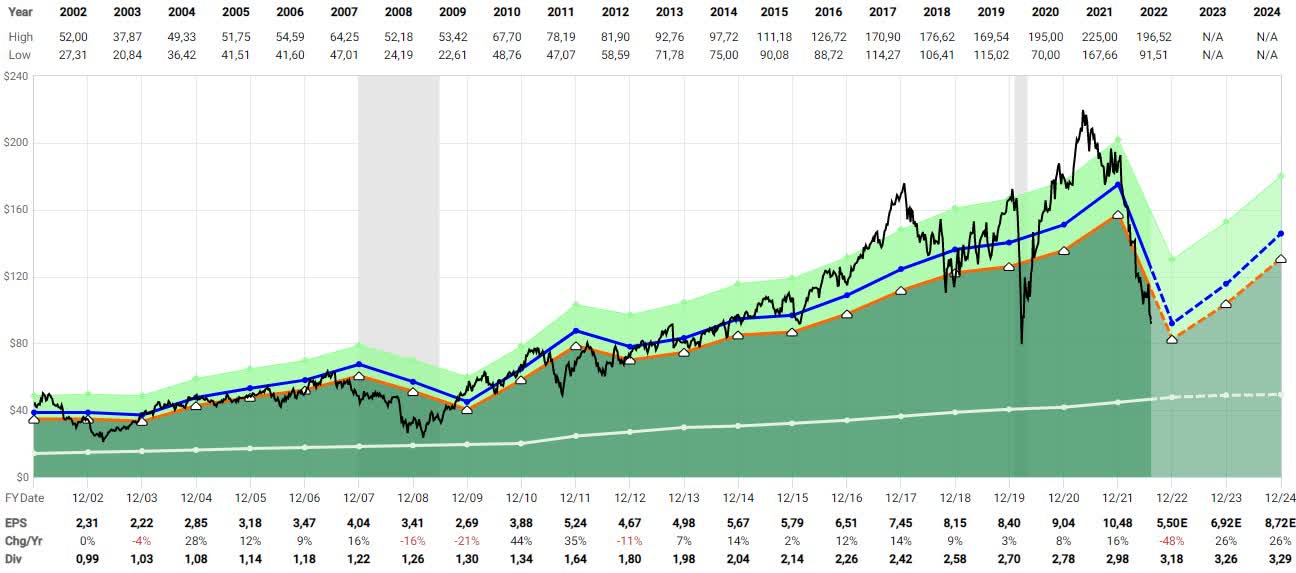
In the last 20 years, SWK grew its earnings by 5.95% annually, while its sales grew by 5.9%. Free cash flow per share grew from $1.84 to $10.7 (CAGR of 10.3%) until it dropped to $0.89 last year (CAGR of -3.75%)
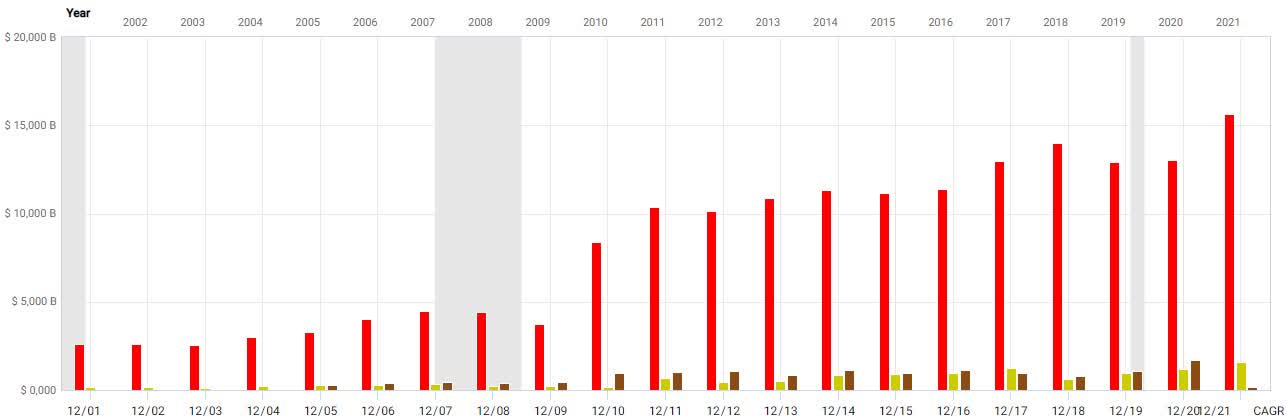
Revenue (red), earnings (yellow), free cash flow (brown) (fastgraphs.com – FUN Graphs)
So in 20 years, SWK generated just mediocre growth in nearly all metrics. The drop in free cash flow is concerning, especially considering that it was negative in the first two quarters of this year at -$8.35 per share in Q1 and -$3.81 in Q2.
Margins and return metrics, apart from ROIC, also declined in the last years, as you can see below:
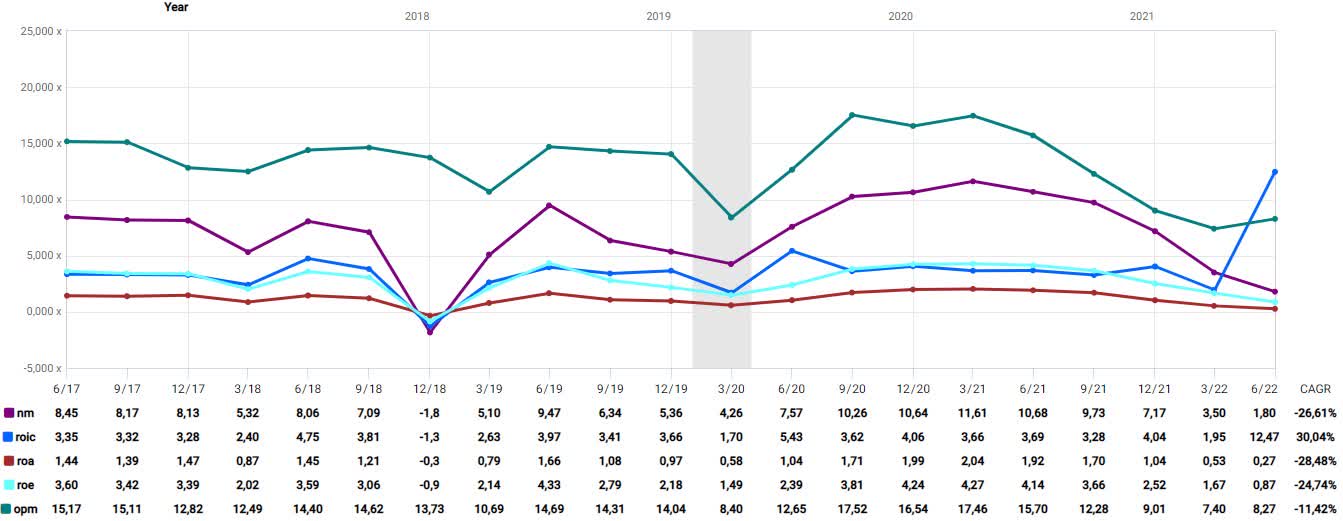
Net margin (purple), ROIC (blue), ROA (red), ROE (light blue), Operating Margin (green) (fastgraphs.com – FUN Graphs)
This is a quarterly view, but if we look at these metrics yearly, we can see an even clearer downtrend (ROIC too). Important to say is that all these metrics are way below the average of SWK’s subindustry, and that is not just now. Most of them have been for a long time.
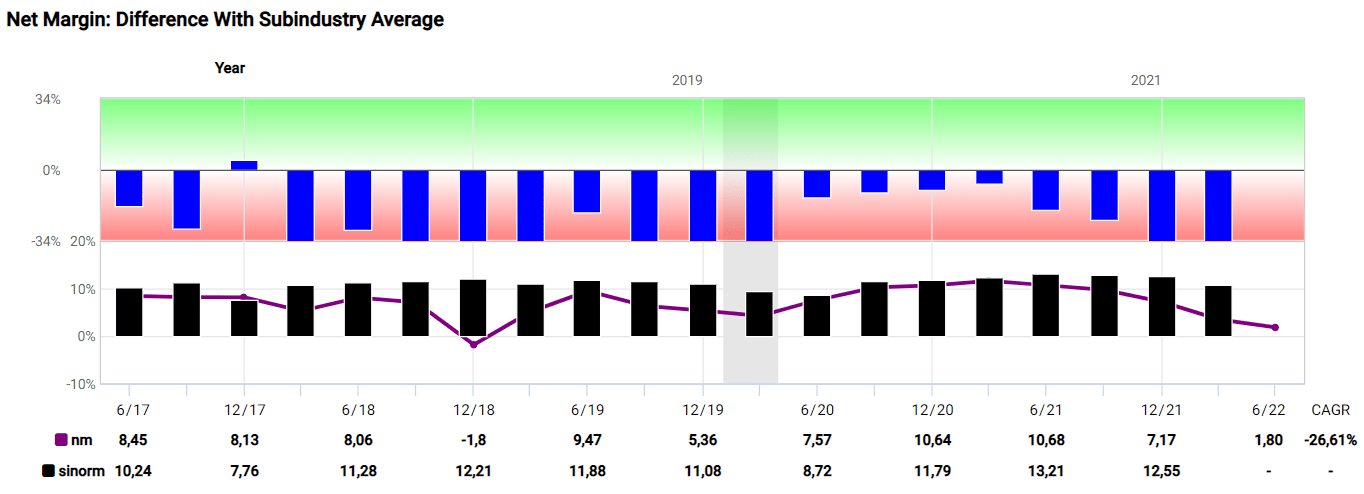
Net Margin: Difference With Subindustry Average (fastgraphs.com – Health Check)
One example is the net margin which has been deeply negative against the subindustry average for years. In Q4 2021, SWK’s net margin was 68% below the average (3.5% against 10.9%).
When looking at its debt, we can see good and bad things. The good thing first: until this year, SWK has never been in enormous debt. The bad thing is that debt exploded last year and has risen further so far.
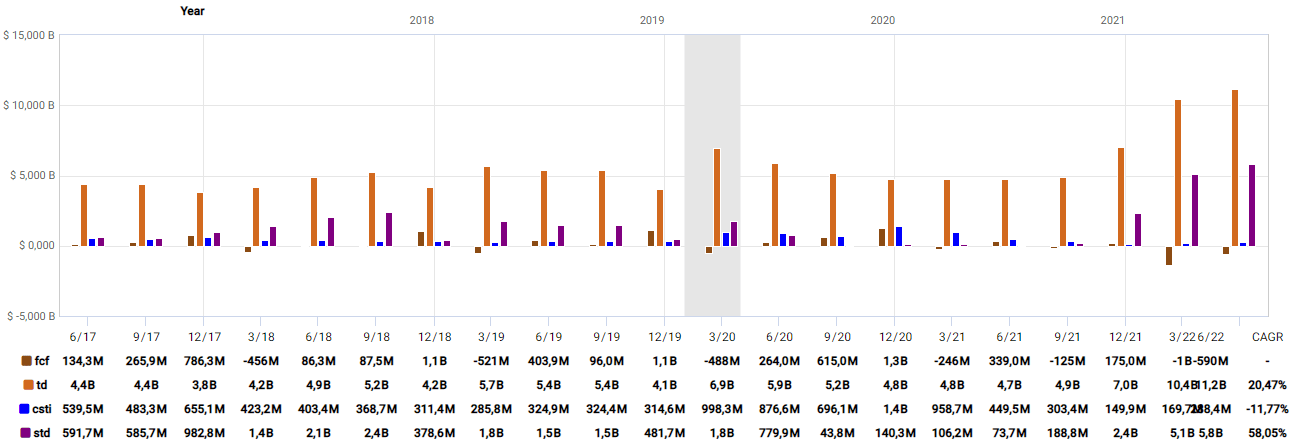
Total debt (light brown), ST debt (purple), free cash flow (brown), cash and ST investments (blue) (fastgraphs.com – FUN Graphs)
As you can see, debt isn’t even near to being covered by free cash flow, especially not this year since free cash flow is negative. ST debt has risen tremendously in the last three quarters and isn’t covered either. Cash and ST investments are so small you can’t even see them correctly on the chart. Meaning that more LT debt has to be made to cover the ST debt. Inadequate debt coverage is something SWK has had to deal with for years. When comparing the LT debt/LT capital ratio, it can be seen that SWK has a higher one than the subindustry average.
One good news for the debt situation: the sale of securities in July this year has generated $4.1 billion in cash meant to reduce debt. If we reduce the debt from Q2, which is $11.2 billion, with the 4.1 billion new cash, we return to the debt level of Q4 2021. This is good news, but nothing you should get too excited about since all this cash is only paying back the debt made this year – in just two quarters. If the cost reduction program bears fruit, there may be more debt reduction in the next years.
SWK is a dividend king, meaning that the company has increased the dividend for over 50 consecutive years. There is much to like about this; for example, most dividend kings were able to pay the dividend due to good coverage. This is something SWK can’t offer right now. In the last quarter, the dividend amounted to $122.3 million against a net income of $79 million and free cash flow of -$590 million.
In recent articles here on SA, most authors said SWK was undervalued. This was true at the time if the current valuation was compared with its historical multiples. But since Q2 was so bad, the share price has dropped, according to the historical multiples, leaving SWK fairly valued without any upside right now. You can see this based on the adjusted earnings in the chart:
Dynamic valuation using the adjusted earnings (fastgraphs.com)
When looking at the same chart with the free cash flow, you can see that SWK trades way above its fair value due to the enormous decline in free cash flow.
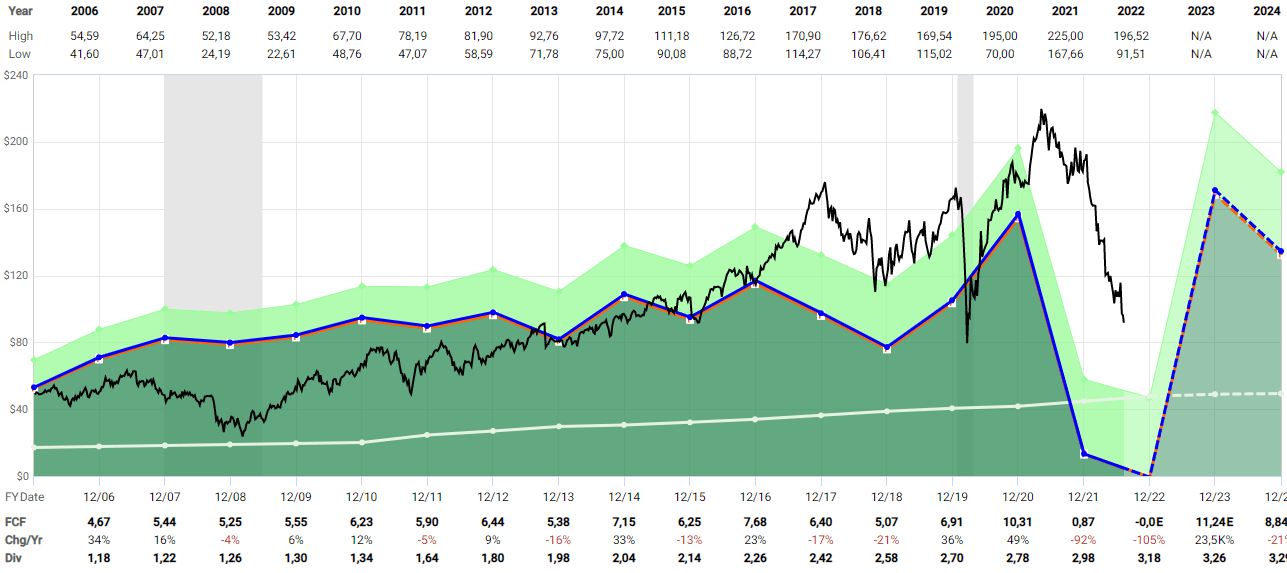
Dynamic valuation using the free cash flow (fastgraphs.com)
The forecast you can see at the right of the current side has yet to be adapted to the new forecasts, with which the analysts have been a bit slow so far. I expect the growth to be flat in the next years.
Market outlook
The problems that caused the decline in Q2 earnings are mainly inflation, rising rates, significantly slower demand, supply chain issues and higher commodity costs. All these problems are destined to last longer, especially the slower demand. Many people – including me – think we are already in a recession. But even though it isn’t officially declared, it is safe to say that a recession is inevitable. With a recession comes higher unemployment and lower wages. This would lead to even slower demand, especially since SWK products are rather expensive and would suffer more than other outdoor or construction tools.
Here are some charts to emphasize that a recession can lead to missing money to fund (expensive) products:
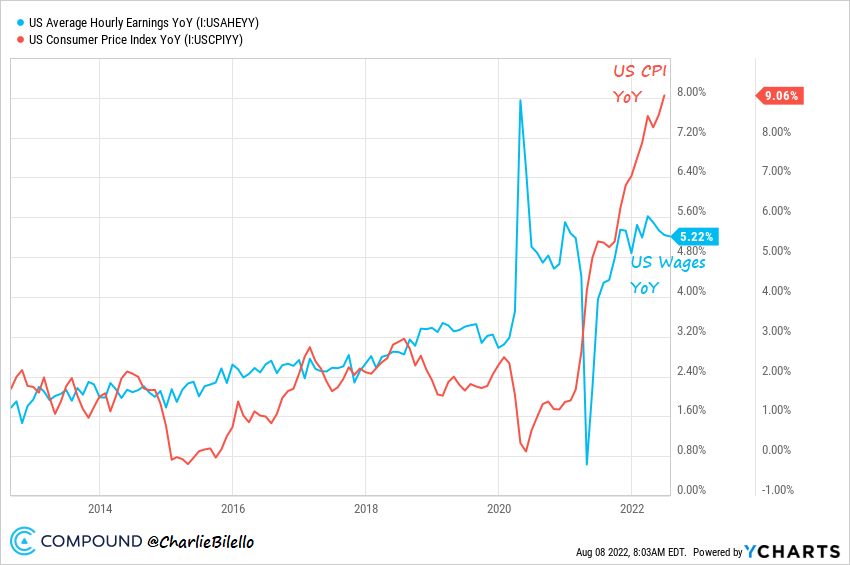
US wages vs CPI (Compoundadvisors.com)
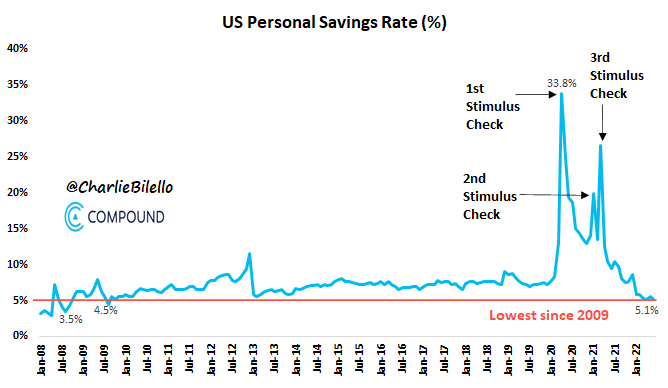
US savings (compoundadvisors.com)
This is just added to a crashing housing market which is, too, a bad condition for SWK to sell its products. With a crashing housing market, there comes less construction. An early indicator is the number of building permits. On the 19th of July, Yahoo finance wrote this: Building permits for single-family homes – an indicator of future construction – declined 8% to a rate of 967,000 units, the lowest since June 2020. Another sign of a weakening housing market is the number of price drops for home sales:
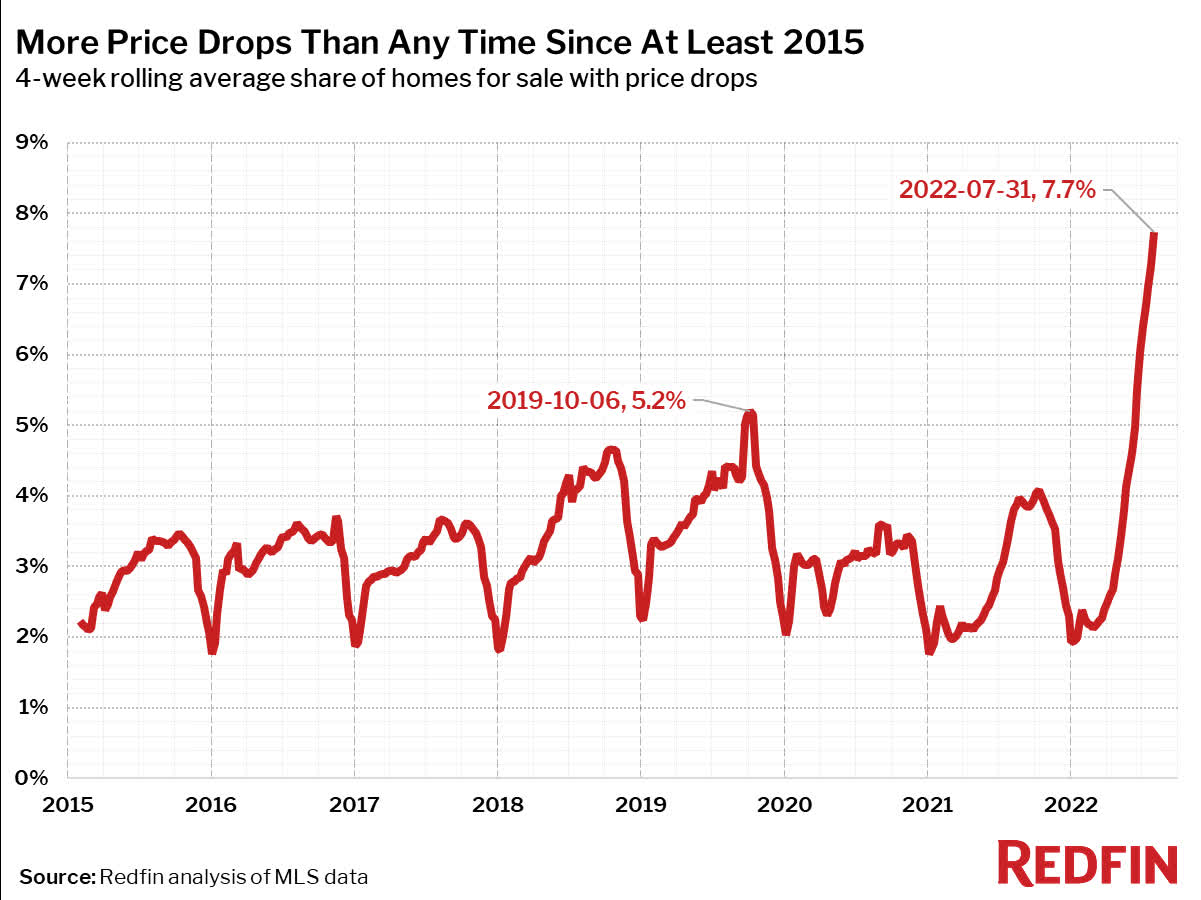
Average share of homes for sale with price drops (redfin.com)
In summary, the outlook doesn’t give hope for a fast recovery of SWK financials.
Conclusion
SWK’s financials didn’t look good for years and worsened significantly in recent quarters. Unfortunately, due to a lousy market outlook, this is very unlikely to improve soon. One of the most important things for investors of SWK is the dividend which wasn’t covered in the last two quarters and had a rather slim coverage before. The stock is fairly valued at best, with worsening forecasts to come. SWK never really outperformed the S&P 500 by much and did underperform it a lot since the recent drop. However, this isn’t destined to change anytime soon, and therefore I think there are way better investments right now with fewer risks, less downside potential and better growth perspectives.
Be the first to comment