

galina ermolaeva
Foreword
A reader of August 2019’s high-yield, low priced dividend dog list called it, “dangerous advice”. Hence, this information is to be used at your own risk.
I have always advised that high dividends portend high risk. Combine that signal with a low-price offer and you have the stuff of legends and horror stories. Especially in light of Y Charts declaration that YCharts allows a dividend yield to persist for 365 days after the most recent reported dividend if a dividend is cut. Therefore a few line items you see calculated here could be totally inaccurate. (Most of the time Y-Charts withholds forward yield projections when a dividend is cut, however… but not always.)
These 77 August selected stocks reported total annual returns ranging from 3.13% to 290.86%. Any candidates this month showing yields greater than 26% were removed because their dividends are the most likely to be cut or curtailed. I did nothing about Chinese-based high yielders but China has announced a preference for home-grown investors and could ban Chinese corporations from international stock market listings in the future.
Another caveat holds for Russian listings. With Putin’s war with Europe raging, the price drop in Russian stocks sent yields over 21% and thus off this list this month. Raising the market cap from $100M to $200M, and not listing stocks with negative price returns kept the list under 100 this month and kept ARR and AGNC and other regulars off this listing. This August list is at 77 and September will generate a new list. Maybe those missing will become positive in price returns and rejoin the pack. The healthiest of sickly dogs will collect here.
Happy hunting, and beware of the numbers put up from the top ten by yield on this list of 77. In short, this is risky business. These are Dogs of the Low, not of the Dow. These dogcatcher metrics are set to snag the most unloved and unpopular curs as a contrarian stock selection strategy.
Meanwhile, all but two of the 77 stocks on this list, show dividends from a $1K investment greater than their single share prices. Some investors find this condition to be an invitation to, at least, look closer.
Actionable Conclusions (1-10): Brokers Calculated 31.18% To 70.41% Net Gains For The Top Ten 10%+ Yield Stocks As Of August 9, 2023
Four of those ten top-yield 10%+ Yield stocks (tinted in the list below) were among the top-ten gainers for the coming year, based on analyst 1-year targets. Thus, this forecast, as graded by Wall St. Brokers, was 40% accurate.
Dividends from $1000 invested in the highest-yielding stocks and the median of analyst-estimated one-year target prices, as reported by YCharts, created the 2022-23 data points for the following estimates. Note: one-year target prices from lone analysts were not applied (n/a). Ten estimated profit-generating trades to August 9, 2023 were:
Source: YCharts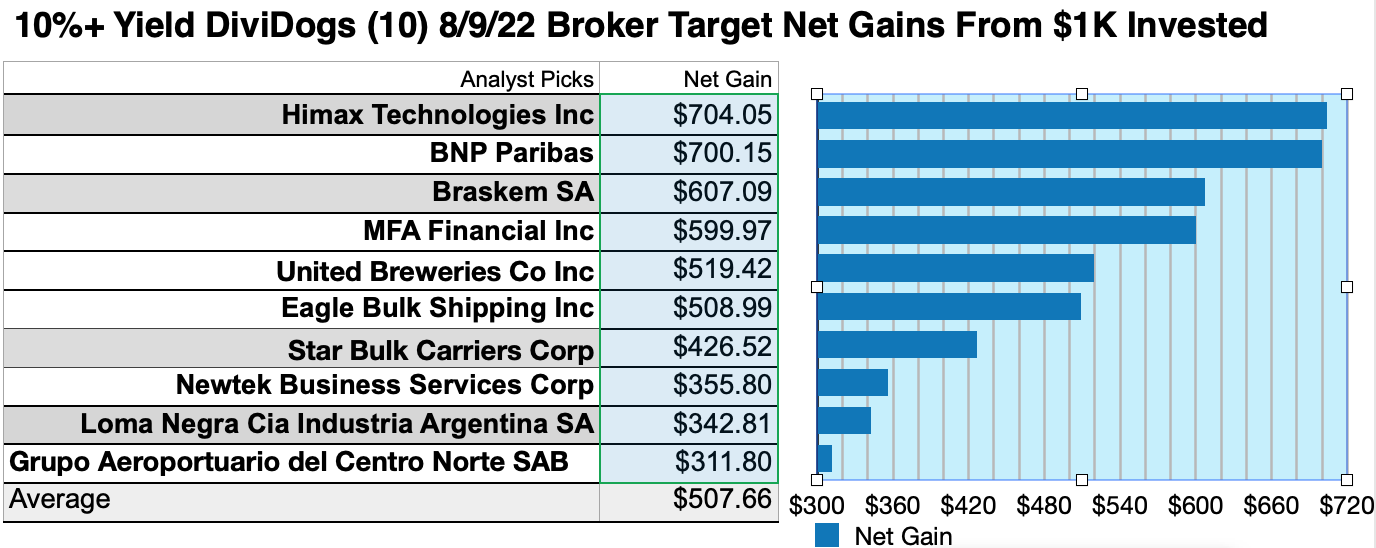
Himax Technologies Inc. (HIMX) netted $704.05 based on dividends plus the median of target estimates from four brokers, less broker fees. The Beta number showed this estimate subject to risk/volatility 84% over the market as a whole.
BNP Paribas (OTCQX:BNPQY) was projected to net $700.15, based on dividends plus the median of target estimates from two analysts less broker fees. The Beta number showed this estimate subject to risk/volatility 51% greater than the market as a whole.
Braskem S.A. (BAK) was projected to net $607.09 based on dividends plus the median of target estimates from eight analysts, less broker fees. The Beta number showed this estimate subject to risk/volatility 64% over the market as a whole.
MFA Financial Inc. (MFA) was projected to net $599.97 based on dividends, plus the median of target estimates from six analysts less broker fees. The Beta number showed this estimate subject to risk/volatility 70% over the market as a whole.
United Breweries Co., Inc. [Compañía Cervecerías Unidas S.A., in SA] (CCU) was projected to net $519.42, based on dividends plus the median of target estimates from six brokers, less broker fees. The Beta number showed this estimate subject to risk/volatility 15% under the market as a whole.
Eagle Bulk Shipping Inc. (EGLE) was projected to net $508.99, based on dividends plus the median of target estimates from seven brokers, less broker fees. The Beta number showed this estimate subject to risk/volatility 35% greater than the market as a whole.
Star Bulk Carriers Corp. (SBLK) was projected to net $426.52 based on dividends plus the median of target estimates from six brokers, less broker fees. The Beta number showed this estimate subject to risk/volatility 5% under the market as a whole.
Newtek Business Services Corp. (NEWT) was projected to net $35.80, based on dividends plus the median of target estimates from two analysts less broker fees. The Beta number showed this estimate subject to risk/volatility 14% greater than the market as a whole.
Loma Negra Compania Industrial Argentina S.A. (LOMA) was projected to net $342.81, based on dividends plus the median of prices estimated by five analysts, less broker fees. A Beta number was not available for LOMA.
Grupo Aeroportuario del Centro Norte SAB (OMAB) was projected to net $311.80, based on dividends plus the median of target estimates from eight brokers, less broker fees. The Beta number showed this estimate subject to risk/volatility 25% greater than the market as a whole.
The average net-gain in dividend and price was estimated to be 32.98% on $10k invested as $1k in each of these ten stocks. This gain estimate was subject to average risk/volatility 23% greater than the market as a whole.
Source: Open source dog art from dividenddogcatcher.com
The Dividend Dogs Rule
Stocks earned the “dog” moniker by exhibiting three traits: (1) paying reliable, repeating dividends, (2) their prices fell to where (3) yield (dividend/price) grew higher than their peers. Thus, the highest yielding stocks in any collection became known as “dogs.” More precisely, these are, in fact, best called, “underdogs”.
50/77 Broker Price Target Up/Dn-sides
Source:YCharts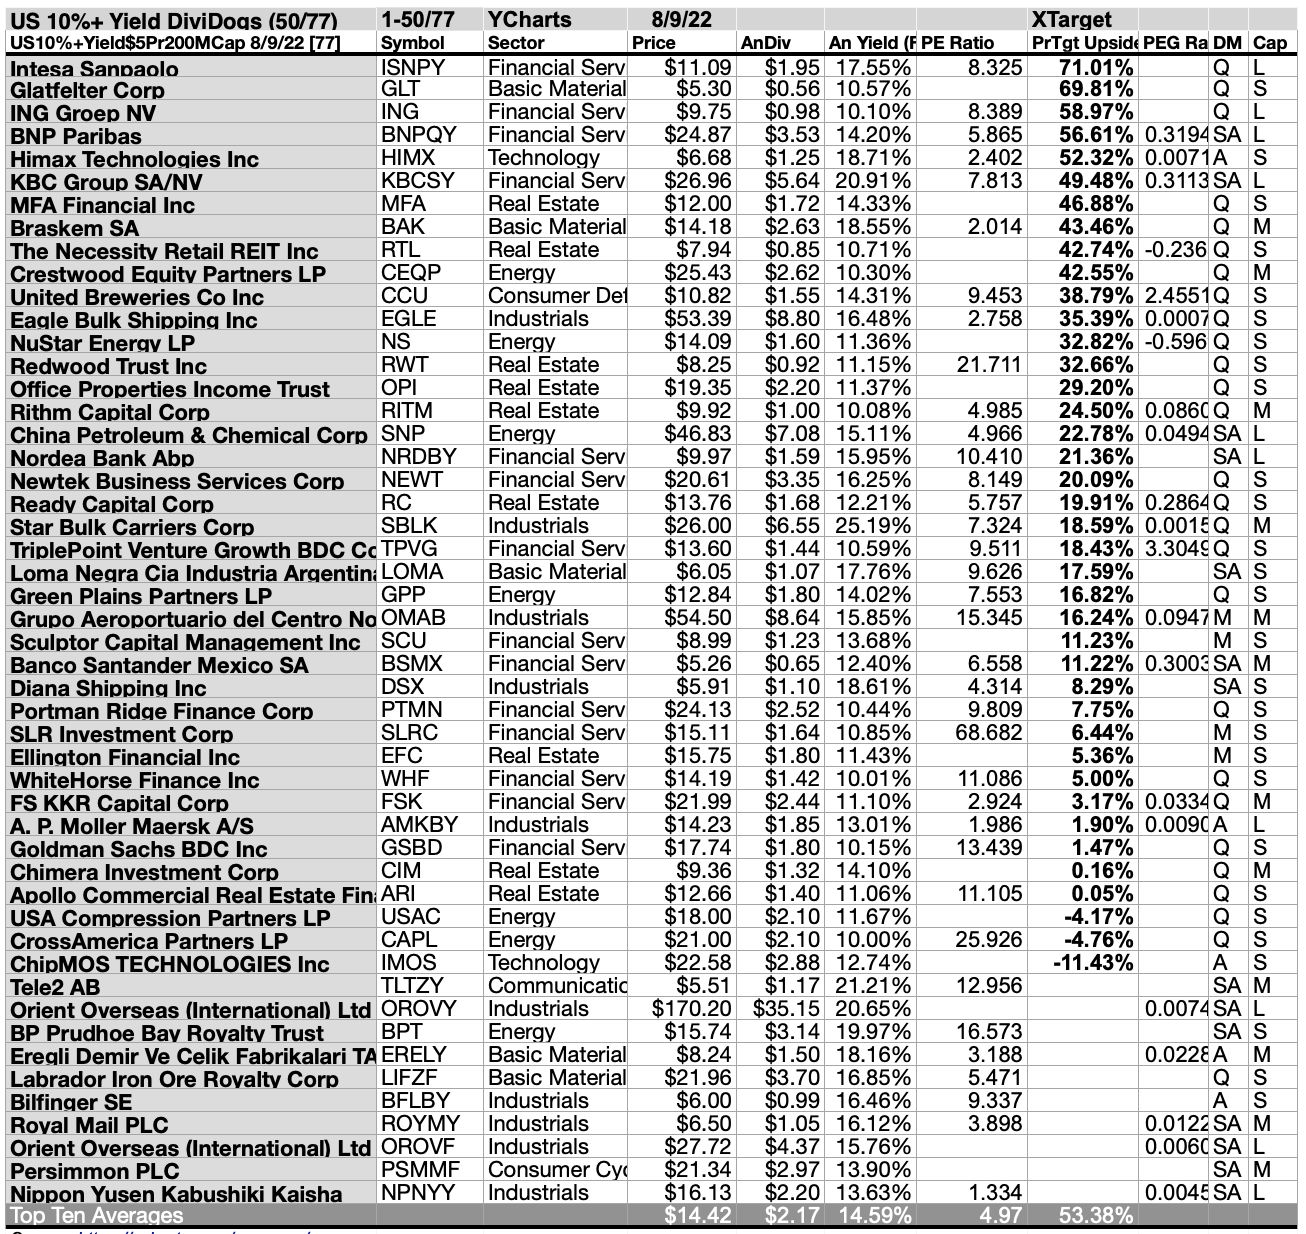
50/77 10%+ Yield Top-Dogs By Yield
Source:YCharts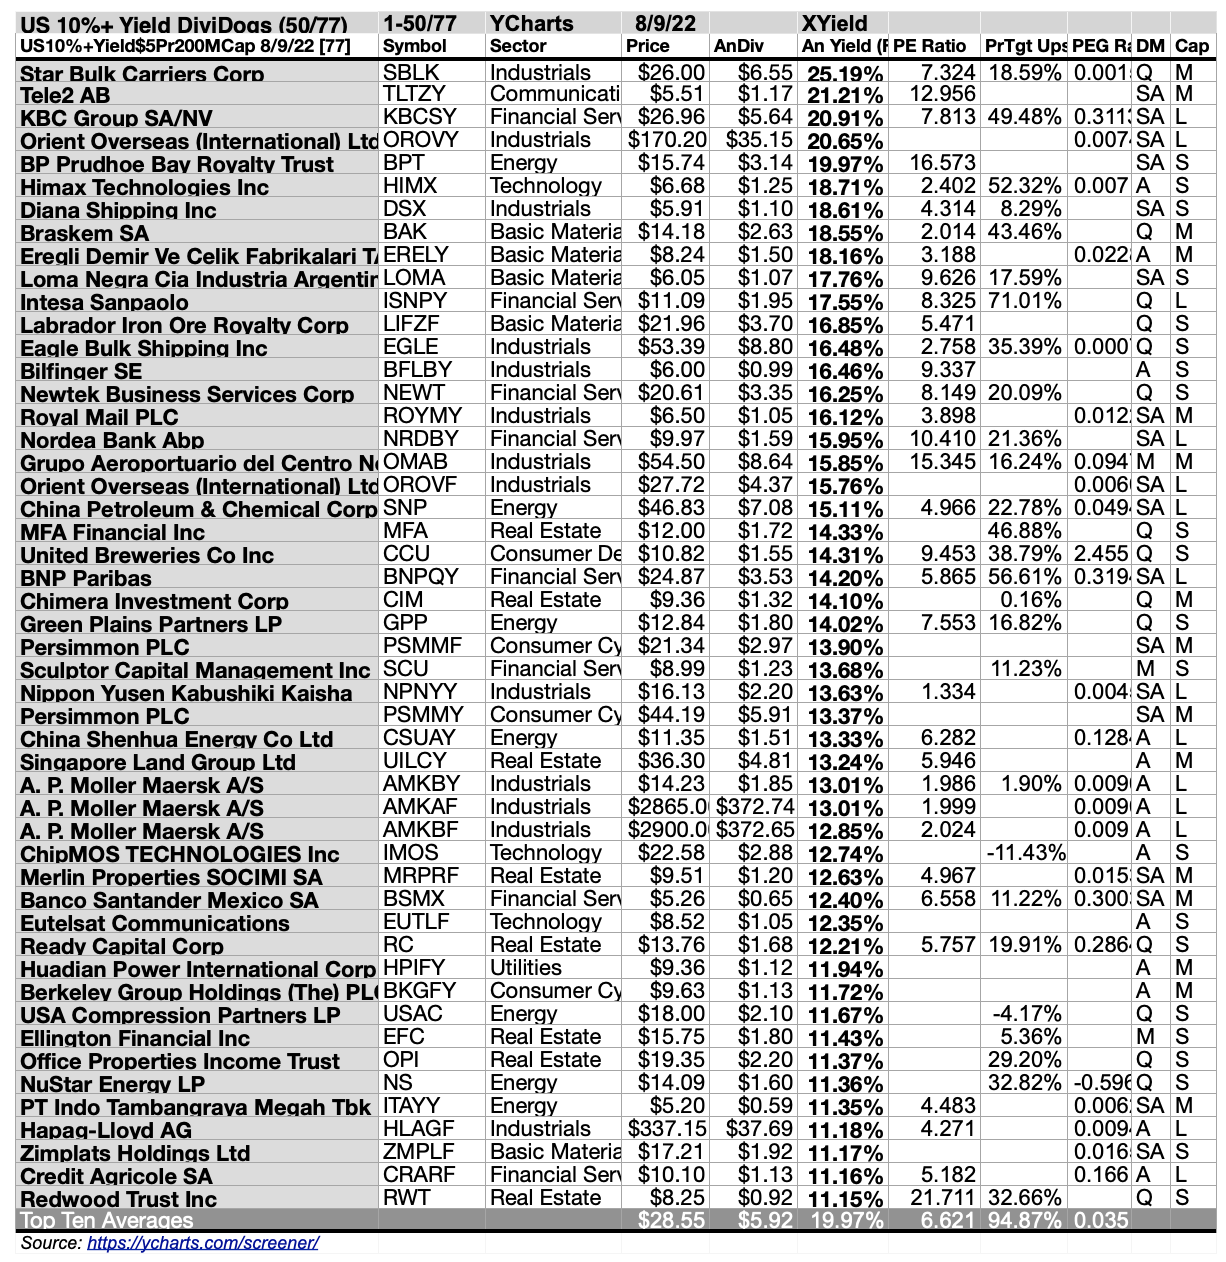
Actionable Conclusions (11-20) Top Ten 10%+ Yield August Stock Yields Ranged 17.76%-25.19%
Top ten 10%+ Yield dogs selected 8/9/22 by yield represented six of eleven Morningstar sectors.
First place was earned by the first of three industrials sector stocks in the top ten, Star Bulk Carriers Corp. [1]. The other industrials members placed fourth, and seventh, Orient Overseas (International) Ltd. (OTCPK:OROVY) [4], and Diana Shipping Inc. (DSX) [7].
Thereafter, one communication services member placed second, Tele2 AB (OTCPK:TLTZY)[2]. Then third place went to the lone financial services member, KBC Group NV (OTCPK:KBCSY) [3].
A single energy representative placed fifth, BP Prudhoe Bay Royalty Trust (BPT) [5], and a lone technology member placed sixth, Himax Technologies Inc. [6].
Finally, three basic materials stocks in the top ten, placed eighth through tenth, Braskem S.A. [8], Eregli Demir ve Celik Fabrikalari TAS (OTCPK:ERELY) [9], and Loma Negra Compania Industrial Argentina S.A. [10], to complete the 10%+ Yield top ten for August, 2022-23.
Actionable Conclusions: (21-30) Ten 10%+ Yield Stocks Showed 16.33% To 56.82% Upsides To August 9, 2023 and (31) No Down-siders Hit Negative Notes
Source:YCharts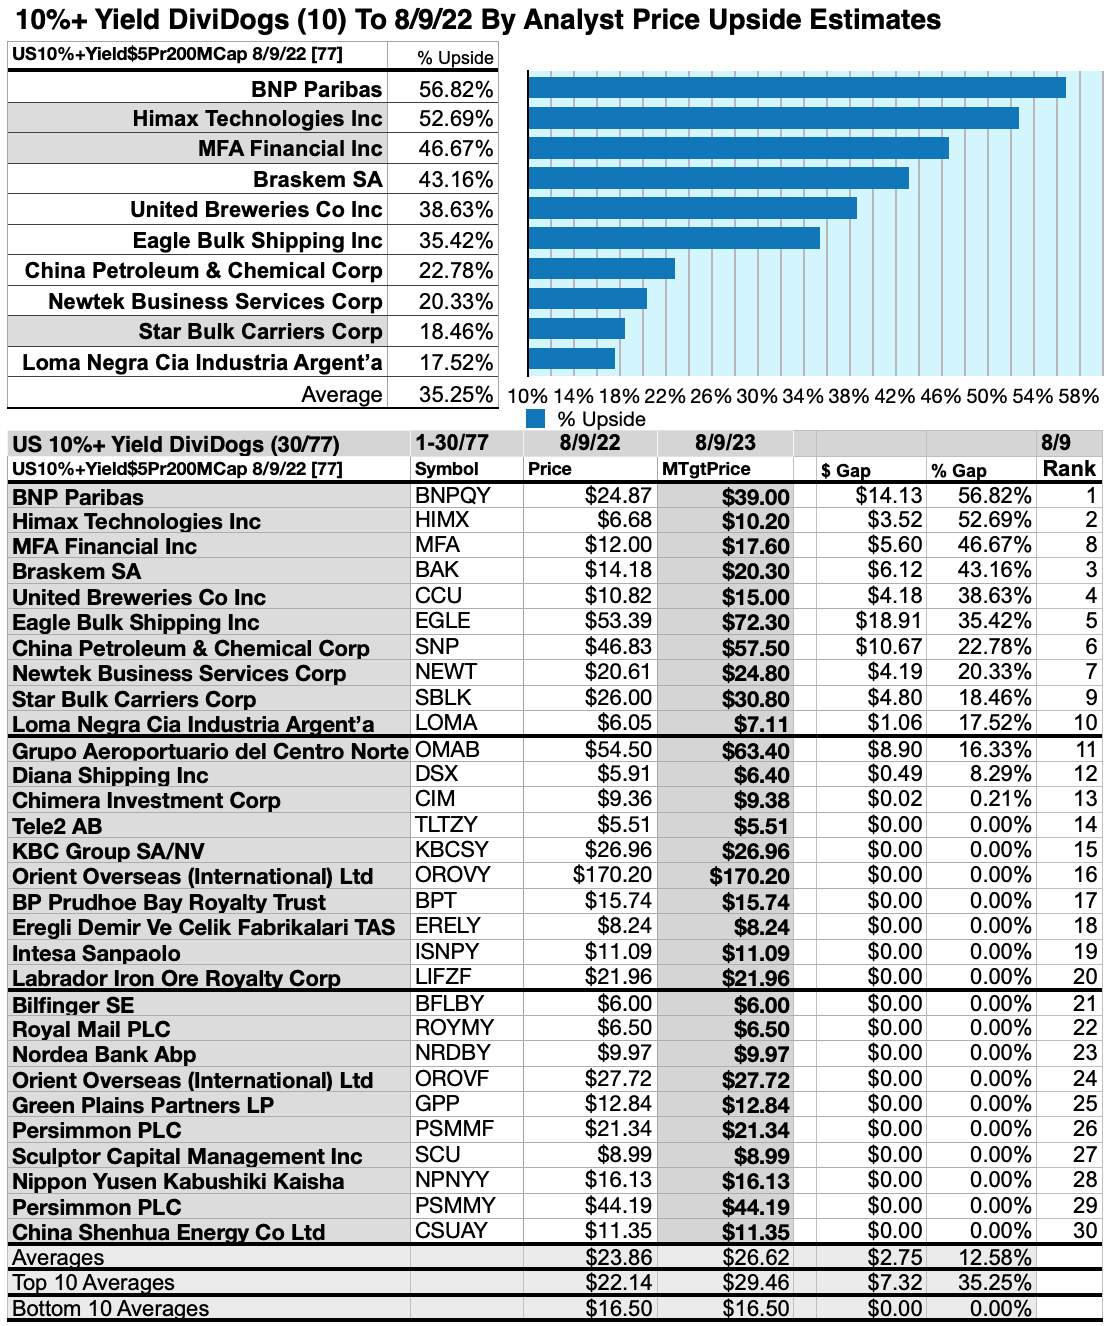
To quantify top yield rankings, analyst median price target estimates provided a “market sentiment” gauge of upside potential. Added to the simple high-yield metrics, analyst median price target estimates became another tool to dig out bargains.
Analysts Estimated A 1.84% Advantage For 5 Highest Yield, Lowest Priced, Of Ten 10%+ Yield Dogs To August 9, 2023
Ten top 10%+ Yield dogs were culled by yield for this August update. Yield (dividend/price) results verified by Yahoo Finance did the ranking.
Source:YCharts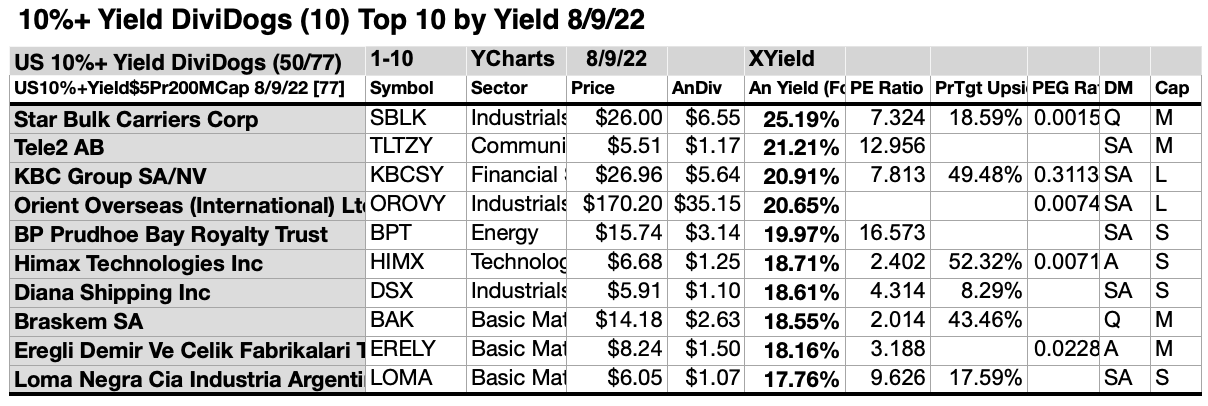
As noted above, top ten 10%+ Yield dogs selected 7/11/22 showing the highest dividend yields represented five of eleven sectors in the Morningstar scheme.
Actionable Conclusions: Analysts Estimated 5 Lowest-Priced Of Top Ten Highest-Yield 10%+ Yield Dogs (31) Delivering 17.16% Vs. (32) 70.4% Net Gains From All Ten By August 9, 2023
Source:YCharts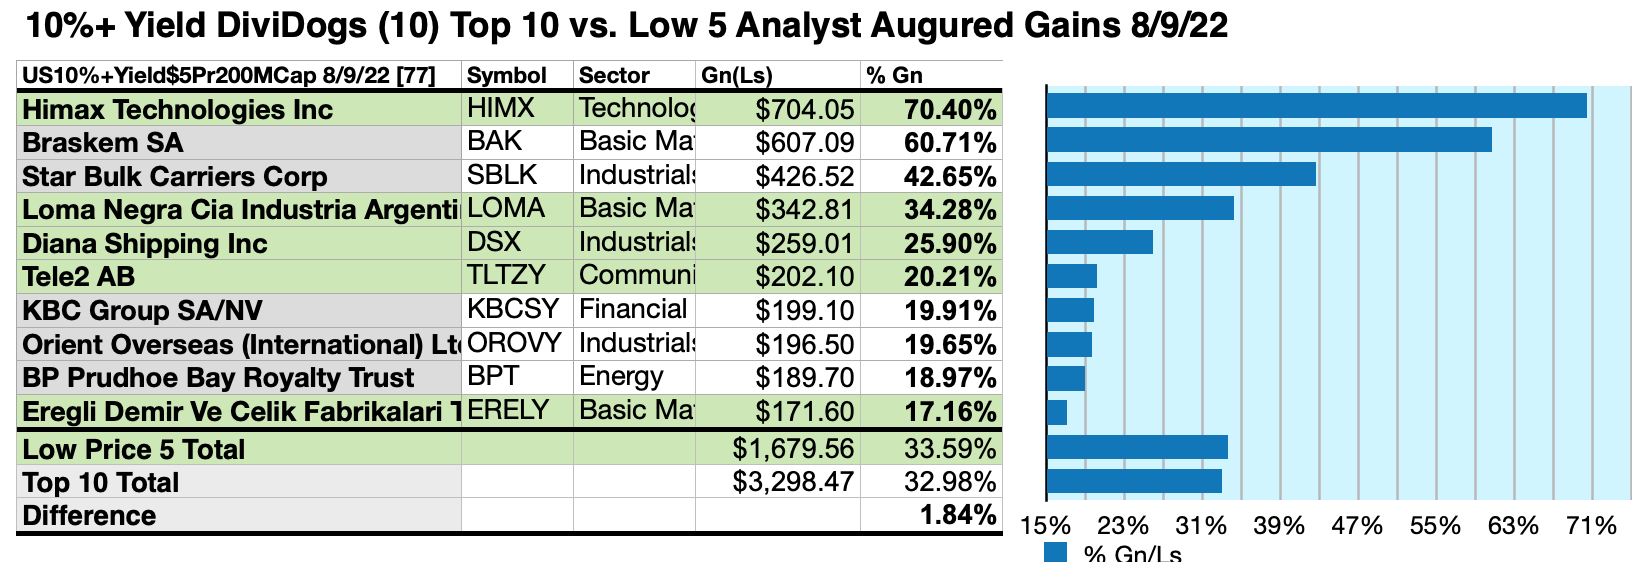
$5000 invested as $1k in each of the five lowest-priced stocks in the top ten 10%+ Yield dogs collection was predicted by analyst 1-year targets to deliver 1.84% more net gain than $5,000 invested as $.5k in all ten. The fourth lowest priced, Himax Technologies Inc., was projected by analysts to deliver the best net gain of 70.4%.
Source:YCharts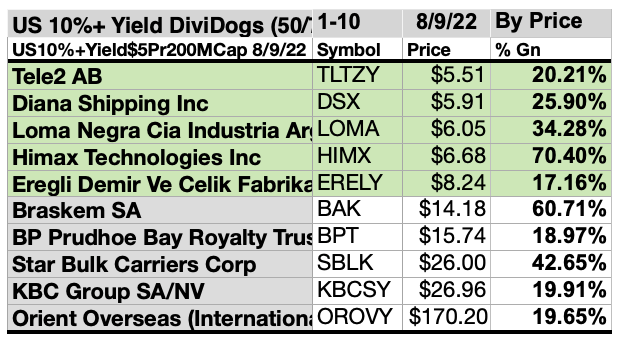
The five lowest-priced top 10%+ Yield stocks as of August 9 were: Tele2AB; Diana Shipping Inc; Loma Negra Compania Industrial Argentina S.A.; Himax Technologies Inc.; Eregli Demir ve Celik Fabrikalari TAS, with prices ranging from $5.51 to $8.24.
Five higher-priced >10%Yield dogs from August 9 were: Braskem SA; BP Prudhoe Bay Royalty Trust; Star Bulk Carriers Corp; KBC Group NV; Orient Overseas (International) Ltd, whose prices ranged from $14.18 to $170.20.
The distinction between five low-priced dividend dogs and the general field of ten reflected Michael B. O’Higgins’ “basic method” for beating the Dow. The scale of projected gains based on analyst targets added a unique element of “market sentiment” gauging upside potential. It provided a here-and-now equivalent of waiting a year to find out what might happen in the market. Caution is advised, since analysts are historically only 20% to 90% accurate on the direction of change and just 0% to 15% accurate on the degree of change.
The net gain/loss estimates above did not factor in any foreign or domestic tax problems resulting from distributions. Consult your tax advisor regarding the source and consequences of “dividends” from any investment.
Afterword
Below is the listing (alphabetically by ticker symbol), of all 77 10%+ Yield stocks from YCharts as of 8/9/22.
77 10%+ Yield Dogs For August
Source: YCharts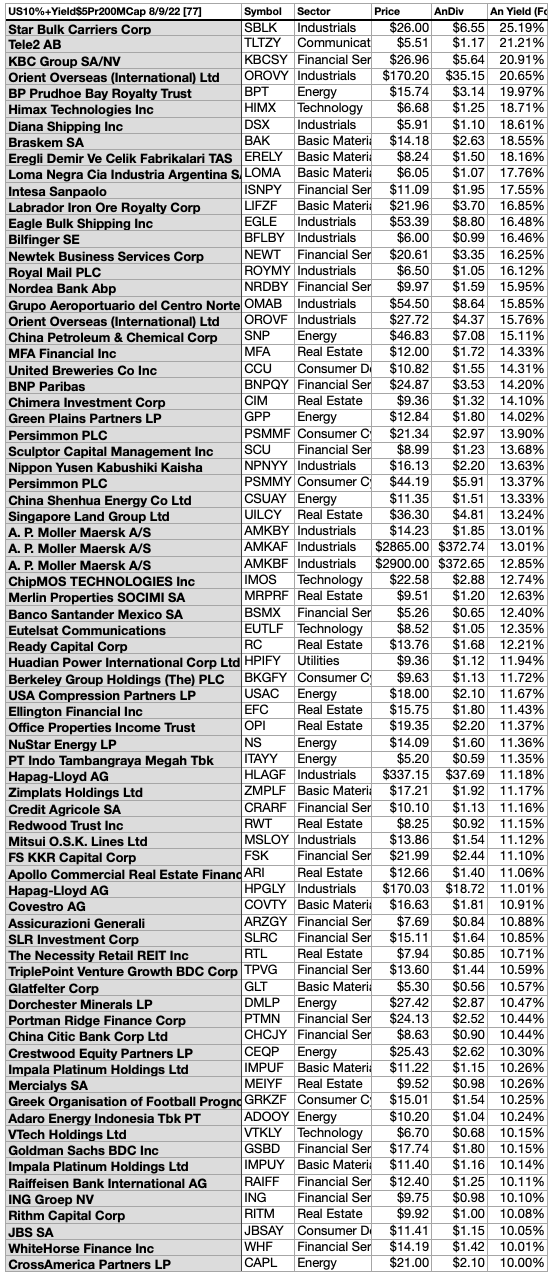
Note: 75 of the 77 stocks on this list show dividends from a $1K investment greater than their single share prices. Some investors find this condition to be an invitation to buy or, at least, look closer.
Stocks listed above were suggested only as possible reference points for your 10%Yield-Priced dividend dog purchase or sale research process. These were not recommendations.
Disclaimer: This article is for informational and educational purposes only and should not be construed to constitute investment advice. Nothing contained herein shall constitute a solicitation, recommendation or endorsement to buy or sell any security. Prices and returns on equities in this article except as noted are listed without consideration of fees, commissions, taxes, penalties, or interest payable due to purchasing, holding, or selling same.
In addition, my YCharts data supplier makes no warrants regarding their forward looking dividend accuracy. Here is their dividend yield statement: “2) We allow a dividend yield to persist for 365 days after the most recent reported dividend if a dividend is cut. Hence, this data should not be used for backtesting purposes. For true historical testing purposes, one would need the date the company announced a cut or increase in the dividend to get the proper expected dividend yield as of a given date.”
“The forward yield won’t catch changes as there is not an automated method for turning those announcements into that kind of data. A specific use case would require additional over-site after the screening had taken place to catch these instances. I wish there was an easier way, and I will submit feedback, but as of yet this has been how we’ve always done things for lack of a better method.”
Graphs and charts were compiled by Rydlun & Co., LLC from data derived from www.indexarb.com; YCharts.com; finance.yahoo.com; analyst mean target price by YCharts. Open source dog art from dividenddogcatcher.com.
Be the first to comment