

marchmeena29
Written by Nick Ackerman, co-produced by Stanford Chemist. This article was originally published to members of the CEF/ETF Income Laboratory on September 5th, 2022.
When I think of John Hancock Tax-Advantaged Dividend Income Fund (NYSE:HTD), I often think of the stability. This is one of my core positions that I can “set and forget.” That being said, closed-end funds are naturally more volatile due to the premiums and discounts they can run. On top of this, they often utilize leverage, and in the case of HTD, they use a rather hefty amount of leverage.
However, when I think of stability, it is more in the form of the underlying cash flows that the portfolio can provide. This fund’s utility and preferred components provide regular and predictable cash flows. In fact, the latest report shows that HTD’s net investment income is heading upward from the previous report. That makes what I feel is a safe distribution even safer in these tumultuous times.
Based on the latest discount, the fund is looking relatively attractive too. However, that discount/premium has been fairly volatile as of late. Of course, that volatility is being helped by the market’s overall broader volatility experienced in this bear market.
The Basics
- 1-Year Z-score: -0.86
- Discount: 4.85%
- Distribution Yield: 6.92%
- Expense Ratio: 1.15%
- Leverage: 31.83%
- Managed Assets: $1.32 billion
- Structure: Perpetual
HTD’s objective is to “provide a high level of after-tax total return from dividend income and capital appreciation.” They highlight that the fund can be used for “tax-sensitive equity income.” After all, even folks in retirement looking for fixed income should have some exposure to equities as well to maintain some diversification.
Their approach to investing is “typically investing at least 80% of assets in dividend-paying securities.” With that, they will “typically emphasize preferred and common securities in the high dividend-paying utility sector.”
The portfolio is dominated by utility exposure in the equity market while at the same time having a healthy allocation to financials via preferred security exposure. The financial sector issues preferred to help them maintain their required capital ratios. Due to the Dodd-Frank Act, only non-cumulative perpetual preferred count. Financials also comprise a large portion of the corporate bond exposure for HTD.
On a bit of a side note, preferred aren’t always as defensive in terms of their price. One thing that plagues the security type is relatively lower volumes. That can lead to some wild swings when people are trying to rush for the exits. On the other hand, the dividends are generally safer, so the cash flows hold up incredibly well.
Leverage Discussion
The fund’s expense ratio comes to 1.15%, which is fairly typical of a CEF. When including the leverage expenses, we come to 1.57%. That’s a rather reasonable expense ratio for a CEF, despite the generally more elevated leverage the fund utilizes. It can be a more volatile fund with higher leverage. That being said, investing in what is seen as relatively more stable assets is more of a natural fit for higher leverage.
They are still paying an interest rate of one month LIBOR plus 0.625% on their leverage. That will be replaced as LIBOR continues to be phased out. The important part here is that the leverage will continue to be based on a variable rate. That means any interest rate increase will increase the fund’s leverage expenses. At the end of April 30th, 2022, the interest rate came to 1.43%. That’s quite the leap since the average interest rate during the six months preceding was 0.88%.
Now, the managers aren’t just sitting back and taking these increased interest rates. They have set up hedges to work against these increasing rates. They are short 10-Year U.S. Treasury futures contracts on a notional basis of $123.876 million. When rates rise, that means the price is decreasing. Therefore, these shorts become more valuable to offset the negative impact of increased interest rates.
HTD Semi-Annual Report (John Hancock)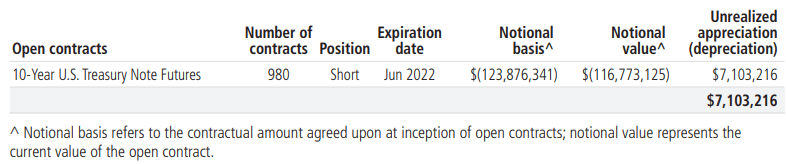
Additionally, they then have interest rate swaps against a notional amount of $107 million. That essentially takes a portion of their floating rate interest rates and turns them into a fixed rate. At this time, that rate is still higher than what the fund was paying at the end of April. Now, though, one month LIBOR was 2.56% at the time of writing. Slapping the 0.625% spread on top of this gives us an interest rate of 3.185%. That makes the fixed 2.136% not look so bad anymore. Unfortunately, the maturity date for these contracts is October 2022. In which case, they could reenter into more agreements, but it would likely be a higher cost.
HTD Semi-Annual Report (John Hancock)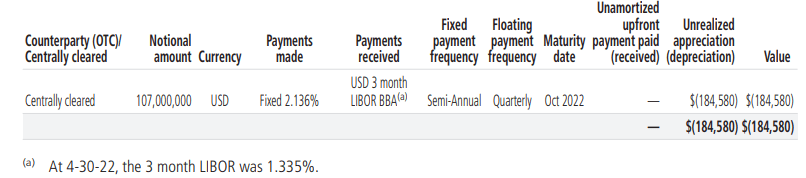
Performance – Holding Up Well, Volatile Discount/Premium
On a YTD basis, we can see that HTD has been holding its own. On a total NAV basis, the fund is positive. However, the share price is negative, and that has meant a better opportunity as the fund’s discount widens out.
I’ve also included some relevant ETFs, that includes the Utilities Select Sector SPDR (XLU). XLU has been holding up extremely well as a defensive play. I’ve also included the iShares Preferred and Income Securities ETF (PFF). That helps represent just how far down preferreds have come this year due to pressure from interest rates. As I said, when I think about the stability of the portfolio, I’m more looking at the cash flows these assets can provide – not the actual pricing, which can be volatile.
Additionally, I’ve included the SPDR S&P 500 (SPY) for the context of how things look compared to the broader market.
Ycharts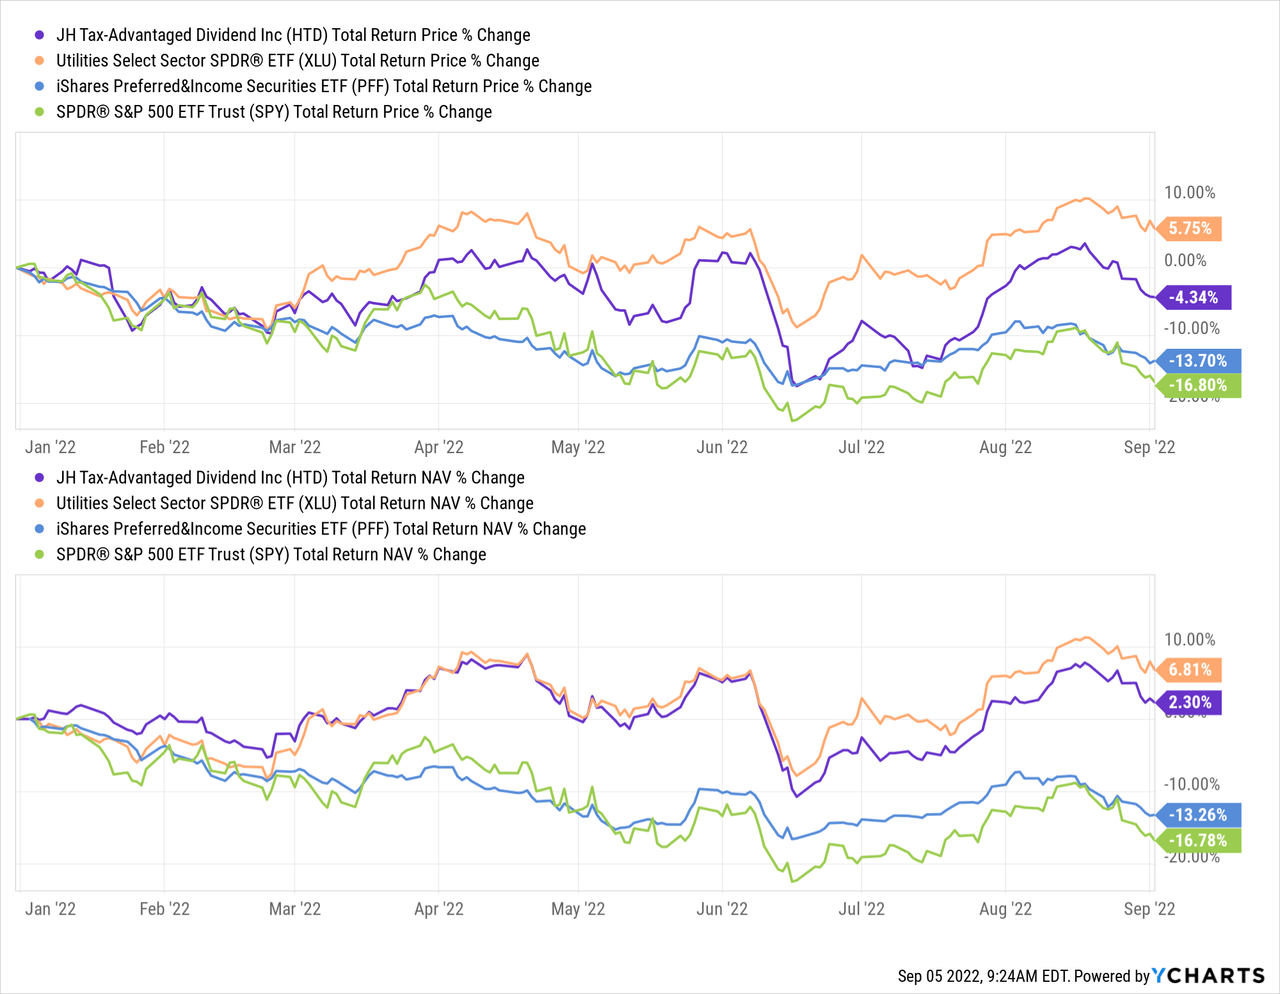
For the fund’s discount, we see that it has been quite volatile in the last year. That’s really just been a function of the fund’s price being more volatile than the NAV. Though, the NAV volatility has been providing quite the ride for the year too.
Ycharts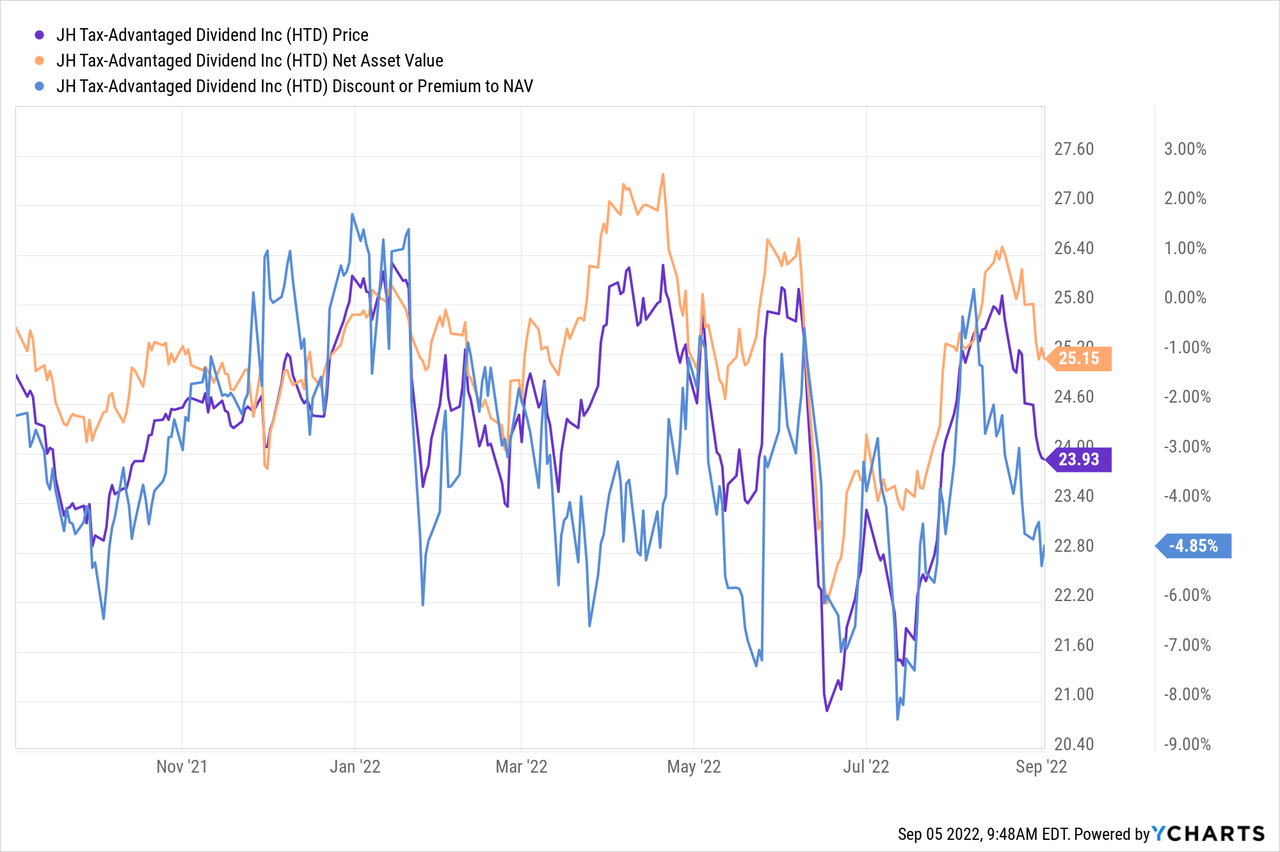
On a longer-term basis, the fund is trading at a more narrow discount than we’ve seen. In particular, there were several periods we could have bought this fund at 10%+ discounts. From around 2013 to 2017, that was a fairly common level for the fund to be trading at.
Ycharts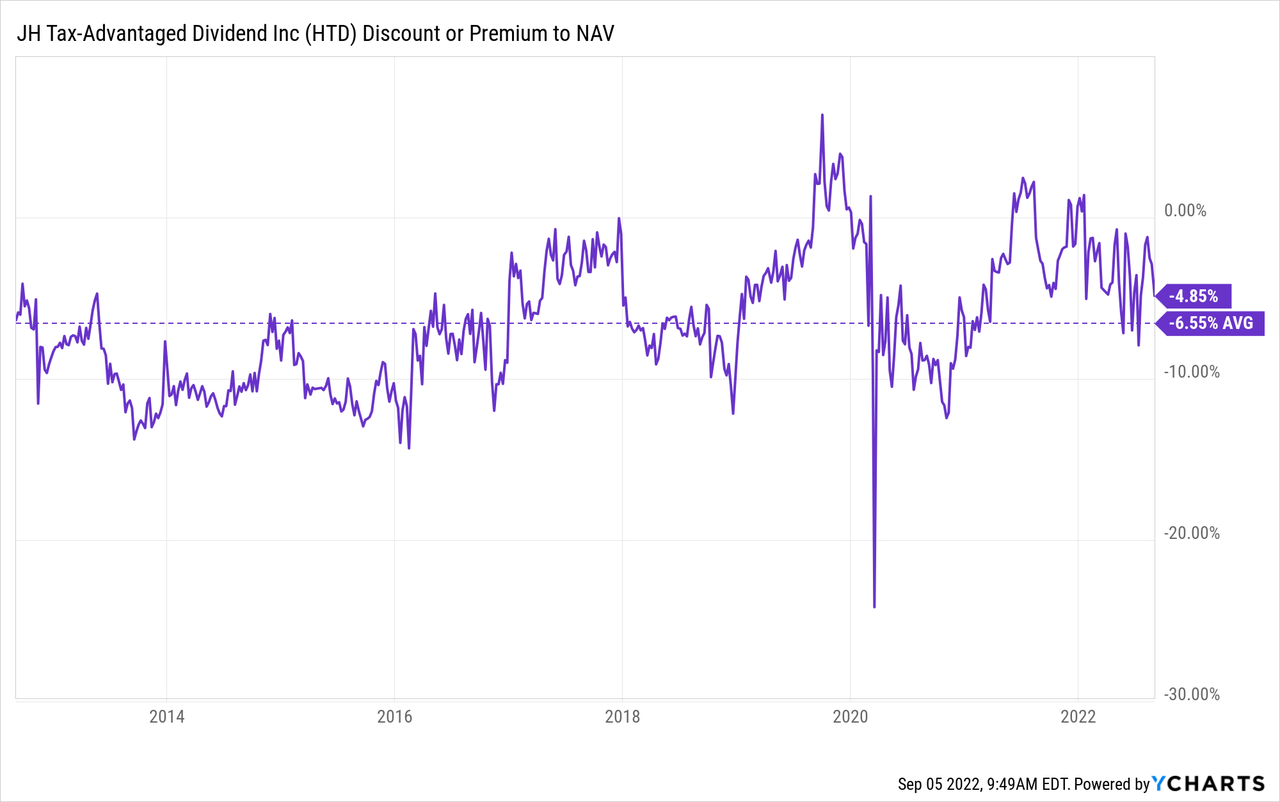
Distribution – Stability
One thing that I continue to mention about this fund is the stability of its distribution. That’s one of the reasons why it is a core position in the first place. They’ve only had one cut, and that was around the 2008/09 financial collapse. They have raised several times but haven’t beaten that high-water mark of $0.14 per month.
HTD Distribution History (CEFConnect)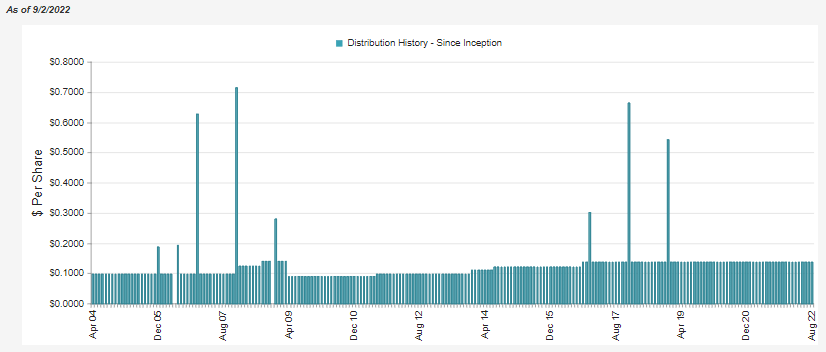
The latest report only shows that the payout has been strengthened with rising net investment income.
HTD Semi-Annual Report (John Hancock)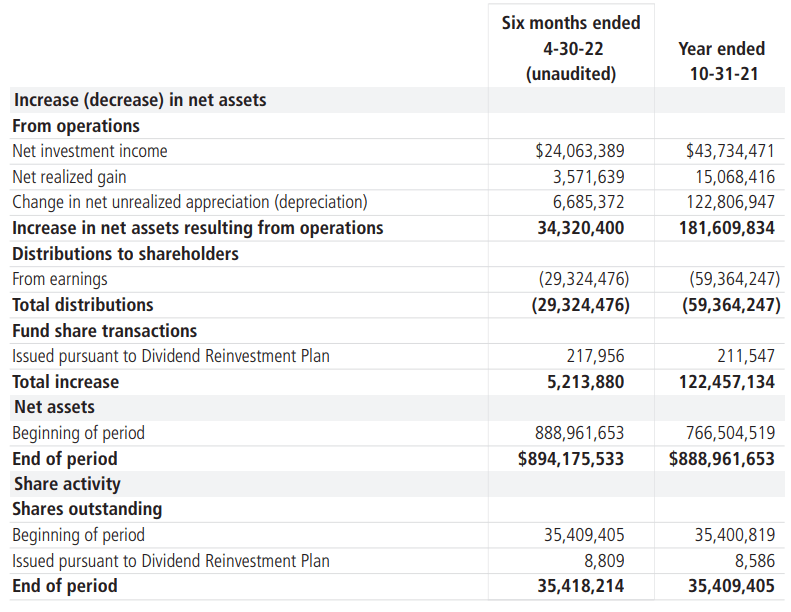
If we annualized out the latest figure, we would see an increase of 10% in NII. However, year-over-year, it is about flat with around a -1% decline from last year’s report. Still, the latest report is encouraging because the NII coverage is 82%.
That means they still require capital gains to fund their distribution, but a fairly minimal amount. It can be difficult for funds to generate the gains needed during a bear market. For HTD, it is a different story since the portfolio is holding up relatively well, with strength in utilities. Additionally, the hedges they have in place come in the form of capital gains and wouldn’t be reflected on the NII.
In that case, we can see that the futures contracts paid off big time. In fact, it was the realized gains in the futures that provided the only realized gains for the fund, pushing it into the gain territory. The swap contracts were the laggard but, on an unrealized basis, contributed to and offset those losses.
HTD Semi-Annual Report (John Hancock)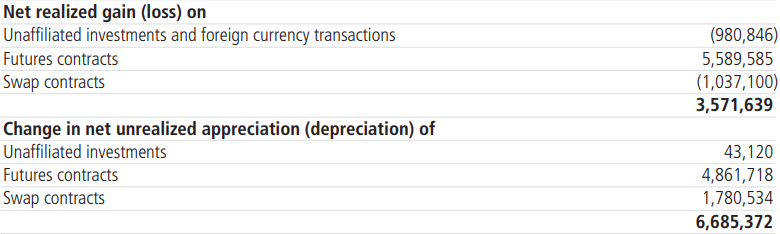
All this gives me confidence that HTD can maintain its distribution with little risk of any required cut. We would have to significantly more losses from here before I think it would even be a consideration.
For tax purposes, it comes to little surprise with the fund’s name that they are tax-advantaged. That isn’t to say there are no tax obligations, but they target distributions that will be classified as primarily long-term capital gains or qualified dividends. This was the case in 2021; it was 100% qualified dividends and long-term capital gains.
HTD’s Portfolio
HTD has a rather low turnover rate, coming in at just 5% over the last six-month period. It was as high as 20% in fiscal 2020, but that is still relatively low. Therefore, we don’t see a lot of material changes from update to update. The utility and financial exposures remain the dominant weightings. This is for the Q2 2022 that ended June 30th.
HTD Sector Breakdown (John Hancock)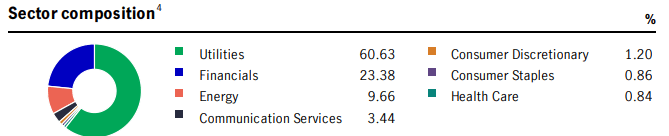
In our previous report, looking at the end of Q1 2022, we saw utilities weighing 61.99% and financials at 21.51%. Meaning we have seen just a bit of reduced exposure to utilities and marginally increased exposure to the financials/preferred holdings.
Utilities make up the largest allocation of the fund, and that is spread out amongst mostly electric utilities, with multi-utilities also having a significant weighting. Here again, banks are a large portion of the preferred corporate bond exposure that we’ve seen in the fund.
HTD Industry Breakdown (John Hancock)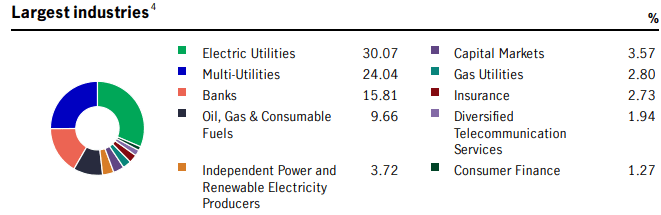
We are given the asset class breakdown of the fund as of April 30th, 2022, in the latest semi-annual report. We can see common stocks make up nearly 60% of the portfolio. We then see that 21.8% is made up of preferred and another 17.5% in corporate bonds.
HTD Asset Allocation (John Hancock)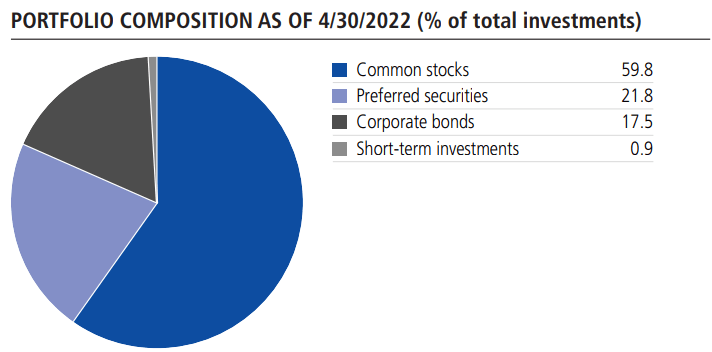
Looking at the top holdings, we see limited changes too. Again, that’s consistent with the fund’s lower turnover. The changes seem to come more from the natural gyrations of share prices than active management. The top ten make up 36.12% of the portfolio. That’s a fairly large amount, but the top holdings aren’t necessarily at some extreme weightings, either.
In total, they report 106 total positions. I would say that leaves them diversified amongst their area of investments. That should lead to fairly limited individual stock risk taking down the portfolio. However, they will still be subject to sector risks in utilities and preferreds.
HTD Top Ten (John Hancock)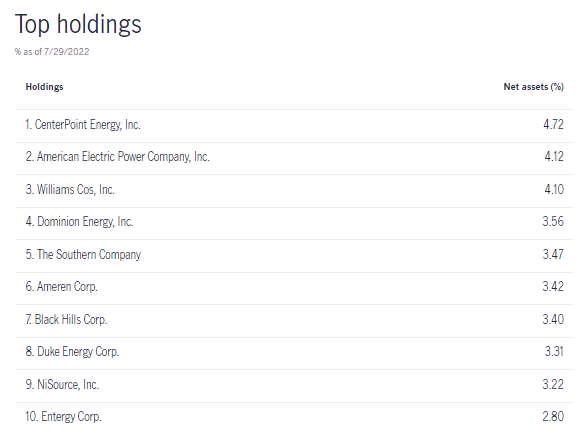
One position to make an appearance on the top ten since our previous update was Dominion Energy (D) and that replaced BP (BP). That being said, BP was still a position. HTD holds the common stock and a corporate bond of Dominion Energy. For BP, they hold only the ADR shares. In this case, D has been holding up better than BP in the last several months. That seems to be the leading contributing factor to BP falling out of the top ten.
Ycharts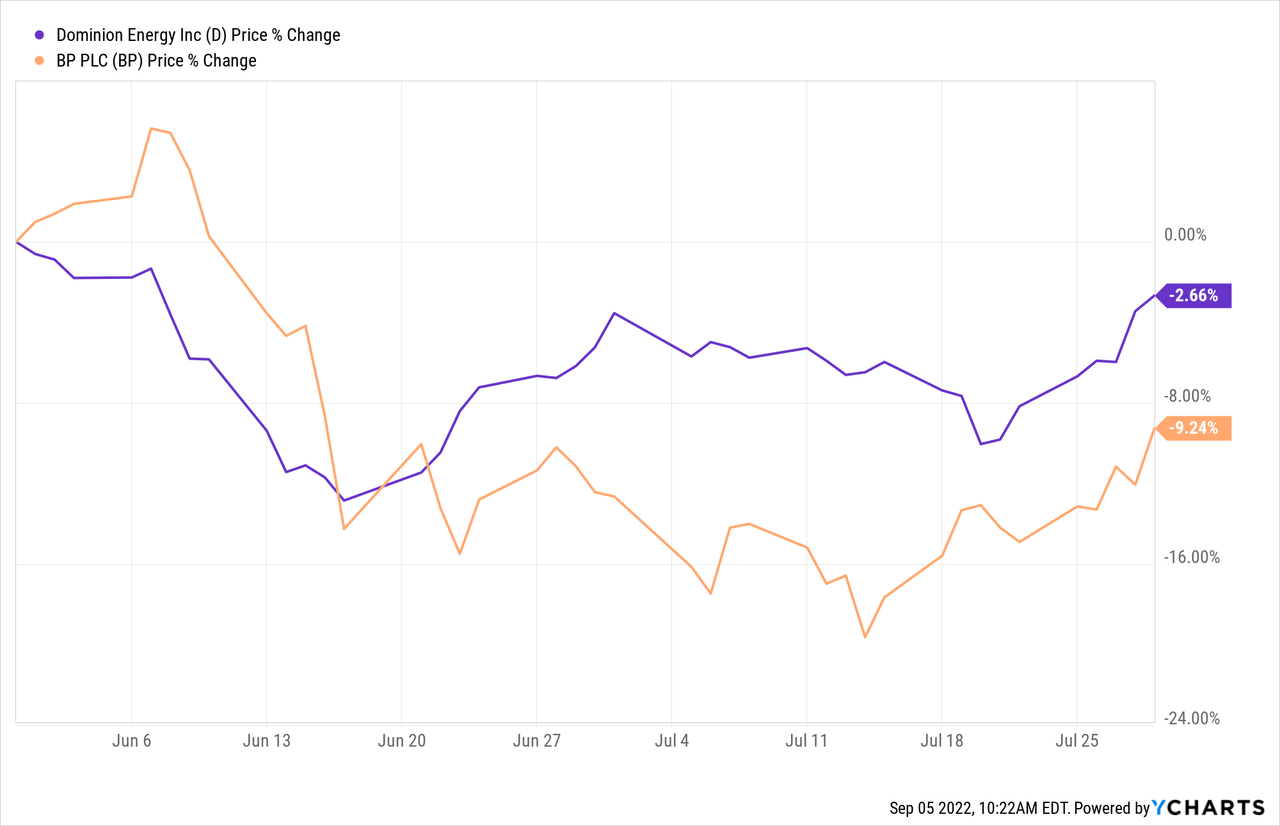
Conclusion
HTD remains a solid fund that is worthwhile investing in. They can navigate in almost any environment and provide stability through their distribution. That distribution is supported significantly by the underlying dividends and interest collected. They are hedged for higher rates at this time, which has helped cover the relatively small shortfall in distribution coverage. While a deeper discount would be more desirable, I view HTD as a long-term income play that can be added even at these levels.
Be the first to comment