

Baris-Ozer/iStock via Getty Images
Investment Thesis
STAG YTD Stock Price
Seeking Alpha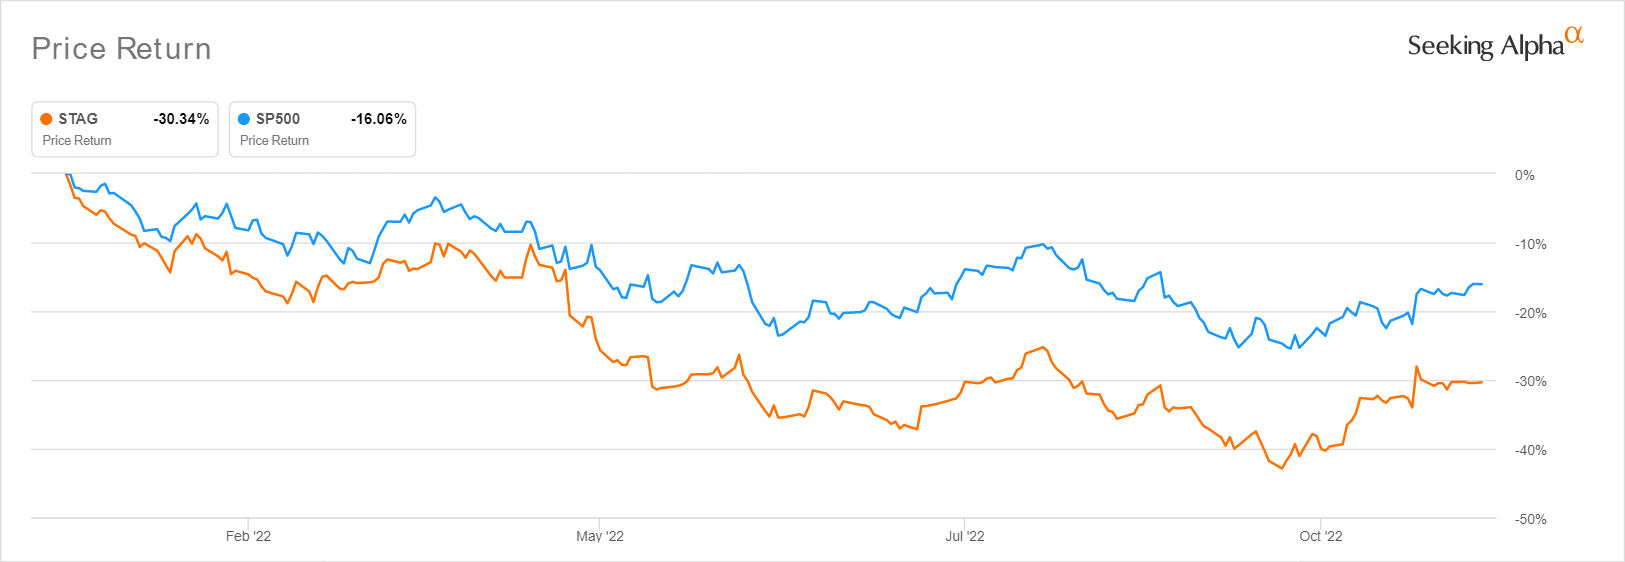
Despite the drastic market-wide correction thus far, affecting the S&P 500 Index by -16.06% and STAG Industrial (NYSE:STAG) by -30.34% YTD, the stock continues to report a more than decent 5Y Total Price Return of 44.9% and 10Y returns of 205.9%.
The latter is no wonder, since STAG has been paying a steady dividend payout with consecutive growth over the past ten years, way improved against the sector median of seven and one year, respectively. Furthermore, the peak recessionary fears have provided its investors with an exemplary 5.8% forward dividend yield through FY2024, against its 4Y average of 4.51% and sector median of 4.32%. That benefit is, of course, reserved for those who had loaded up at the recent rock-bottom levels of $26.85 in early October 2022.
Otherwise, due to STAG’s excellent FQ3’22 earnings call and the upbeat October CPI report, we expect these tsunami levels of confidence to continue lifting up all boats market-wide. 74.7% of analysts now expect the Feds to pivot with a 50 basis points hike in December, similar to the Bank of Canada’s recent moderation. Assuming so, we expect the market to exit these blood-bath levels soon and signal an optimistically sustainable recovery through 2023. Mr. Market is always forward-looking and thus, investors should not miss this boat indeed.
Naturally, those who add at these levels must be comfortable with some volatility in the short-term, since this rally may also be moderately digested due to the raised terminal rates to over 6%. However, given how there is a proverbial light at the end of the tunnel, we reckon that the risk/ reward ratio is still attractive enough for those with higher risk tolerance and long-term investing trajectory.
STAG Has Performed Brilliantly In Improving Liquidity, While Expanding Margins
STAG Revenue, EBIT %, AFFO ( in million $ ) %, and Dividends
S&P Capital IQ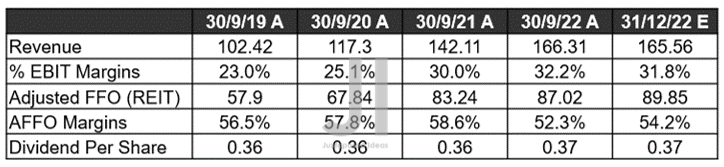
In its recent FQ3’22 earnings call, STAG reported revenues of $166.31M and EBIT margins of 32.2%, partly aided by the $1.3M settlement payment for the quarter. Thereby, it made sense that market analysts expect a normalization by FQ4’22, with the projected revenues of $165.56M still indicating an excellent YoY growth of 12.1%. Furthermore, the company is expected to report an AFFO of $89.85M and an AFFO margin of 54.2% for the next quarter, representing further expansions in its profitability, despite the rising operating costs sequentially by 13.31% over the last twelve months.
It is no surprise, since STAG continues to report a great adj. retention rate of 86.1% in FQ3’22, while same-store NOI grows excellently by 5.6% QoQ and 5% YoY, despite the tougher YoY comparison. With a remarkable occupancy rate of 98.2% and a weighted average of the contractual lease term of 4.9 years across its portfolio by the latest quarter, the company remains well-positioned for stability over the next few years, with no large move-outs expected in 2023. We also expect to see steady expansion in the top and bottom line growths, once the market sentiments improve and capital funding returns with the Feds’ speculative pivot by December 2022.
STAG Cash From Operations, Acquisitions, Cash Flow, and Debts ( in million $ )
S&P Capital IQ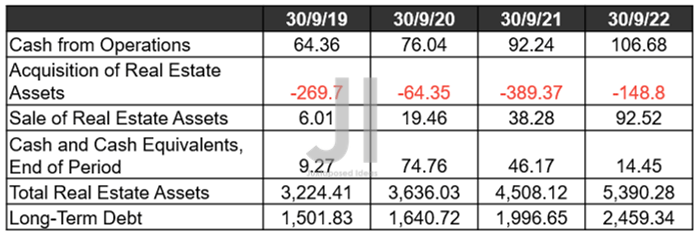
It is evident that STAG has been efficiently scaling back on its acquisition YoY, with the management reducing its expected volume to $460M for FY2022, against the original projection of up to $1.1B or FY2021 levels of $1.3B. The prudence is also visible in its projected acquisition cash cap rates of up to 5.4% for the fiscal year, compared to 5.6% in FY2021 and 6% in FY2020. Therefore, the management has proved highly competent in its decision to temper growth, due to the worsening macroeconomics and reduced availability of capital funding in the market.
Nonetheless, STAG investors need not worry, since its balance sheet proved sufficient with cash/ equivalents and accounts receivable of $116.6M by the latest quarter, compared to $113.11M in FQ2’22 and $130.02M in FQ3’21. Furthermore, there is no immediate long-term debt maturity through 2024, with only $200M due January 2025 and the rest well-laddered through 2033. This is obviously attributed to the management’s decision to refinance its previous term loans, though the impact on the elevated interest rate environment is evident in its new interest swaps of 3.32%, indicating an increase of 14.53% from previous terms.
However, we remain optimistic for now, since these strategies will provide STAG with improved liquidity through the uncertain two years ahead. Thereby, also preserving its dividend safety at the same time.
STAG Projected Revenue, EBIT %, AFFO ( in million $ ) %, Dividends and Net Debt
S&P Capital IQ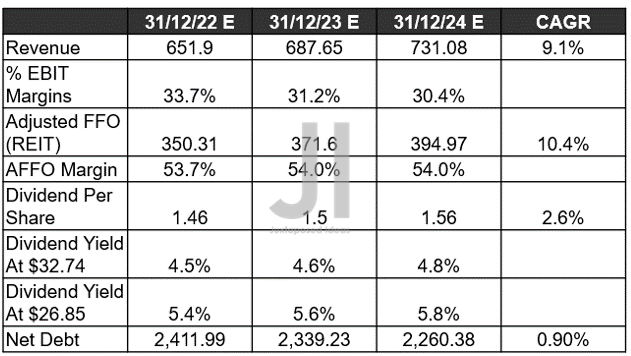
Over the next three years, STAG is still expected to report excellent revenue and FFO growth at a CAGR of 9.1% and 10.4%, respectively, against pre-pandemic levels of 17.5%/23.5% and hyper-pandemic levels of 17.7%/13.2%. Though these numbers represent notable deceleration ahead, we are not concerned at all, given the sustained expansion in its margins. By FY2024, the company is expected to deliver remarkable EBIT and FFO margins of 30.4% and 54%, against FY2019 levels of 24.1%/56.44% and FY2021 levels of 29.2%/52.25%. Impressive, despite the supposed recession in 2023.
Furthermore, STAG is expected to further increase its dividend payouts to $1.56 by FY2024, indicating dividend yields of 4.8% based on current stock prices. Not too bad indeed, against FY2022’s average yield of 4.23%. Thereby, insulating some of those inflationary headwinds ahead.
So, Is STAG Stock A Buy, Sell, or Hold?
STAG 5Y EV/Revenue and Price/FFO Per Share
S&P Capital IQ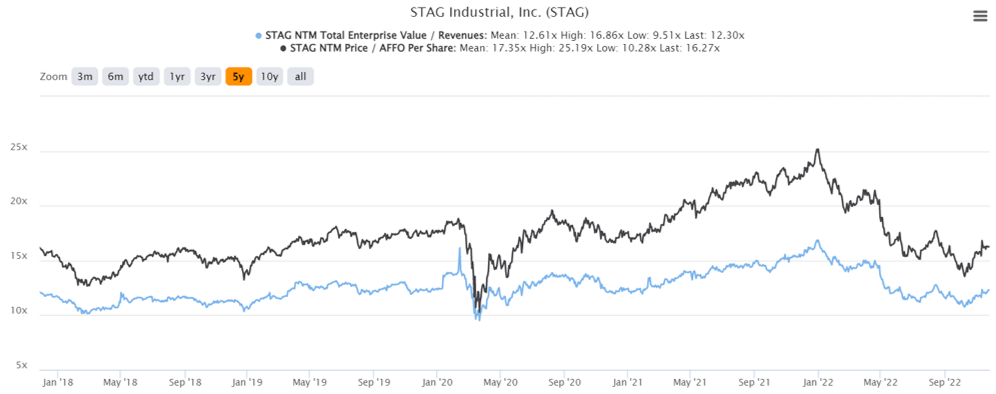
STAG is currently trading at an EV/NTM Revenue of 12.30x and NTM Price/FFO Per Share 16.27x, lower than its 5Y mean of 12.61x and 17.35x, and YTD mean of 12.93x and 17.89x, respectively. The stock is also trading attractively at $32.74, down -32.17% from its 52 weeks high of $48.27. Nonetheless, investors must also note the minimal 15.55% upside to the consensus price target of $37.83, pointing to its recent 23.26% recovery from the 52 weeks low of $26.56. Combined with the fact that the stock is trading above its 50-day and 100-day moving average, conservative investors may want to wait for a deeper retracement to a price target of mid $20s before adding to their portfolio.
Nonetheless, we prefer to rate STAG stock as a speculative Buy at current levels, due to its excellent projected expansion in top and bottom lines through FY2024. Thereby, likely triggering an upward rerating in its price target then.
Be the first to comment