


DNY59
In July, I covered the ProShares UltraPro Short QQQ ETF (NASDAQ:SQQQ) in “SQQQ: The Nasdaq 100 May Be Headed For Another Leg Lower.” Since then, the Nasdaq 100 and most stocks have declined materially, causing SQQQ to rise by around 25%. The Nasdaq 100 index currently rests near its annual low after losing around a third of its value this year. Investors and speculators are racing to either purchase “discounted” stocks or betting on an even more giant wave of declines. The Nasdaq index has fallen significantly this year, which is not atypical of most recessionary situations. That said, it also comes off six years of immense gains and remains around 500% above its 2007 peak.
As described in my last article regarding SQQQ, the fundamental situation regarding stocks, particularly technology stocks, is bearish. Consumer, business, and banking fundamentals are weak as sentiment trends lower. Rising interest rates directly lower the fair value of future cash-flow growth. Even more, shifting economic winds have caused many technology stocks to see significant declines in earnings as inflation cuts into profit margins.
More recently, there has been a massive decline in mergers and acquisitions and IPO activity. Internationally, the rising US dollar (fueled by rising interest rates) has triggered a liquidity crisis as global central banks race for dollars to stop falling exchange rates. This trend has become most extreme in Japan, which has seen its currency, the Yen, drop to a 32-year low following failed market intervention efforts. The dollar shortage crisis is troublesome for large technology companies due to their global footprint and the negative impact on the banking system.
Put simply, it is not a good time to be a prominent technology giant. Many economic factors are straining profitability and valuation potential. Since there are so many fronts in which this is occurring, it is improbable most companies in the Nasdaq 100 will see their earnings recover soon. Indeed, I expect most to see negative EPS and sales trends over the coming year. Already, the revenue growth estimates for six of the top seven firms in the Nasdaq 100 have revised sharply lower this year. See below:
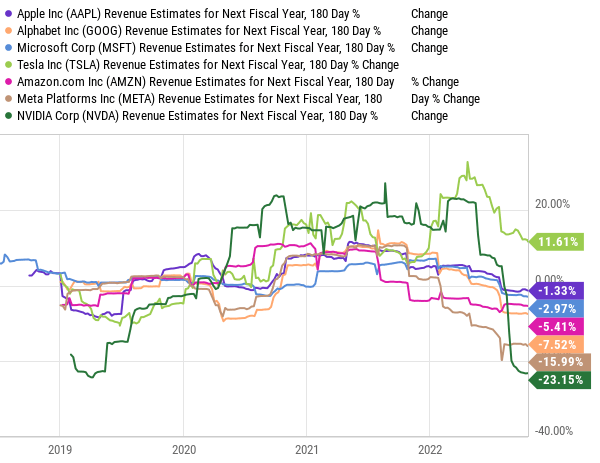
Nasdaq 100 Top Seven Holdings – Forward Revenue Estimates Change 180 Days (YCharts)
All of these companies, besides Tesla (TSLA), have seen sharp revisions to forward sales this year. The pace of negative revisions in 2022 is more aggressive than in 2020, signaling a significant fundamental struggle within these companies. Over recent weeks, many of these companies announced even more extensive corporate layoffs to try to offset sharp declines in profitability.
The fundamental situation regarding growth stocks is clear. That said, given the significant declines in their stock prices, many investors are rushing to buy these firms at a perceived discount. Indeed, it is infrequent for the Nasdaq 100, or most large stock indices, to lose a third of its value in a given year. With this in mind, I believe it is an opportune time to look closer at the technical situation regarding the Nasdaq 100 and the stock market to judge better its “bottom” or “falling knife” potential.
Signals From the Options Market
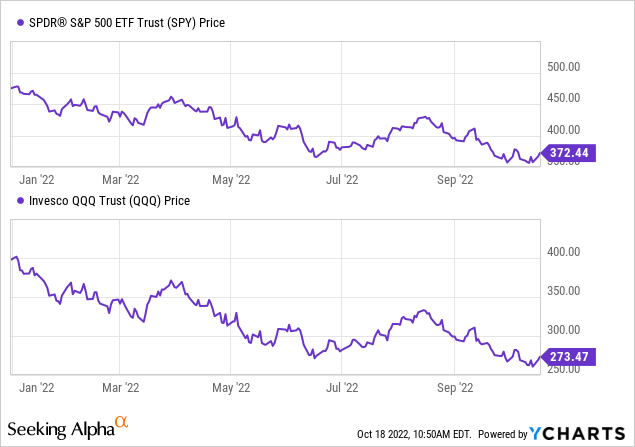
Option pricing data gives us a second-level view of the stock market’s technical backdrop. The Nasdaq 100 and the S&P 500 are floating around their 52-week low and, for the past month, have not budged in either direction. The market rests on the support level set in June, indicating strong investor demand at this level. However, the market refusal to trend higher signals investor interest only exists as long as stocks remain low. This situation may result in mass capitulation or margin calls if the Nasdaq 100, or S&P 500, breaks below the critical support level. See below:
I believe these key stock market indices are either at their bottom or are resting on the edge of a precipice. There is significant resistance to further declines, which means if the market breaks lower, we may see a large wave in selling activity as “dip buyers” race to cover losses. This potential could be exacerbated by a bond-centric liquidity event within the monetary system that may or may not be covered by the Federal Reserve. Again, the economic fundamentals for most large companies point to a negative trend in profitability. That said, the Nasdaq 100’s TTM “P/E” is at 23X, though I do not see this as a “low” valuation; it is 35% below its level last year – giving it some discount potential.
With the market on a key ledge, option market speculators have raced to purchase volatility hedges, causing the implied volatility levels for both the Nasdaq 100 and the S&P 500 to rise dramatically. See below:
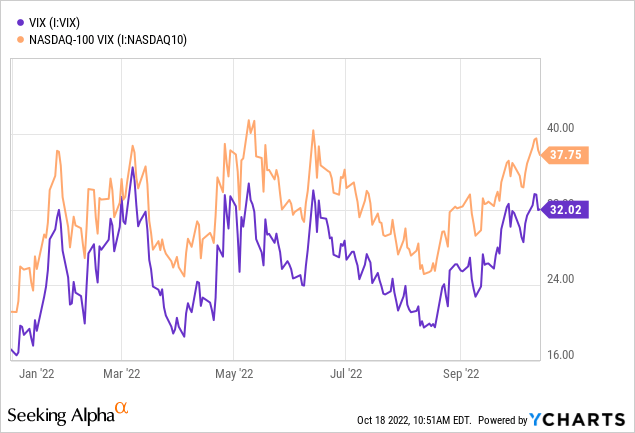
The Nasdaq 100’s current implied volatility is ~38%. This measure indicates the options market is bracing for a 38% standard deviation in yearly change potential. In simpler terms, the market expects (or is ~70% confident that) the Nasdaq 100 to be between roughly 6,940 to 15,443 (38% higher or lower) a year from now. That range is simplified as option volatility expectations can skew higher or lower and differ on duration. Still, the critical point is that the options market is bracing for immense volatility in the Nasdaq 100 this year.
The SKEW index measures changes in option implied volatility levels on near-the-money vs. further out-of-the-money options. It is a measure of the S&P 500, but since many of the stocks in the Nasdaq are the same, and both indices are closely correlated, it is a valuable measure for assessing the Nasdaq 100. The higher the SKEW index, the more the options market braces for a surprisingly large move in the stock market. In simpler terms, the “VIX” measures the stock market’s overall perceived risk, while the SKEW indicates the probability of an even more significant move than implied by the VIX (i.e., “tail risk“).
The SKEW index is shallow today, though it was extremely high in mid-2021. See below:
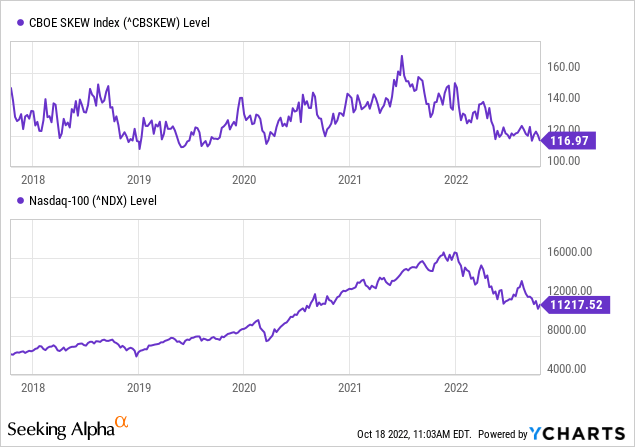
Today’s lower SKEW index indicates the options market does not expect volatility to rise much higher than it already is. Far out-of-the-money options carry similar implied volatility levels as close-to-the-money options, meaning few option investors are betting on a giant “black swan” type of event. This situation differed dramatically in 2021 when the VIX index was generally low, and both the S&P 500 and the Nasdaq 100 were at all-time highs. During that time, while risk perception was down, the options market braced for a potential spike in volatility led by an outsized market move. Indeed, this is nearly precisely what has occurred over the past twelve months.
Still, the SKEW index is not always so prophetic, and a low SKEW level does not imply low risk. Specifically, it means most buying activity in the options market is occurring at strike prices near current stock prices. This situation suggests most speculation and hedging activity is placed around the market’s critical 52-week low support level. As such, if the market breaks below its 52-week support level, then there could be immense volatility within the options market as speculators (and hedgers) race to re-position and re-price, exacerbating liquidity risks.
Finally, we can look to the Put-to-Call ratio to tell us the market’s perceived probability of bullish or bearish outcomes. A speculator or hedger buys a put option to benefit from downside moves and a call option to benefit from a rally. Generally, the ratio is below 1.0 and averages around 0.8-0.9 as more speculators seek the upside leverage in call options. When the ratio is below that range, it indicates option market participants have a somewhat bullish bias as call option activity is much larger than put option activity. This measure was at significant lows during the 2020-2021 market rally but has trended higher. See below:
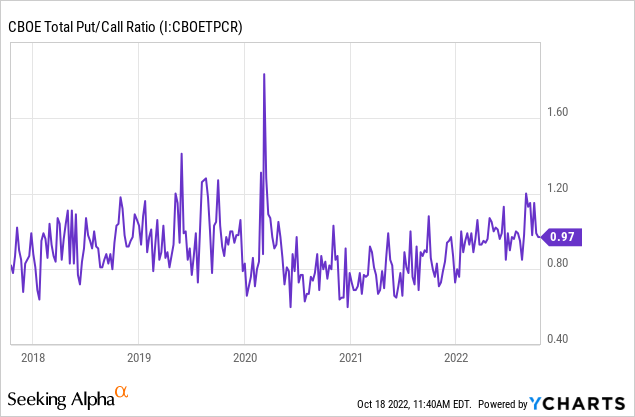
Today’s put-to-call ratio is relatively high but not exceptionally so, indicating a slight bias toward a bearish market move (from the average). A high put-to-call ratio does not necessarily mean the stock market is likely to decline. More specifically, it implies option market participants are bracing for a decline. Paradoxically, a high put-to-call ratio can be bullish since it means market participants are overly bearish and have significant protection against downside moves. That said, the ratio is not currently so high at 0.97X that I would take such a contrarian view.
Overall, the options market points to an apparent and important market dynamic. The market is bracing for a significant move from current levels with a slight negative bias. Further, there is substantial speculation and hedging activity at current prices but less demand at more extreme strike prices. Few speculators and hedgers are positioning for a tail-risk event. To me, this means we may see a significant move in the Nasdaq 100 as it either breaks below current levels or bounces higher. If stocks break lower, I expect there will be significant options volume as participants look for a lower support level. If the market bounces higher sustainably, I expect implied volatility levels will decline dramatically.
Clues From the Bond Market
The stock market is the side-show of 2022; the bond market has had the real action. The bond market’s considerable drawdown this year is essential for the Nasdaq 100 because growth stocks are more interest rate sensitive since their valuations depend on the discounted value of future cash flows (as opposed to immediate cash flows). As the future value of money increases (via higher interest rates), the immediate value of future cash flows declines. Further, as interest rates rise, growth companies struggle to obtain attractive financing, often limiting their immediate earnings. As such, contrary to the historical norm, bonds and stocks have positively correlated this year, so further declines in bonds may lead to a decrease in stocks. See below:
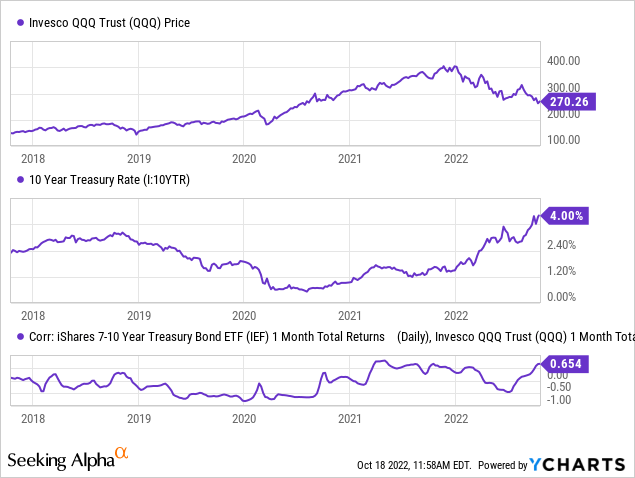
As the 10-year Treasury rate rises, the value of similar maturity Treasury bonds, such as those in the ETF (IEF), declines. As such, the correlation between IEF and the Nasdaq 100 ETF QQQ has generally been positive since inflation became an issue in late 2020. High inflation increases the correlation between bonds and stocks because both have negative inflation exposure. While some US stocks benefit from inflation (such as commodity producers), most have negative margin exposure since they’re net importers and not net exporters. This is particularly true for many technology and growth stocks which have seen input prices soar compared to selling prices.
Although interest rates are historically high, with the 10-year Treasury at 4%, they may rise even higher if inflation expectations are mispriced. The bond market is bracing for ~2.4% average inflation over the next five to ten years, far below today’s ~8%. I believe inflation will unlikely decline quickly due to the growing wage-price spiral, which makes inflation “sticky.” Further, inflation is closely related to oil prices, which I expect to rise sharply by next year due to drilling declines, OPEC cuts, and the end of SPR drawdowns. In my view, the only way for inflation to decline so dramatically would be for the economy to experience a huge and lasting recession that dramatically lowers consumer demand and business activity. Such potential would push corporate profit outlooks even lower, harming stock prices.
With this in mind, I believe stocks are in a “lose-lose” situation wherein waning economic demand may harm profits via sales (and valuations) or, if not, rising inflation will harm profits (and valuations) via lower profit margins. Bonds still have a sharply negative trend, and as they break to new lows (potentially on a higher long-term inflation outlook), we may see the Nasdaq 100 follow suit. Overall, this situation may be bullish for the ultra-short Nasdaq ETF, but not without key risks.
Risks and Rewards in SQQQ
SQQQ rises 3% for each daily 1% decline in the Nasdaq 100, making it great speculation and hedging tool. Since July, I have been bullish on the fund and have made strong returns as Nasdaq declined as expected. Of course, with strong 52-week low support, SQQQ has lost some value recently as the market has bounced.
I believe significant fundamental and technical evidence points toward a lower low for the Nasdaq 100. This outcome will likely be bullish for SQQQ, but at this point, I believe it is an inferior way to bet against declines. For one, the Nasdaq 100’s strong 52-week low support level may keep the market range-bound for some time, causing SQQQ to decay in value even if the Nasdaq remains flat overall. It is also not guaranteed that the market will break lower as expected since that depends on continued economic deterioration or much higher interest rates.
With this in mind, and considering the low SKEW index, speculators may find better “risk-to-return” potential in out-of-the-money options on the Nasdaq 100. Such options are expensive given the high implied volatility level, but out-of-the-money options are not too abnormally expensive (indicated by the low SKEW index). Thus, significant returns can be found if there is a large (20%+) downward move in the Nasdaq 100. For example, see the profit-loss chart for a 215 January QQQ put option:
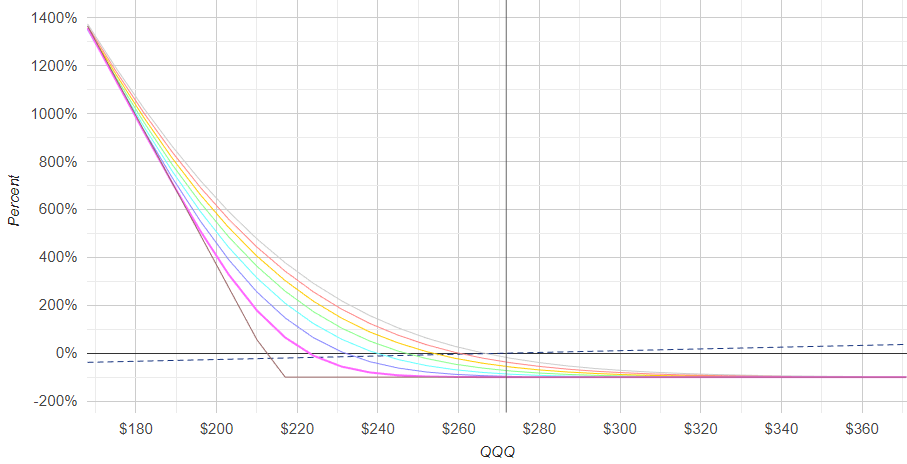
Risk-Reward Chart for January 215 QQQ Put Option (OptionsProfitCalculator)
For hedgers and speculators, I believe tail-risk put options on the Nasdaq 100 are superior to SQQQ today. The theoretical probability of profit for such an option is low at 8%, but the potential returns are upwards of 10X or more. While the options market’s theoretical probability of such a 20% decline in the Nasdaq 100 by mid-January is low, I believe this outcome would not be so unlikely if the market breaks lower, particularly given the potential for a liquidity shortage event during such an occurrence.
Be the first to comment