

marchmeena29
Investment Thesis
Three ETFs track the S&P 500 Value Index: the SPDR S&P 500 Value ETF (NYSEARCA:SPYV), the Vanguard S&P 500 Value ETF (VOOV), and the iShares S&P 500 Value ETF (IVE). IVE is the largest, with $24 billion in net assets, but SPYV is the cheapest, with a 0.04% expense ratio. Since there is virtually no difference between the three, I recommend investors pick SPYV, whose low expenses resulted in the best performance over the last decade.
That said, there are other reasons to buy SPYV. The ETF has a high level of sector and industry-level diversification, double-digit estimated sales and earnings growth, historical volatility that’s about 10% less than the broader market, and a forward earnings valuation close to five points cheaper than SPY. Other pure and enhanced value ETFs may be more appropriate for value investors with high conviction levels. However, if you’re looking for a slight value lean because the market has you worried, this article explains why it’s still a solid choice.
ETF Overview
Morningstar has a tool for comparing ETFs across different providers. It’s helpful because ETF providers can use various classification systems (ICB, GICS) and have different thresholds for what’s considered to be a large-cap stock. The table below shows how SPYV is virtually identical to VOOV and IVE at the most basic level.
Morningstar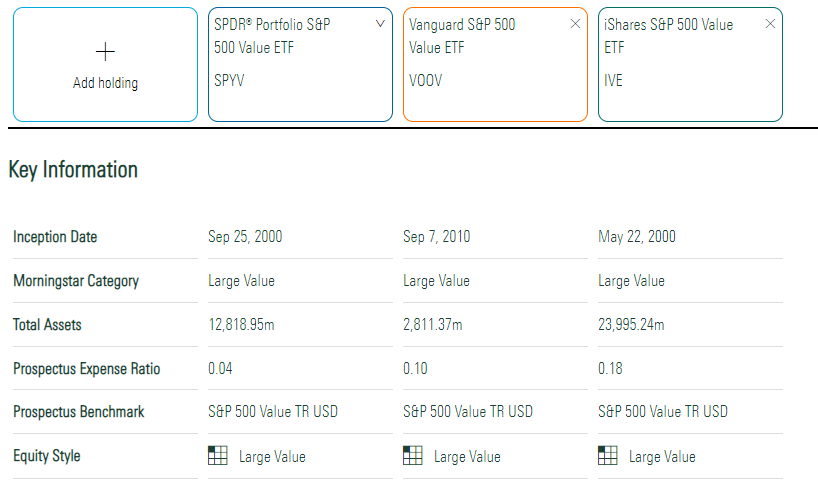
All track the S&P 500 Value Total Return Index, but SPYV’s 0.04% is the lowest. That’s translated to slightly better gains over the last ten years (10.84% vs. 10.81% vs. 10.76%). One flaw worth highlighting is that Morningstar doesn’t line up inception dates, leading to misleading annualized since inception returns. The table below suggests that VOOV is the superior ETF, with an 11.19% return. However, that’s just because it launched ten years later than SPYV and IVE. VOOV didn’t go through the tech crash in the early 2000s or the Great Financial Crisis in 2008.
Morningstar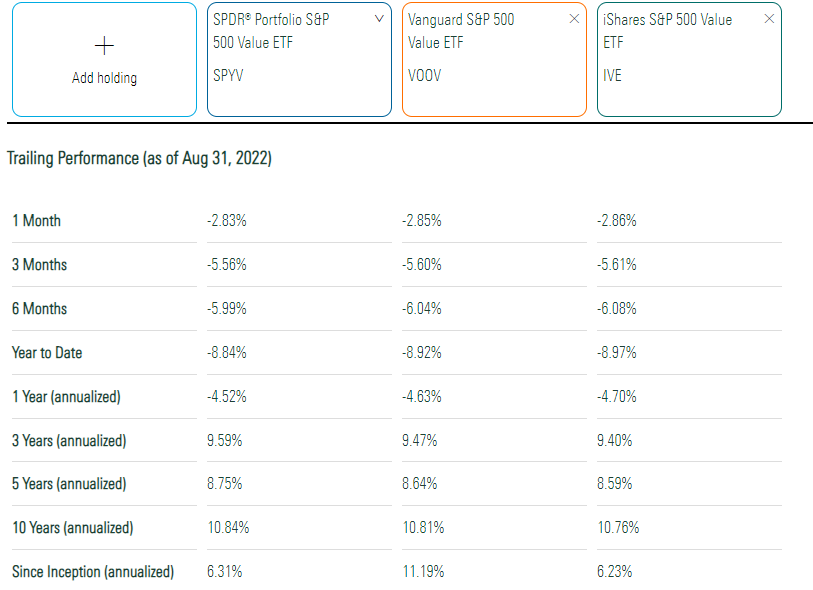
The tool allows you to compare sector exposures using the Global Industry Classification System, or GICS. For context, I’ve added the SPDR S&P 500 ETF (SPY), so you can easily see the sectors SPYV favors. Please note that Vanguard’s sector allocations are outdated, as that fund provider typically only makes public their holdings once per month and with a 1-2 month delay.
Morningstar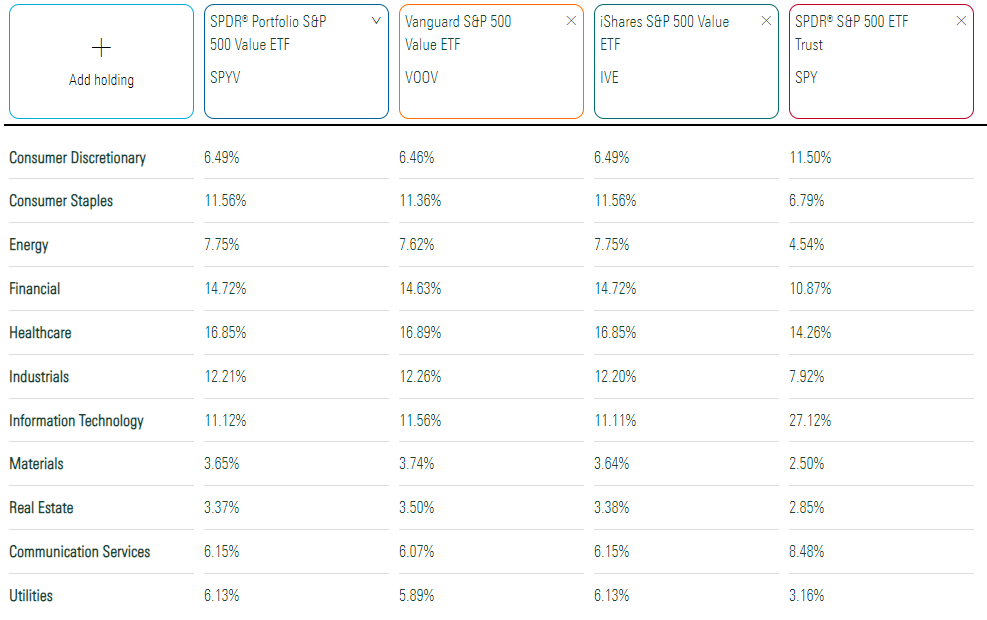
SPYV is overweight Consumer Staples, Energy, Financials, and Industrials by 3-5%, while Technology is underweighted by 16%. These simple allocations explain why all three have outperformed SPY by nearly 7% in the last year but lagged by almost 60% in the previous decade. Proponents of mean reversion expect the trend to continue, and according to Vanguard’s latest estimates as of June 2022, they may be right. Vanguard projects U.S. value equities to return between 4.4% and 6.4% per year over the next decade compared to 1.6% and 3.6% for growth.
Vanguard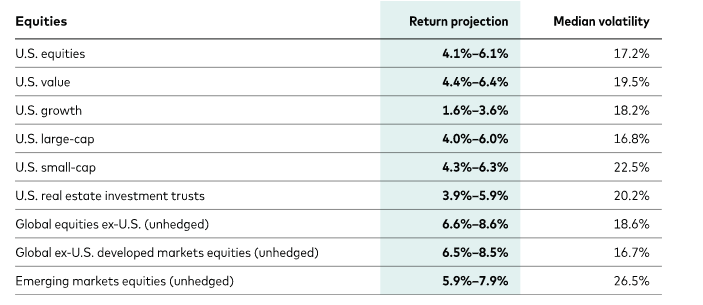
Selection Process
S&P Dow Jones Indices establish growth and value style baskets by computing growth and value composite scores for each S&P 500 constituent. The criteria are shown in the image below.
S&P Dow Jones Indices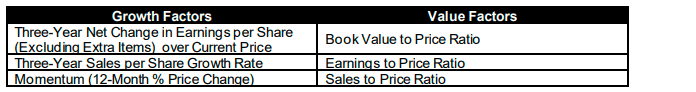
The value factors are inverses of the price-book, price-earnings, and price-sales ratios. The growth factors focus on historical earnings per share and sales growth, and momentum based on price changes over the last year. These criteria aren’t complex, but what’s not considered is worth highlighting. For example, a volatility screen could provide downside protection, which I think many value investors would appreciate.
An important consideration is that the S&P 500 Value and Growth Indexes overlap. 183 of the 446 holdings in the Value Index are also in the Growth Index. However, you’ll find that the most prominent names are only in one index. For example, Berkshire Hathaway (BRK.B), Johnson & Johnson (JNJ), and Exxon Mobil (XOM) are only in the Value Index. Meanwhile, Apple (AAPL), Microsoft (MSFT), Alphabet (GOOGL, GOOG), Amazon (AMZN), Tesla (TSLA), Meta Platforms (META), and NVIDIA (NVDA) are only in the Growth Index. Due to their significant market capitalizations, this means both Indexes have entirely different characteristics. You can see SPYV’s top ten holdings below.
State Street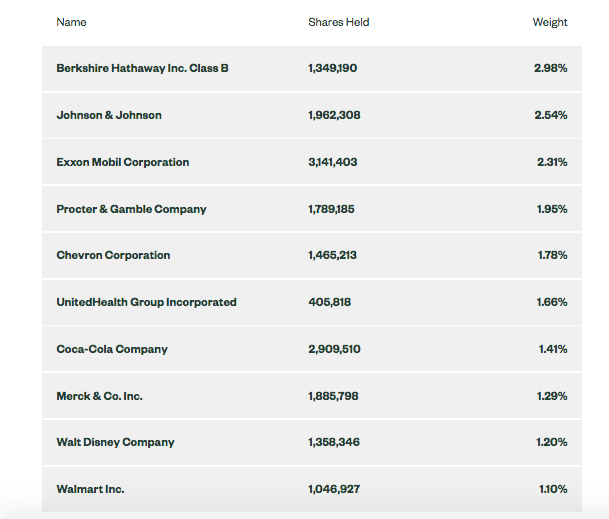
Fundamentals vs. VTV
The following is a summary of SPYV’s fundamentals against another well-regarded large-cap value ETF worth considering: the Vanguard Value ETF (VTV). VTV is the largest value ETF on the market, with over $97 billion in net assets under management. It’s also been a top performer over the last decade, producing a 23.30% higher return.
The Sunday Investor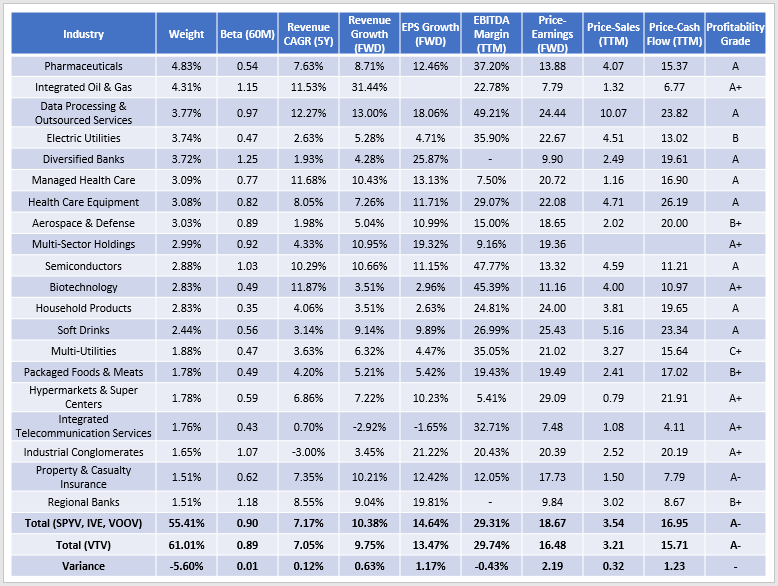
In most cases, the differences are minor. SPYV has a forward price-earnings ratio that’s 2.19 points higher than VTV (18.67 vs. 16.48), but it also has slightly higher sales and earnings growth per share growth estimates. SPY also has higher trailing price-sales and price-cash flow valuations, so I think it will underperform VTV in a bear market but do better if the market rebounds.
Diversification is also a key consideration. SPYV has 55.41% of assets concentrated in their top 20 industries compared to 61.01% for VTV. Furthermore, it overweight stocks like Walt Disney (DIS), Visa (V), Mastercard (MA), Costco (COST), and McDonald’s (MCD), which are all great companies likely to thrive in a strong economy. The offsets are primarily in defensive Health Care stocks like UnitedHealth Group (UNH), Pfizer (PFE), Eli Lilly (LLY), and AbbVie (ABBV).
Investment Recommendation
SPYV is the cheapest ETF tracking the S&P 500 Value Index and superior to VOOV and IVE from that perspective. The ETF is well-diversified with 446 securities, and even though it’s value-focused, S&P Dow Jones’ methodology still considers growth factors when designing its style baskets. The result is a portfolio that only slightly leans value and still has double-digit estimated sales and earnings growth to ensure adequate participation in a bull market.
Investors should also look at VTV as an alternative. It’s less diversified but cheaper on a forward earnings basis because it overweights blue-chip Health Care stocks. That’s probably not a bad idea, given the uncertain market, but I don’t think it will make a huge difference either way. For those wanting even more choices, I encourage you to check out my latest guide to U.S. Value ETFs, which compares strategies, performance, and fundamentals for nearly 70 ETFs. I hope you find what you’re looking for, and I am happy to answer any questions in the comments section below.
Be the first to comment